
Author(s)

This article is also featured in Energy Insights, which reflects a sample of ongoing research across the Center for Energy Studies’ diverse programmatic areas, all addressing the ever-evolving energy challenges across Texas, the U.S., and the globe. Read more from the inaugural edition.
In May 2023, the Federal Funds Rate topped 5% for the first time since the Great Recession of 2007–08.[1] From that time onward, market participants’ predictions have reversed course several times about when the Federal Reserve might stop raising interest rates to fight inflation and when it might reverse course and start reducing interest rates again. As of mid-June 2024, the picture remains murky. At one extreme, some are still forecasting two or more interest rate cuts before the end of the year. At the other extreme, some forecast a possible interest rate hike before the end of the year.[2]
Figure 1 — West Texas Intermediate (WTI) and Supernormal Backwardation with Percentage Difference Between CL1 and CL4

For analysts interested in forecasting oil prices in the near term, the financial market sport of Fed watching — trying to anticipate monetary policy changes — is a must because it has implications for commodity prices and the term structure of futures prices. Figure 1 shows that over the past year, oil prices have closely followed the market condition termed, “supernormal backwardation”: the degree to which the front-month price is abnormally high, percentage-wise, relative to later — here fourth — month futures contract prices.[3] This analysis was motivated by the insight that financial speculators prefer to trade in the most liquid front-month West Texas Intermediate (WTI) contract, which serves as tail-wagging-the-dog, purely-financial speculation in short-term futures contracts that may be driving longer-tenor futures prices.
Figure 2 — Supernormal Backwardation with Percentage Difference Between CL1 and CL4 and Money Managers’ Net Long Positions in WTI Futures
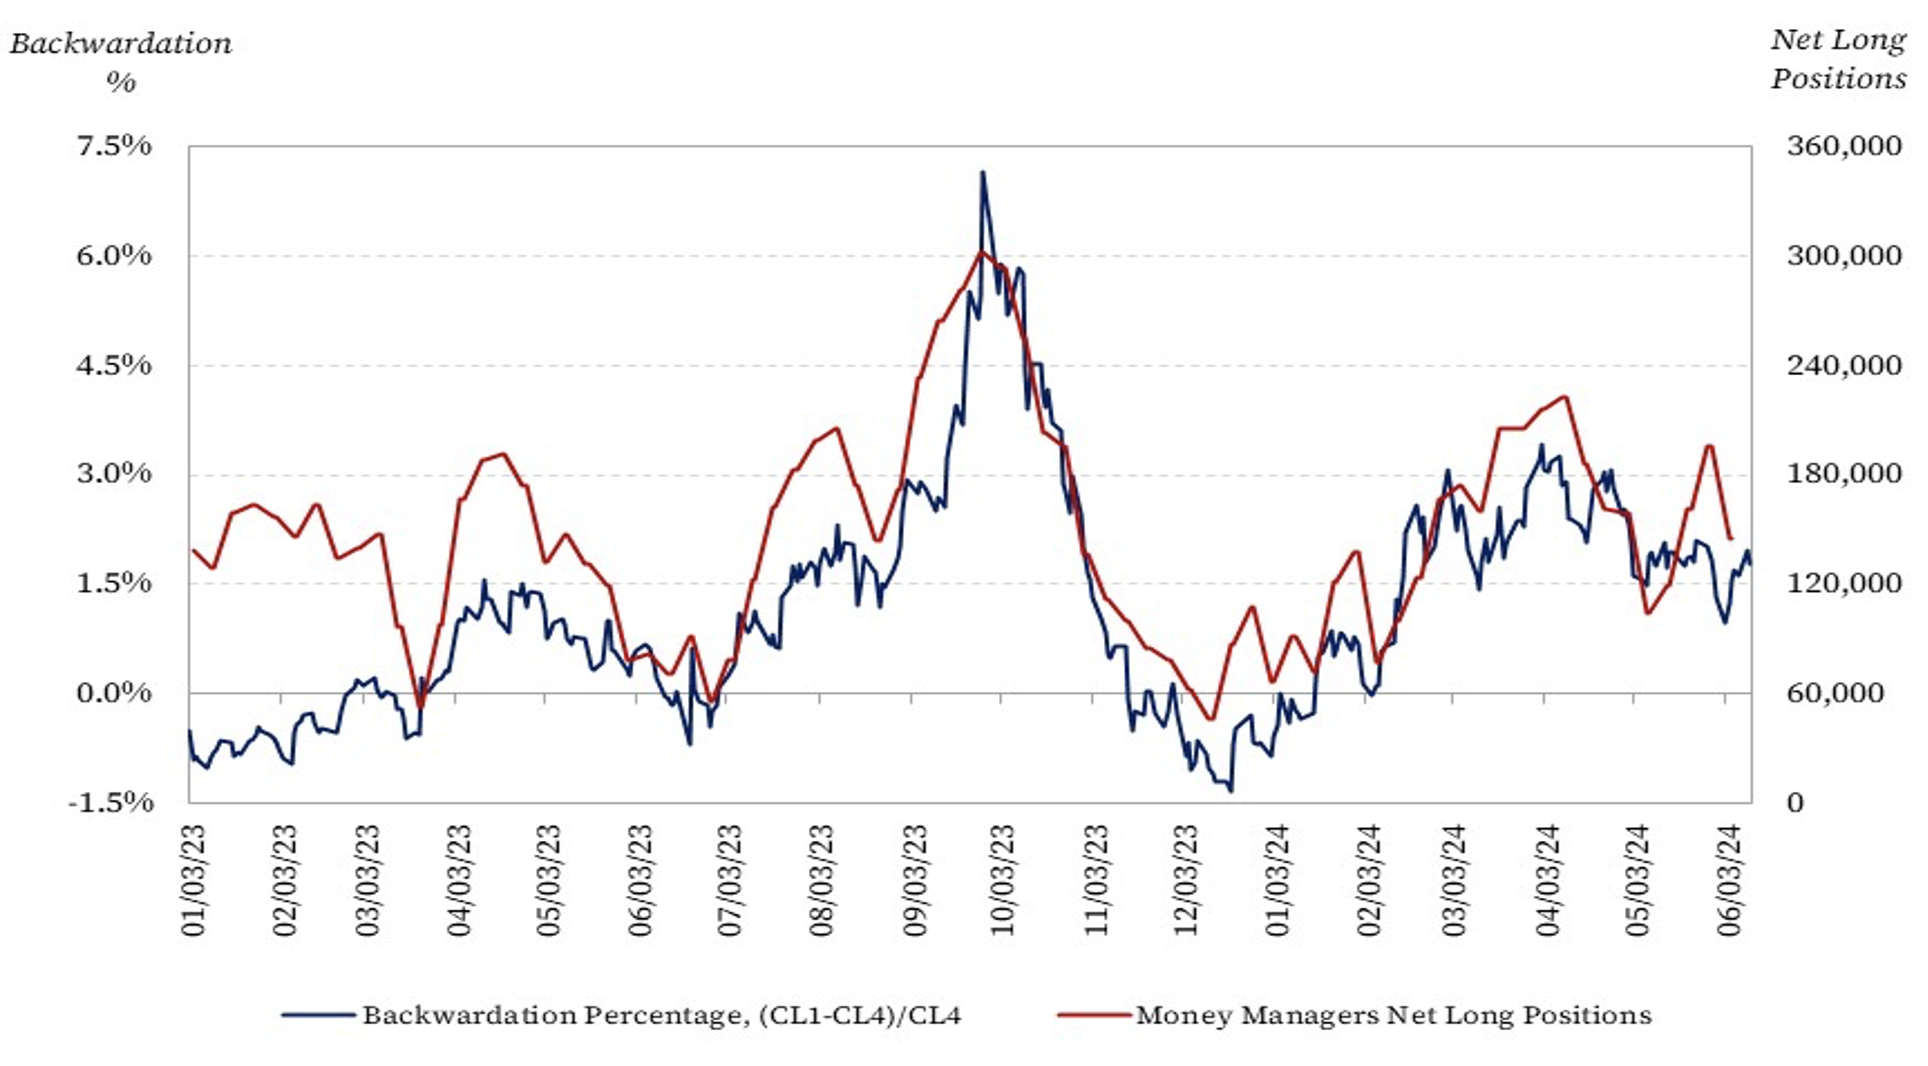
Figure 2 validates our insight that speculators tend to invest in the most liquid front-month contract. It shows that since May 2023, the degree of supernormal backwardation has followed very closely the net long positions of money managers in oil futures contracts. In other words, this supports the hypothesis that the speculative behavior of money managers has strongly influenced oil prices over the past year. Indeed, money managers have invested in oil futures, as well as other commodity futures, as financial assets that are relatively uncorrelated with bonds. When bonds underperform, the shift to investing in oil futures tends to raise the front-month price. Bond prices fall when interest rates rise, a phenomenon that almost caused a domino-effect worldwide banking crisis when the medium-sized Silicon Valley Bank failed in March 2023. Hence, rising interest rates provide a financial market signal that influences oil futures.
There is ample direct evidence of purely financial speculation in commodities in the recent Fed monetary policy cycle. As early as April 2022, when the Fed had just started raising interest rates to fight inflation, Bloomberg reported that investment advisors at Bridgewater had advised investors to switch from bonds to commodities. The article was explicitly titled: “With Bonds in A ‘Coma,’ Buy Commodities.”[4] By February 2024, Bloomberg reported that the most successful hedge fund, Citadel, which considers commodities to be one of their five core investment strategies, “along with equities, credit and convertibles, quantitative strategies and fixed income and macro,” had made profits of more than $8 billion in 2022 and $4 billion in 2023 from their commodities investments.[5] Investors seeking returns in this asset class may focus on different commodities at different times. Indeed, earlier and later in the cycle, they focused primarily on gold, silver, and copper. However, oil became the primary focus in this mini bubble after the terrorist attack of Hamas on Israel on Oct. 7, 2023.
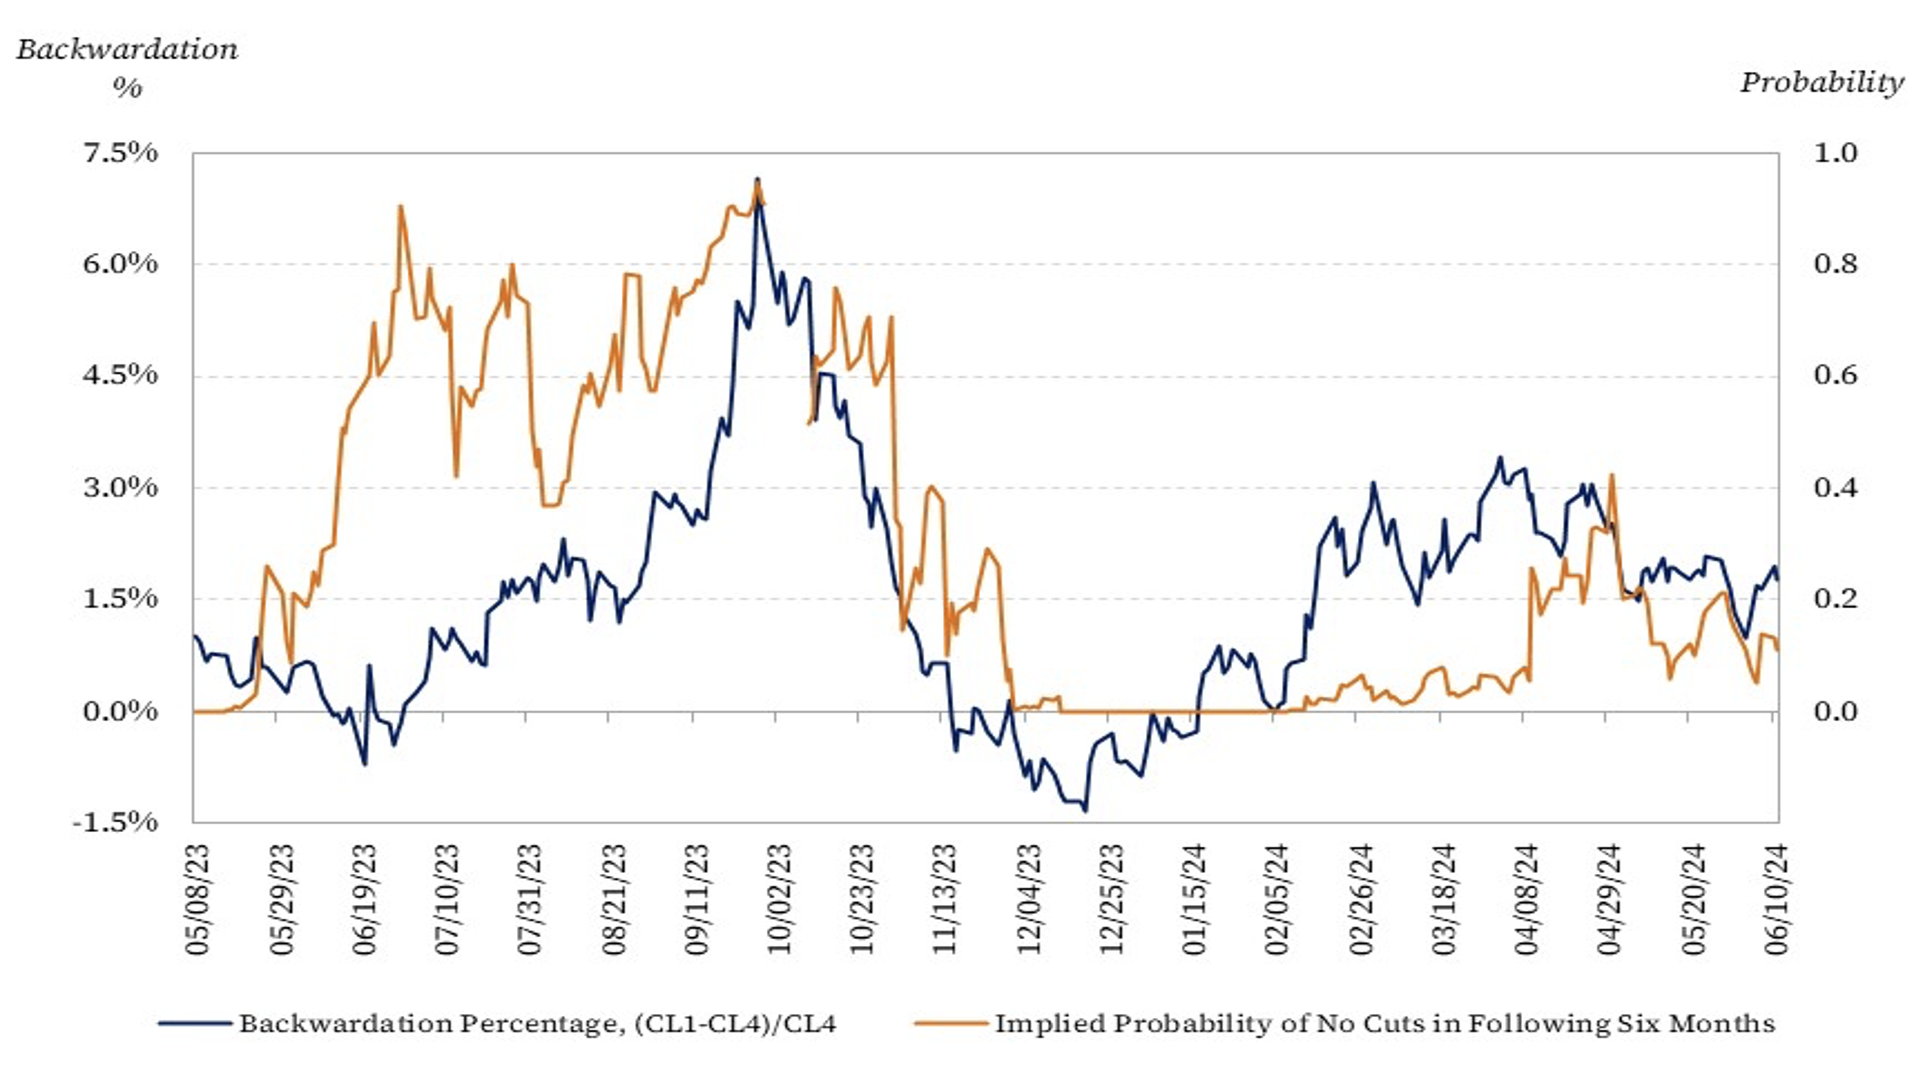
It now remains to show that fluctuations in money managers’ net long positions, which drove fluctuations in oil prices, followed Federal Reserve policy forecasts of Fed watchers. CME Group’s FedWatch Tool’s historical data can be used to construct a series of the implied probability of no interest rate cuts in the following six months starting at each date.[6] Those probabilities are imputed from prices of CME options on the secured overnight offer rate (SOFR), which is calculated from aggregated data on banks’ overnight Treasury bill repo agreements. While the methodology for estimating these unconditional probabilities is questionable, it is sufficient for our purpose.
Figure 3 shows that the periods with a calculated heightened probability of no interest rate cuts over the following six months, which are detrimental for bonds, are periods during which supernormal backwardation of the WTI forward curve and front-month WTI prices rises significantly. The two most prominent episodes were around October 2023 and early 2024. It is easy to attribute the rise in oil prices in October 2023 only to the terrorist attack by Hamas on Israel, Israel’s military response, and the fear of greater Middle East military hostilities. This geopolitical narrative is an important part of our explanation for why liquidity would flow to oil markets, rather than other commodities like metals, as we had seen earlier and later. Still, an essential driver of that mini bubble in commodities is the relative unattractiveness of bonds when interest rates are not expected to fall significantly in the near future.
Figure 3 — Supernormal Backwardation of WTI Against Implied Probability of No Rate Cuts in Following Six Months
In addition to fundamental market analysis — based on the physical market supply and demand of oil — and geopolitical analysis — focused on potential disruption or manipulation of the physical market — those interested in forecasting oil prices should also join the ranks of Fed watchers. As monthly data on inflation and unemployment are released, Fed watchers update their beliefs by forecasting near-term interest rate cuts if inflation declines quickly or unemployment rises quickly, and vice versa. Fed watchers also monitor speeches by various Federal Reserve Bank presidents for hints about future policy changes. All financial markets react to those data and hints, including oil markets. The remainder of 2024 into 2025 will look no different.
< Previous article | Next article >
Notes
[1] Jeff Cox, “Fed Increases Rates a Quarter Point and Signals a Potential End to Hikes,” CNBC, last modified May 4, 2023, https://www.cnbc.com/2023/05/03/fed-rate-decision-may-2023-.html.
[2] On June 11, 2024, the Atlanta Fed estimated, based on CME options prices, that the probability of an interest rate hike before the end of 2024 was approximately 2.8%, while the probability of two or more cuts was approximately 12.3% (Federal Reserve Bank of Atlanta, “Market Probability Tracker,” https://www.atlantafed.org/cenfis/market-probability-tracker). As recently as late April, Barclays had increased their estimated odds of an interest rate hike before the end of 2024 to 29% (Gertrude Chavez-Dreyfuss, “Inflation-Wary US Rate Options Market Cautiously Price for 2024 Fed Hike,” Reuters, April 29, 2024, https://www.reuters.com/markets/us/inflation-wary-us-rate-options-market-cautiously-prices-2024-fed-hike-2024-04-29/). The wide range and fluctuation of estimates inferred from options data is indicative of the high degree of uncertainty that is likely to persist throughout the year.
[3] Mahmoud A. El-Gamal, Amy M. Jaffe, and Medlock, “Cheap Money, Geopolitics, and Supernormal Backwardation of the WTI Forward Curve,” Economics of Energy and Environmental Policy 12, no. 1 (2023): 57–79, https://doi.org/10.5547/2160-5890.12.1.melg.
[4] John Gittelsohn, “With Bonds in a ‘Coma,’ Buy Commodities: Bridgewater’s Patterson,” Bloomberg, April 8, 2022, https://www.bloomberg.com/news/articles/2022-04-08/with-bonds-in-a-coma-buy-commodities-bridgewater-s-patterson.
[5] Devika Krishna Kumar, “Citadel Made More Than $4 Billion from Commodities in 2023,” Bloomberg, last modified February 22, 2024, https://www.bloomberg.com/news/articles/2024-02-22/citadel-makes-more-than-4-billion-from-commodities-in-2023.
[6] CME Group, “FedWatch,” https://www.cmegroup.com/markets/interest-rates/cme-fedwatch-tool.html.
This material may be quoted or reproduced without prior permission, provided appropriate credit is given to the author and Rice University’s Baker Institute for Public Policy. The views expressed herein are those of the individual author(s), and do not necessarily represent the views of Rice University’s Baker Institute for Public Policy.


