
Overview
Houston Independent School District (HISD) is currently experiencing a mismatch between school facility usage and student enrollment. While some campuses are over capacity, others remain underutilized. Recent trends and demographic data suggest a need for strategic adjustments in facilities planning to better align with future demand. While data on utilization, facility conditions, and demographics are important in determining how to invest in the future structure of the district, school locations should also consider the needs of students throughout the district. This will require a flexible, forward-thinking strategy that accounts for shifting demographics while considering the diverse needs of students.
A recent issue brief analyzed campus utilization data for HISD during the 2023–24 school year, using a standard metric that divides enrollment by total permanent building capacity. The analysis revealed significant disparities across campuses, with approximately 50% facing under enrollment and about 25% experiencing over enrollment. The data underscore uneven enrollment patterns across the district and reflect broader demographic shifts in the school-age population.
This issue brief goes further, examining additional data to better understand changes in HISD’s school utilization and student population over the last decade. It also analyzes data on school facility conditions in 2012 and how those conditions have changed since then. The additional data is focused on:
- Changes in campus utilization rates between the 2011–12 and 2023–24 school years.
- Campus utilization rates by campus type.
- Facility condition index values for campuses in 2012.
- Projected facility condition index changes following the 2012 HISD bond.
- Actual facility condition index values and educational adequacy index values as of 2020
Capacity Utilization Over Time and by School Type
According to data published by HISD, overutilization was a significant issue in the 2011–12 school year, with more than 45% of campuses operating above 100% capacity. The data pointed to a growing shortage of available seats, particularly if enrollment increased faster than projected. At that time, 73.5% of campuses had occupancy rates of 76% or higher, indicating widespread strain on facilities. Conversely, fewer than 10% of campuses had utilization rates below 50%, suggesting that underuse was a relatively minor concern.
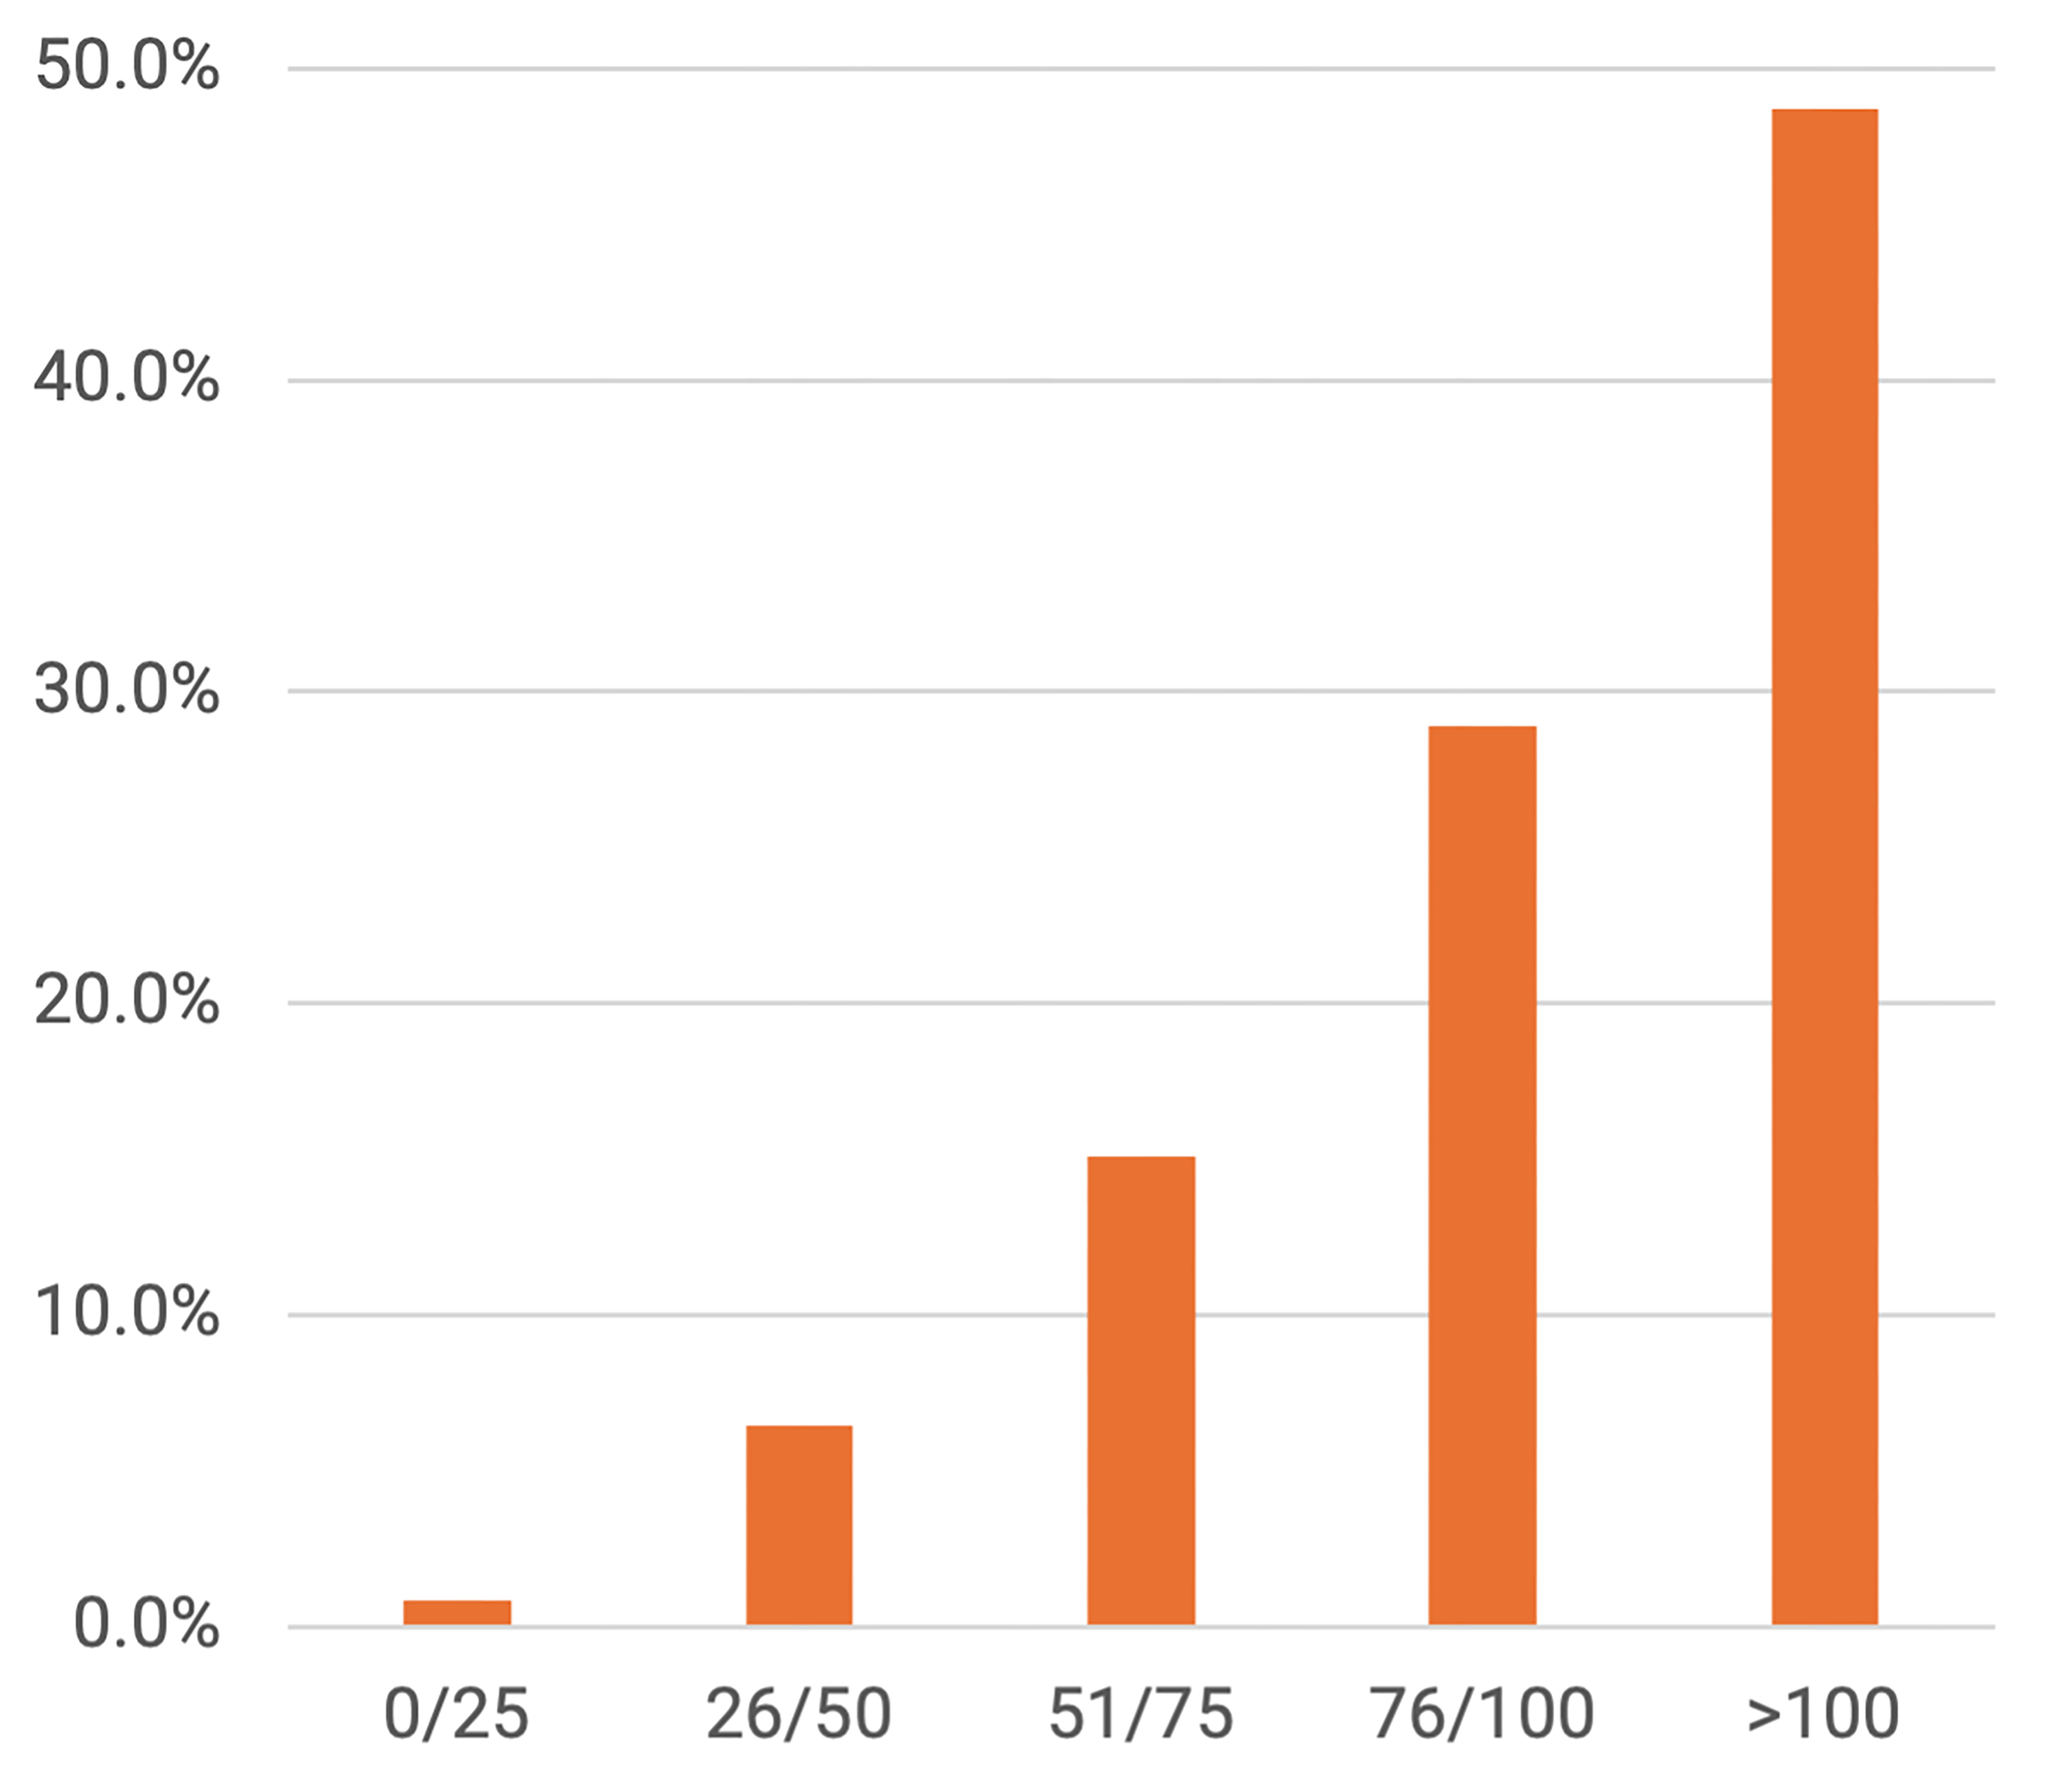
As shown in Figure 1, the data depicted a district facing the challenge of accommodating a growing student population. Furthermore, projections made in 2012 for the 2019–20 school year anticipated that overutilization would worsen, with nearly 50% of campuses expected to exceed capacity, as shown in Figure 2. At the time, continued population growth appeared likely, and the 2012 forecasts suggested that HISD might require additional facility space across the district.
Figure 1 — Percentage of HISD Campuses by Occupancy Rate, 2011–12
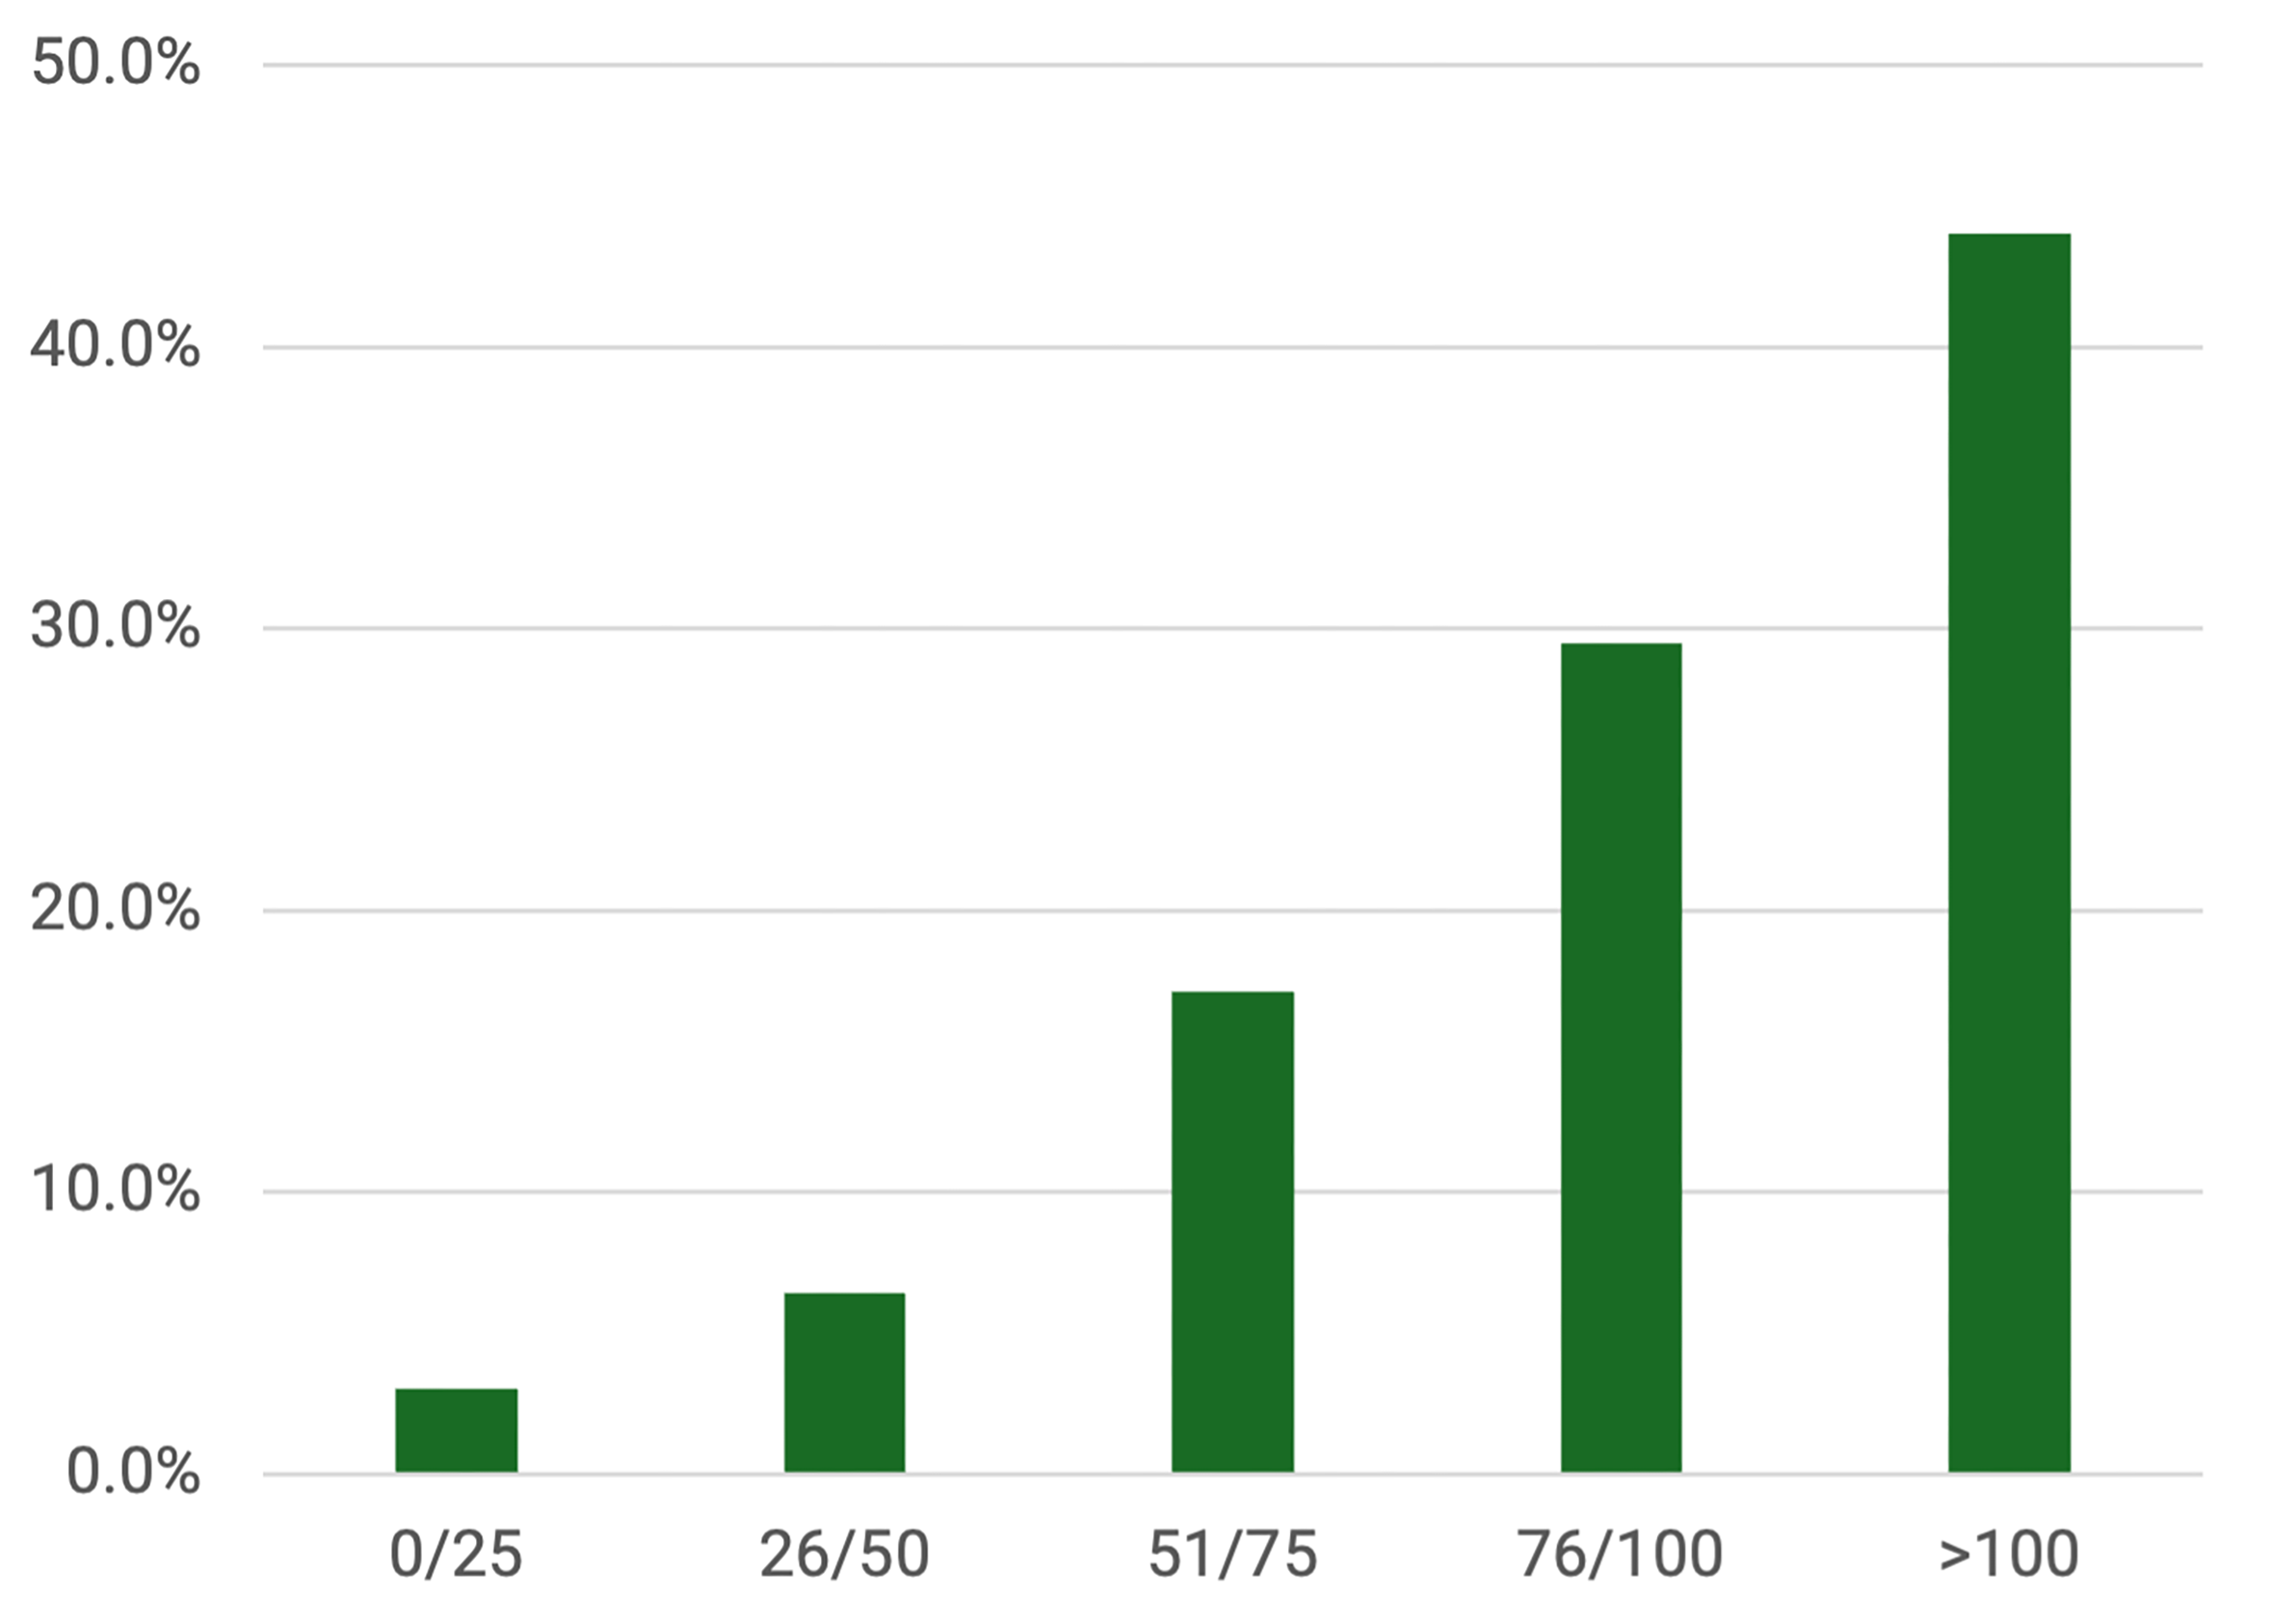
Figure 2 — Percentage of HISD Campuses by Occupancy Rates 2019–20, as Projected in 2012
In contrast, HISD occupancy data for the 2023–24 school year reflects a notable shift in utilization patterns. While more than 45% of campuses were over capacity in 2011–12, current data show a significant number now falling into the 51%–75% and 76%–100% occupancy ranges. Though a considerable number of schools still exceed 100% capacity, an increasing number are now operating below 50% utilization — a condition that was relatively uncommon in 2011–12. This evolving landscape suggests that the district’s primary challenge has shifted from overcrowding to the broader issue of inefficient resource allocation.
The presence of both over- and under-capacity schools signals a misalignment between facility distribution and current enrollment patterns, underscoring the need for a more adaptive, data-driven approach to district planning. As noted in the earlier brief, Houston’s population pyramid reveals a shrinking base of school-aged children, reflecting long-term demographic shifts that may reduce future demand for school seats. While earlier projections anticipated student population growth, current forecasts suggest that enrollment is likely to remain flat or decline in the years ahead.
Figure 3 — Number of HISD Campuses by Percentage Occupancy Rate, 2023–24
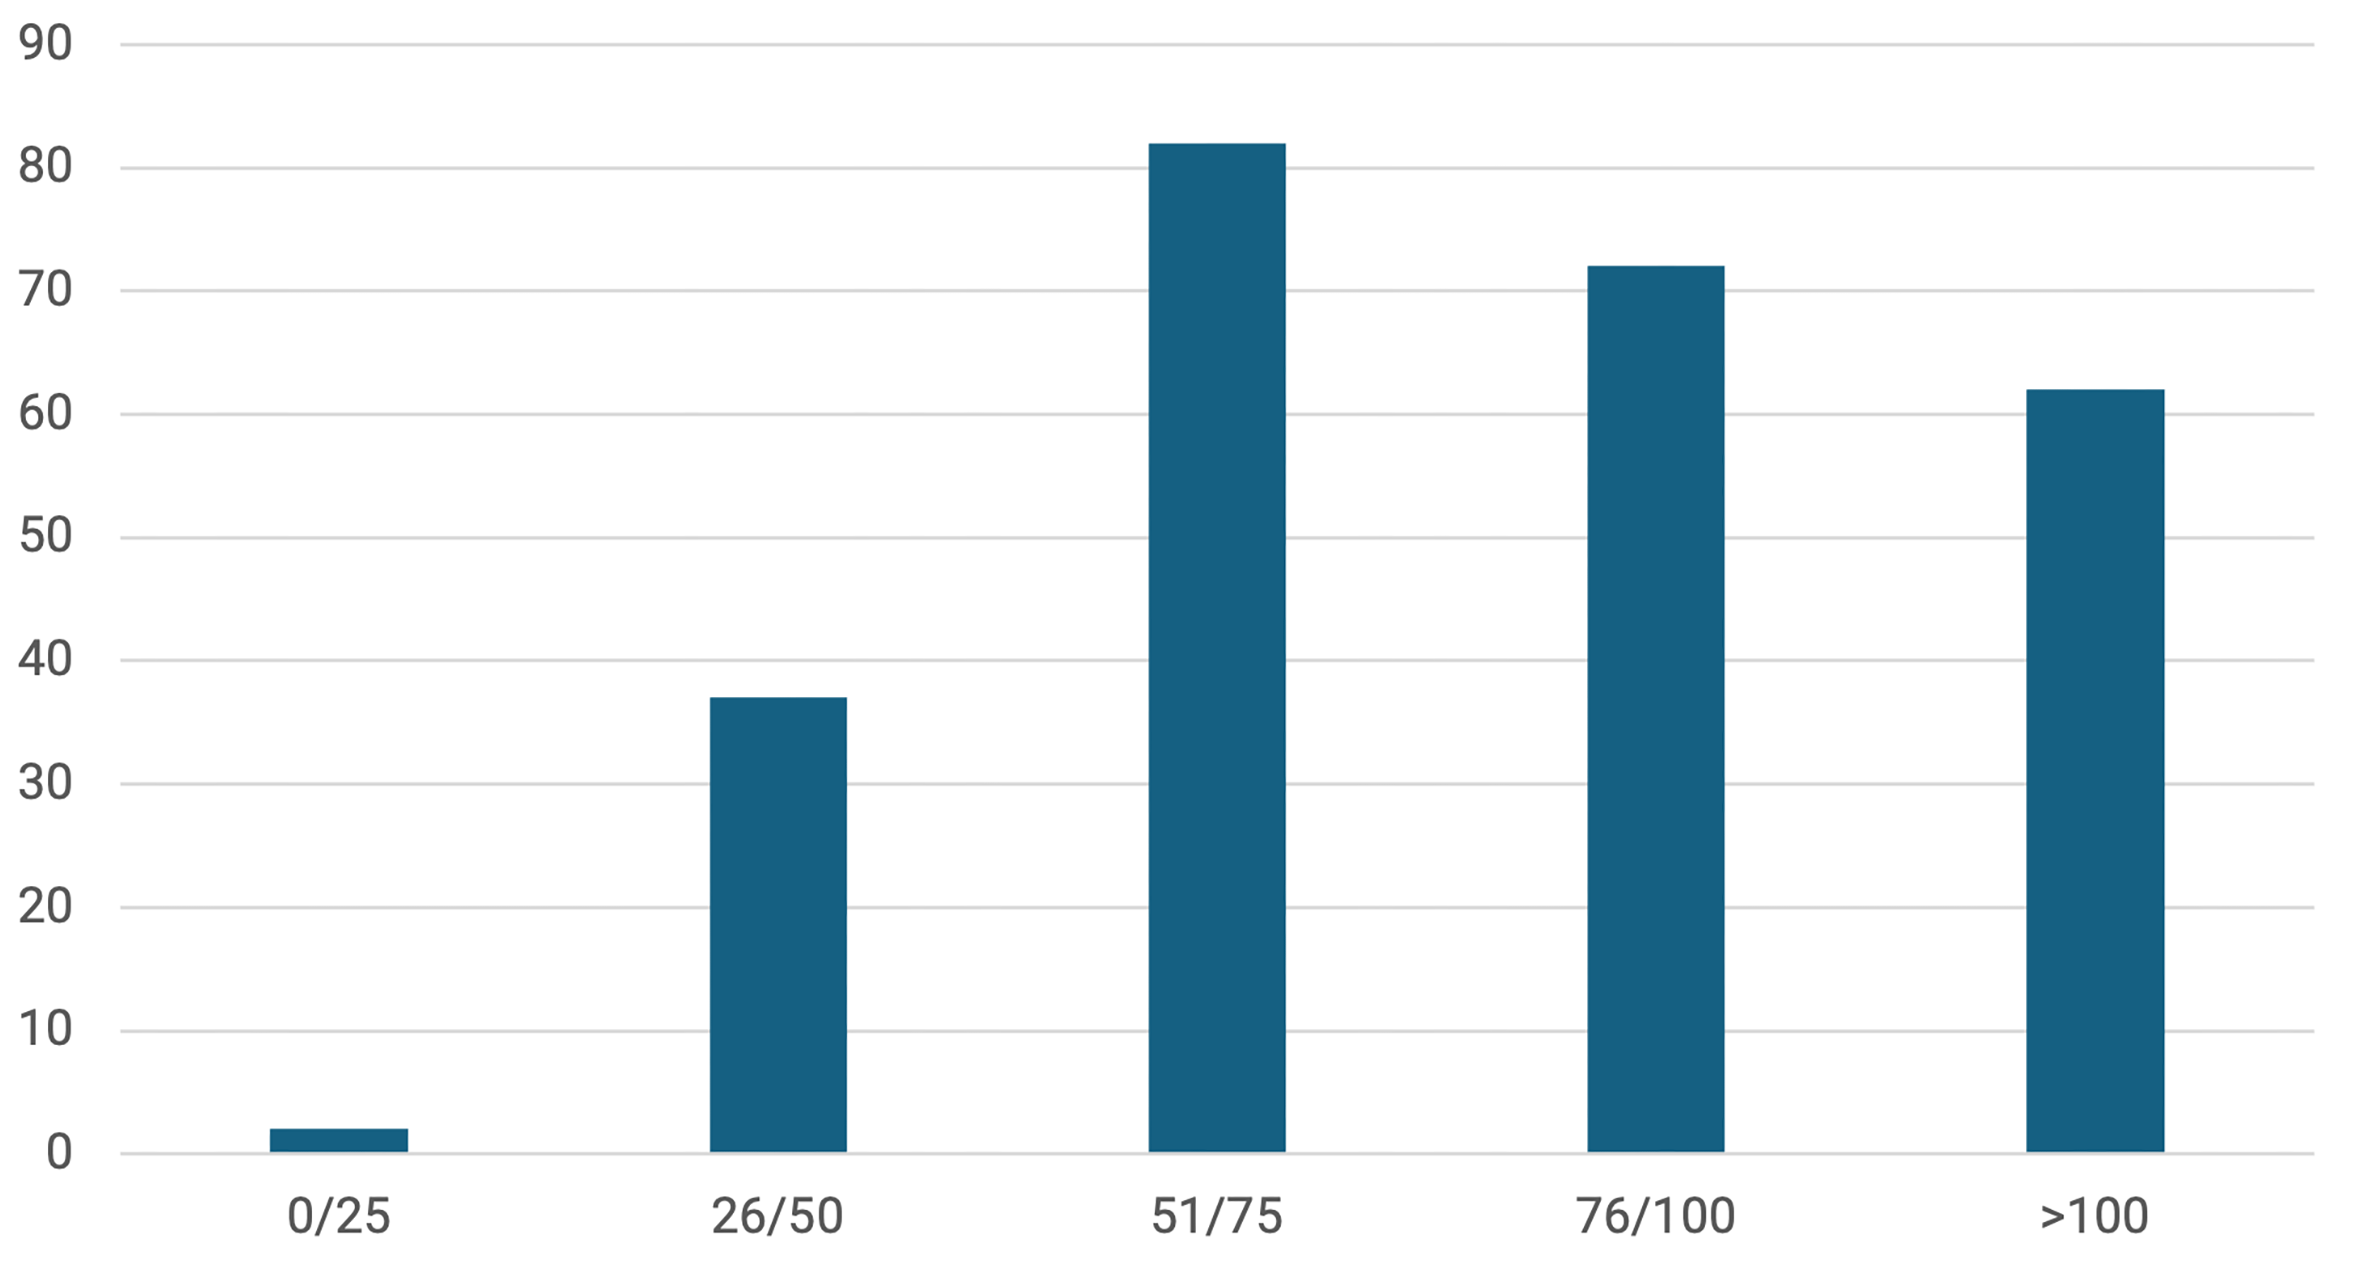
This shift in utilization patterns has significant implications for HISD’s facilities strategy. With fewer students expected, the district can no longer rely on growth to justify maintaining or expanding its existing building inventory. Instead, these demographic trends underscore the need to revise facility planning with an emphasis on right-sizing the district — through consolidation, targeted investment, and equitable resource allocation — to better align with current and future enrollment realities.
Figure 4 — Types of HISD Campuses by Percentage Occupancy, 2023–24
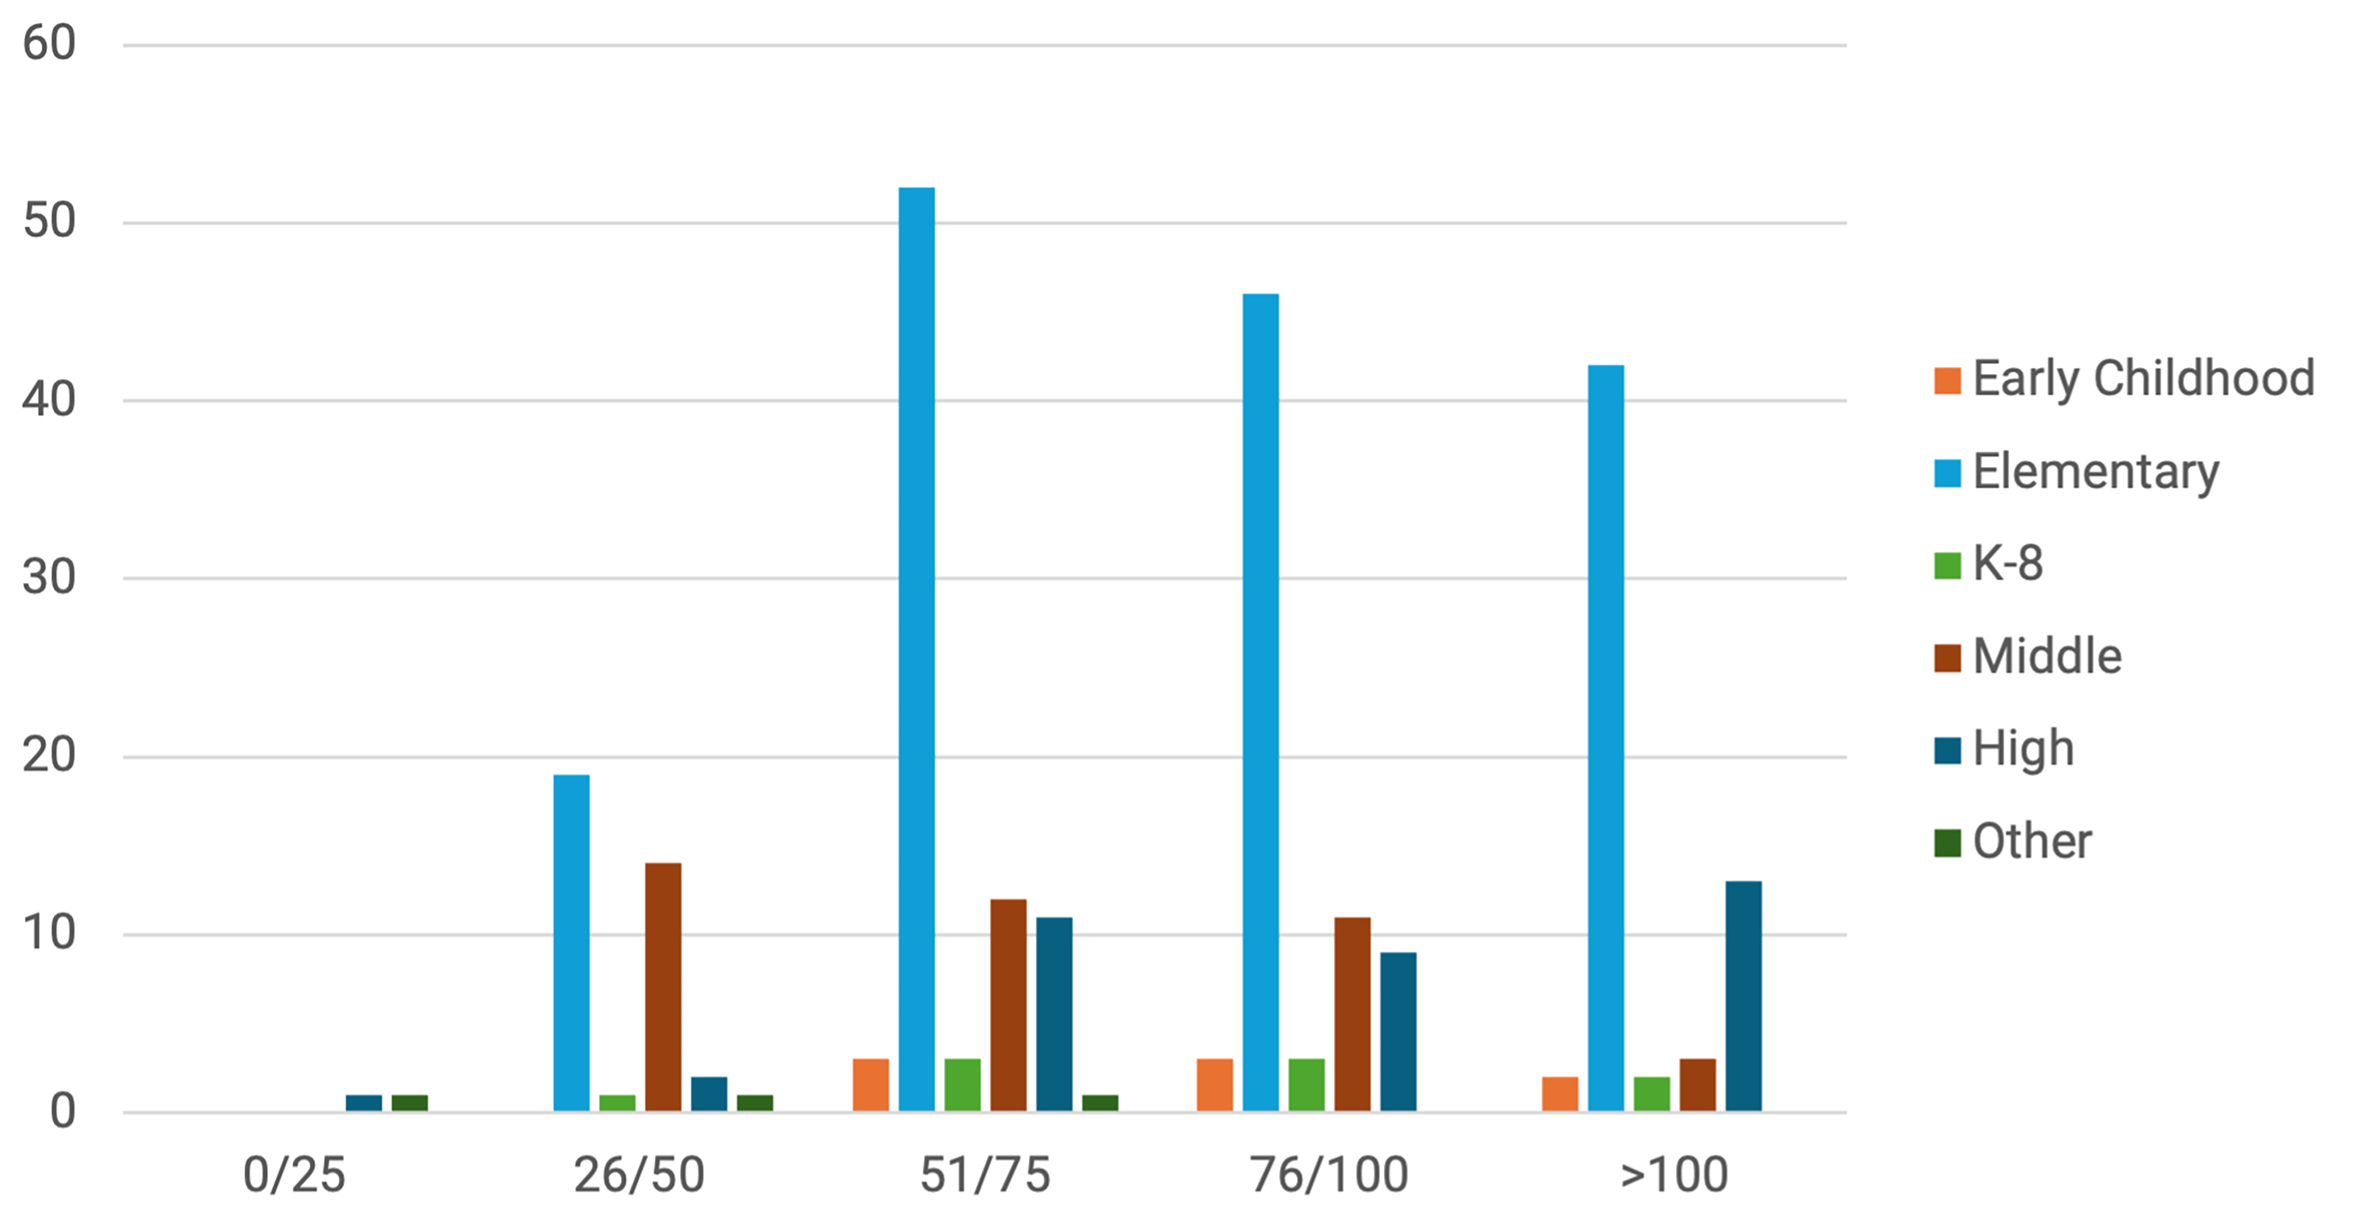
The distribution of HISD campuses by school type and occupancy rate reveals important differences in how various types of schools are utilized. Elementary schools make up a significant portion of all occupancy categories, particularly in the 51%–75% and 76%–100% ranges. Middle and high schools tend to cluster in the higher occupancy bands, with several exceeding 100% capacity — suggesting that secondary school campuses are more likely to face overcrowding. In contrast, early childhood and K-8 schools are more evenly distributed across occupancy levels and represent a smaller share of school campuses districtwide. Notably, campuses in the “other” category — including alternative, special education, and charter schools — mainly fall into the under-capacity range, reflecting the specialized programs these schools offer for specific student populations.
Facility Condition and Capacity Utilization
The Facility Condition Index (FCI) offers key insights into the state of HISD school buildings. An FCI of 0%–5% indicates excellent condition, 5%–10% is considered good, 10%–30% is fair, 30% and above signals the need for attention, and anything above 60% suggests a building needs to be replaced. Analyzing HISD’s FCI alongside campus capacity data helps illustrate the district’s infrastructure challenges.
Data Gaps and Recent Improvements
HISD used the 2012 data to allocate bond funds for renovation and reconstruction of 40 campuses. Several other campuses were renovated following damage by Hurricane Harvey in 2017, though these improvements were not funded by the 2012 bond.
To account for these facility improvements, this analysis updates the FCI for all schools that were renovated or replaced, assigning them to the 0%–5% category — generally giving them an FCI score of 0.3% or 0.5%. Figures 5 and 6 reflect the unadjusted FCI data, while Figures 7 and 8 use adjusted data to account for the improvements mentioned above.
Figure 5 — Average Unadjusted FCI Score of HISD Campuses by Occupancy Rate, 2011–12
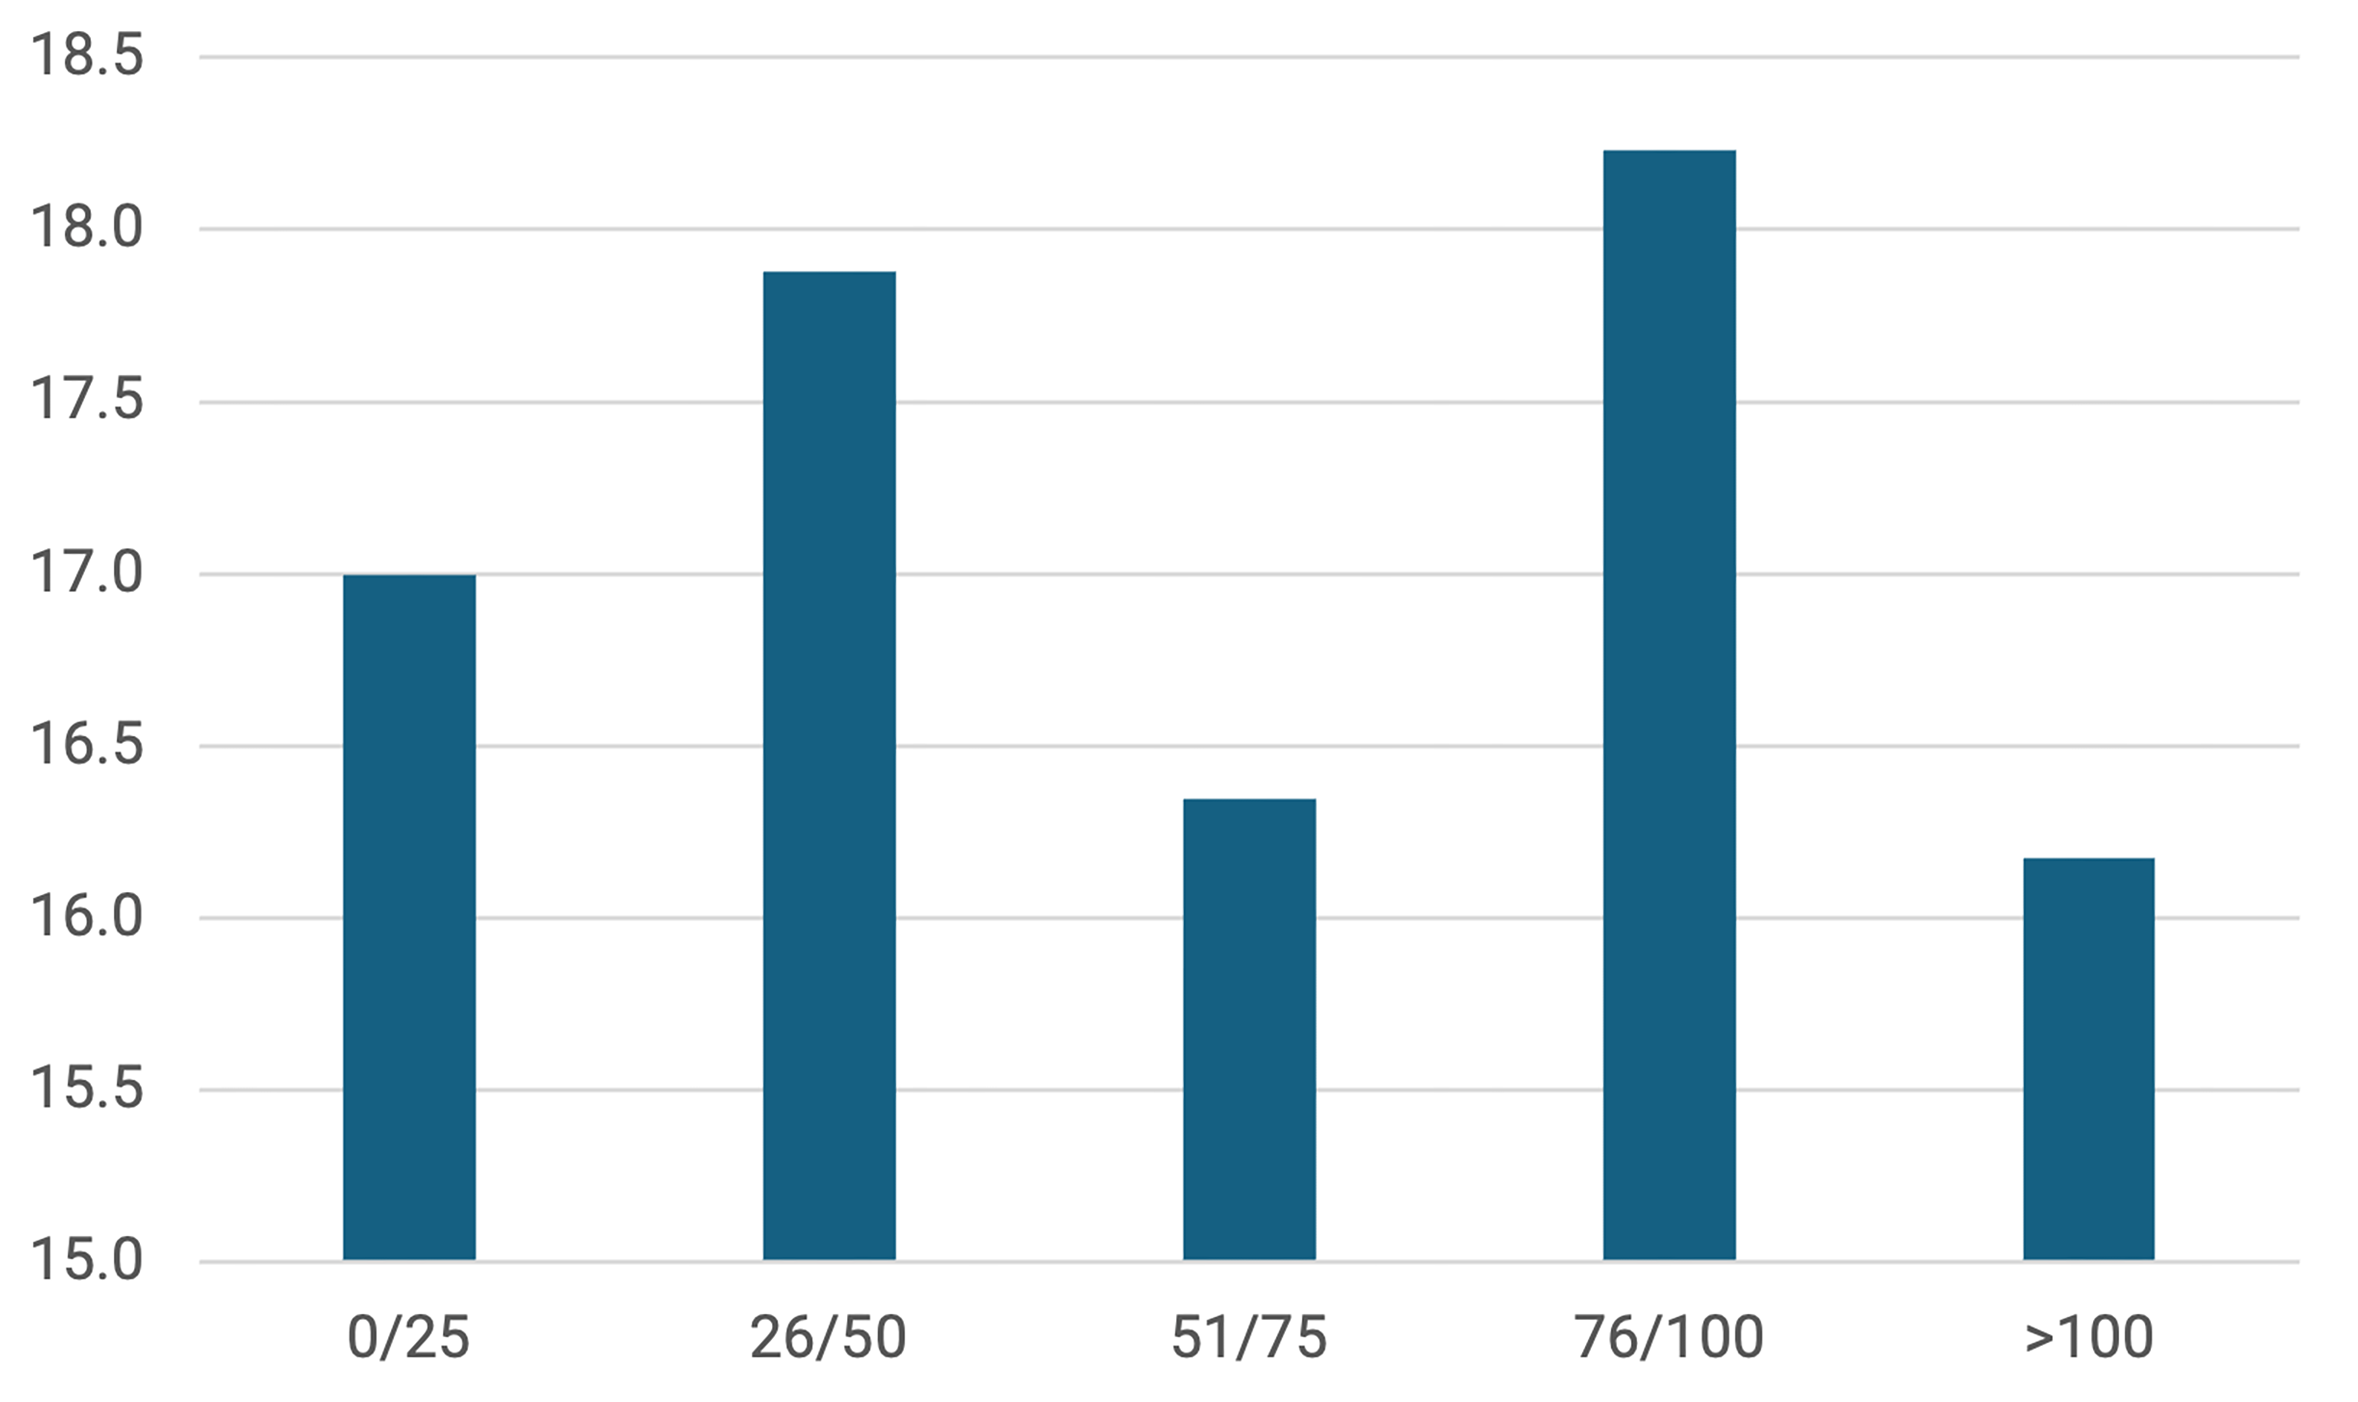
Figure 6 — Number of HISD Campuses by Unadjusted FCI Score Range
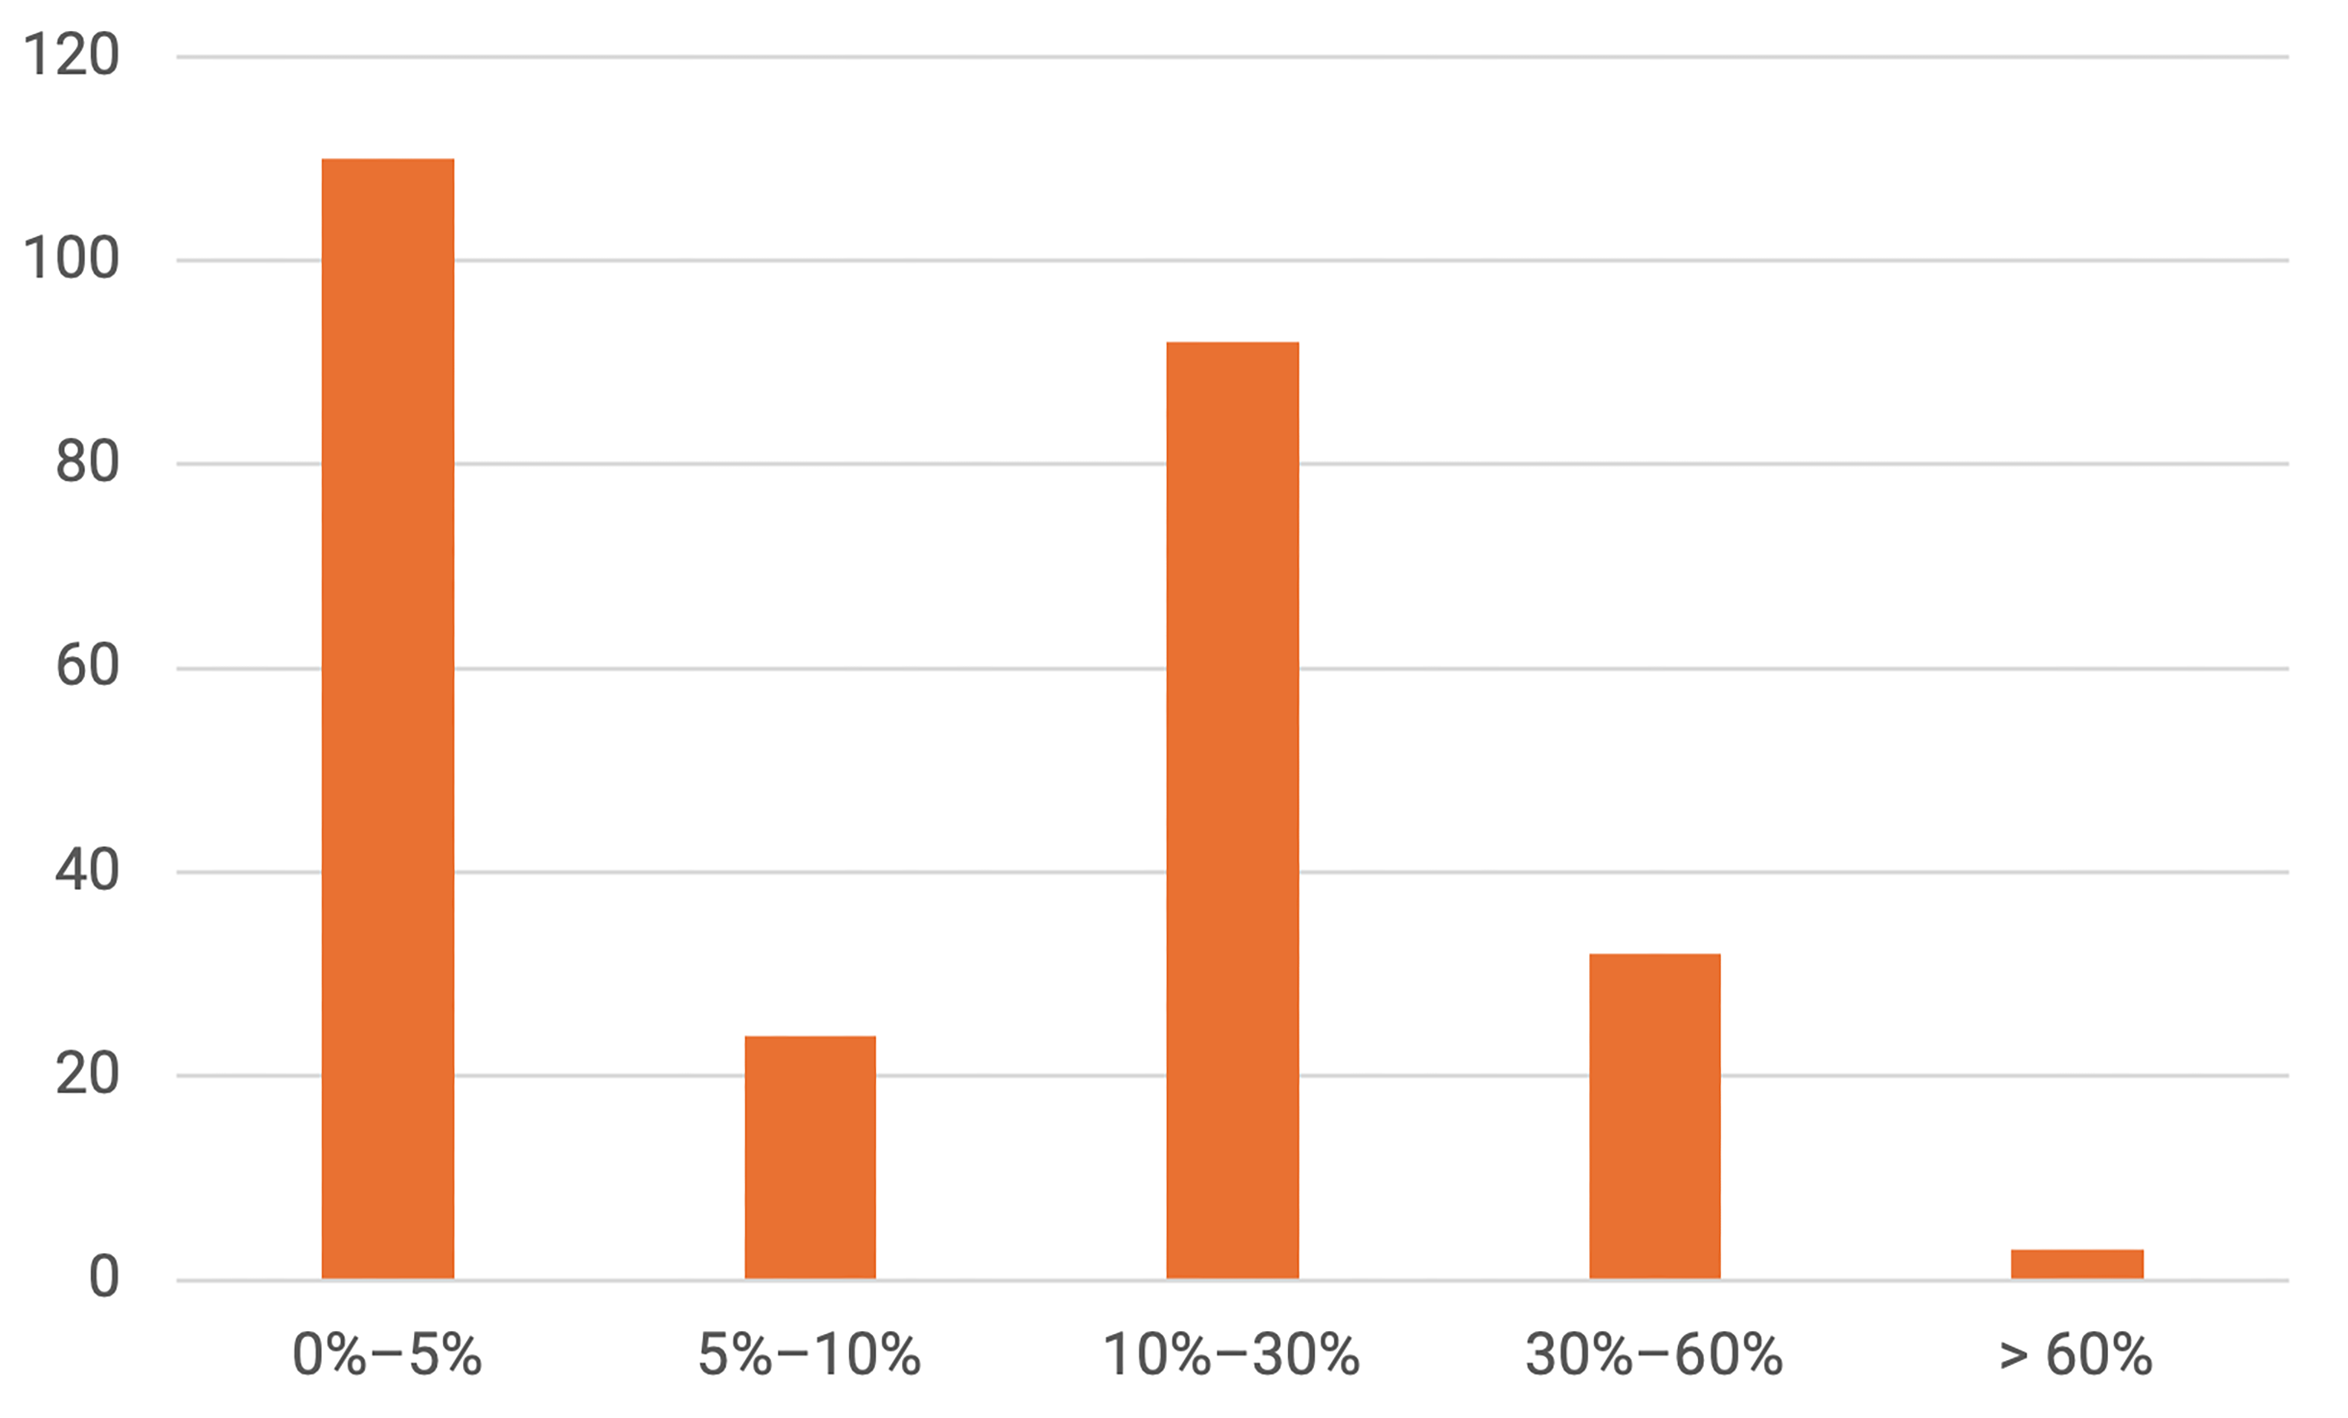
Figure 7 — Average Adjusted FCI Score of HISD Campuses by Occupancy Rate, 2011–12, After 2012 Bond Projects
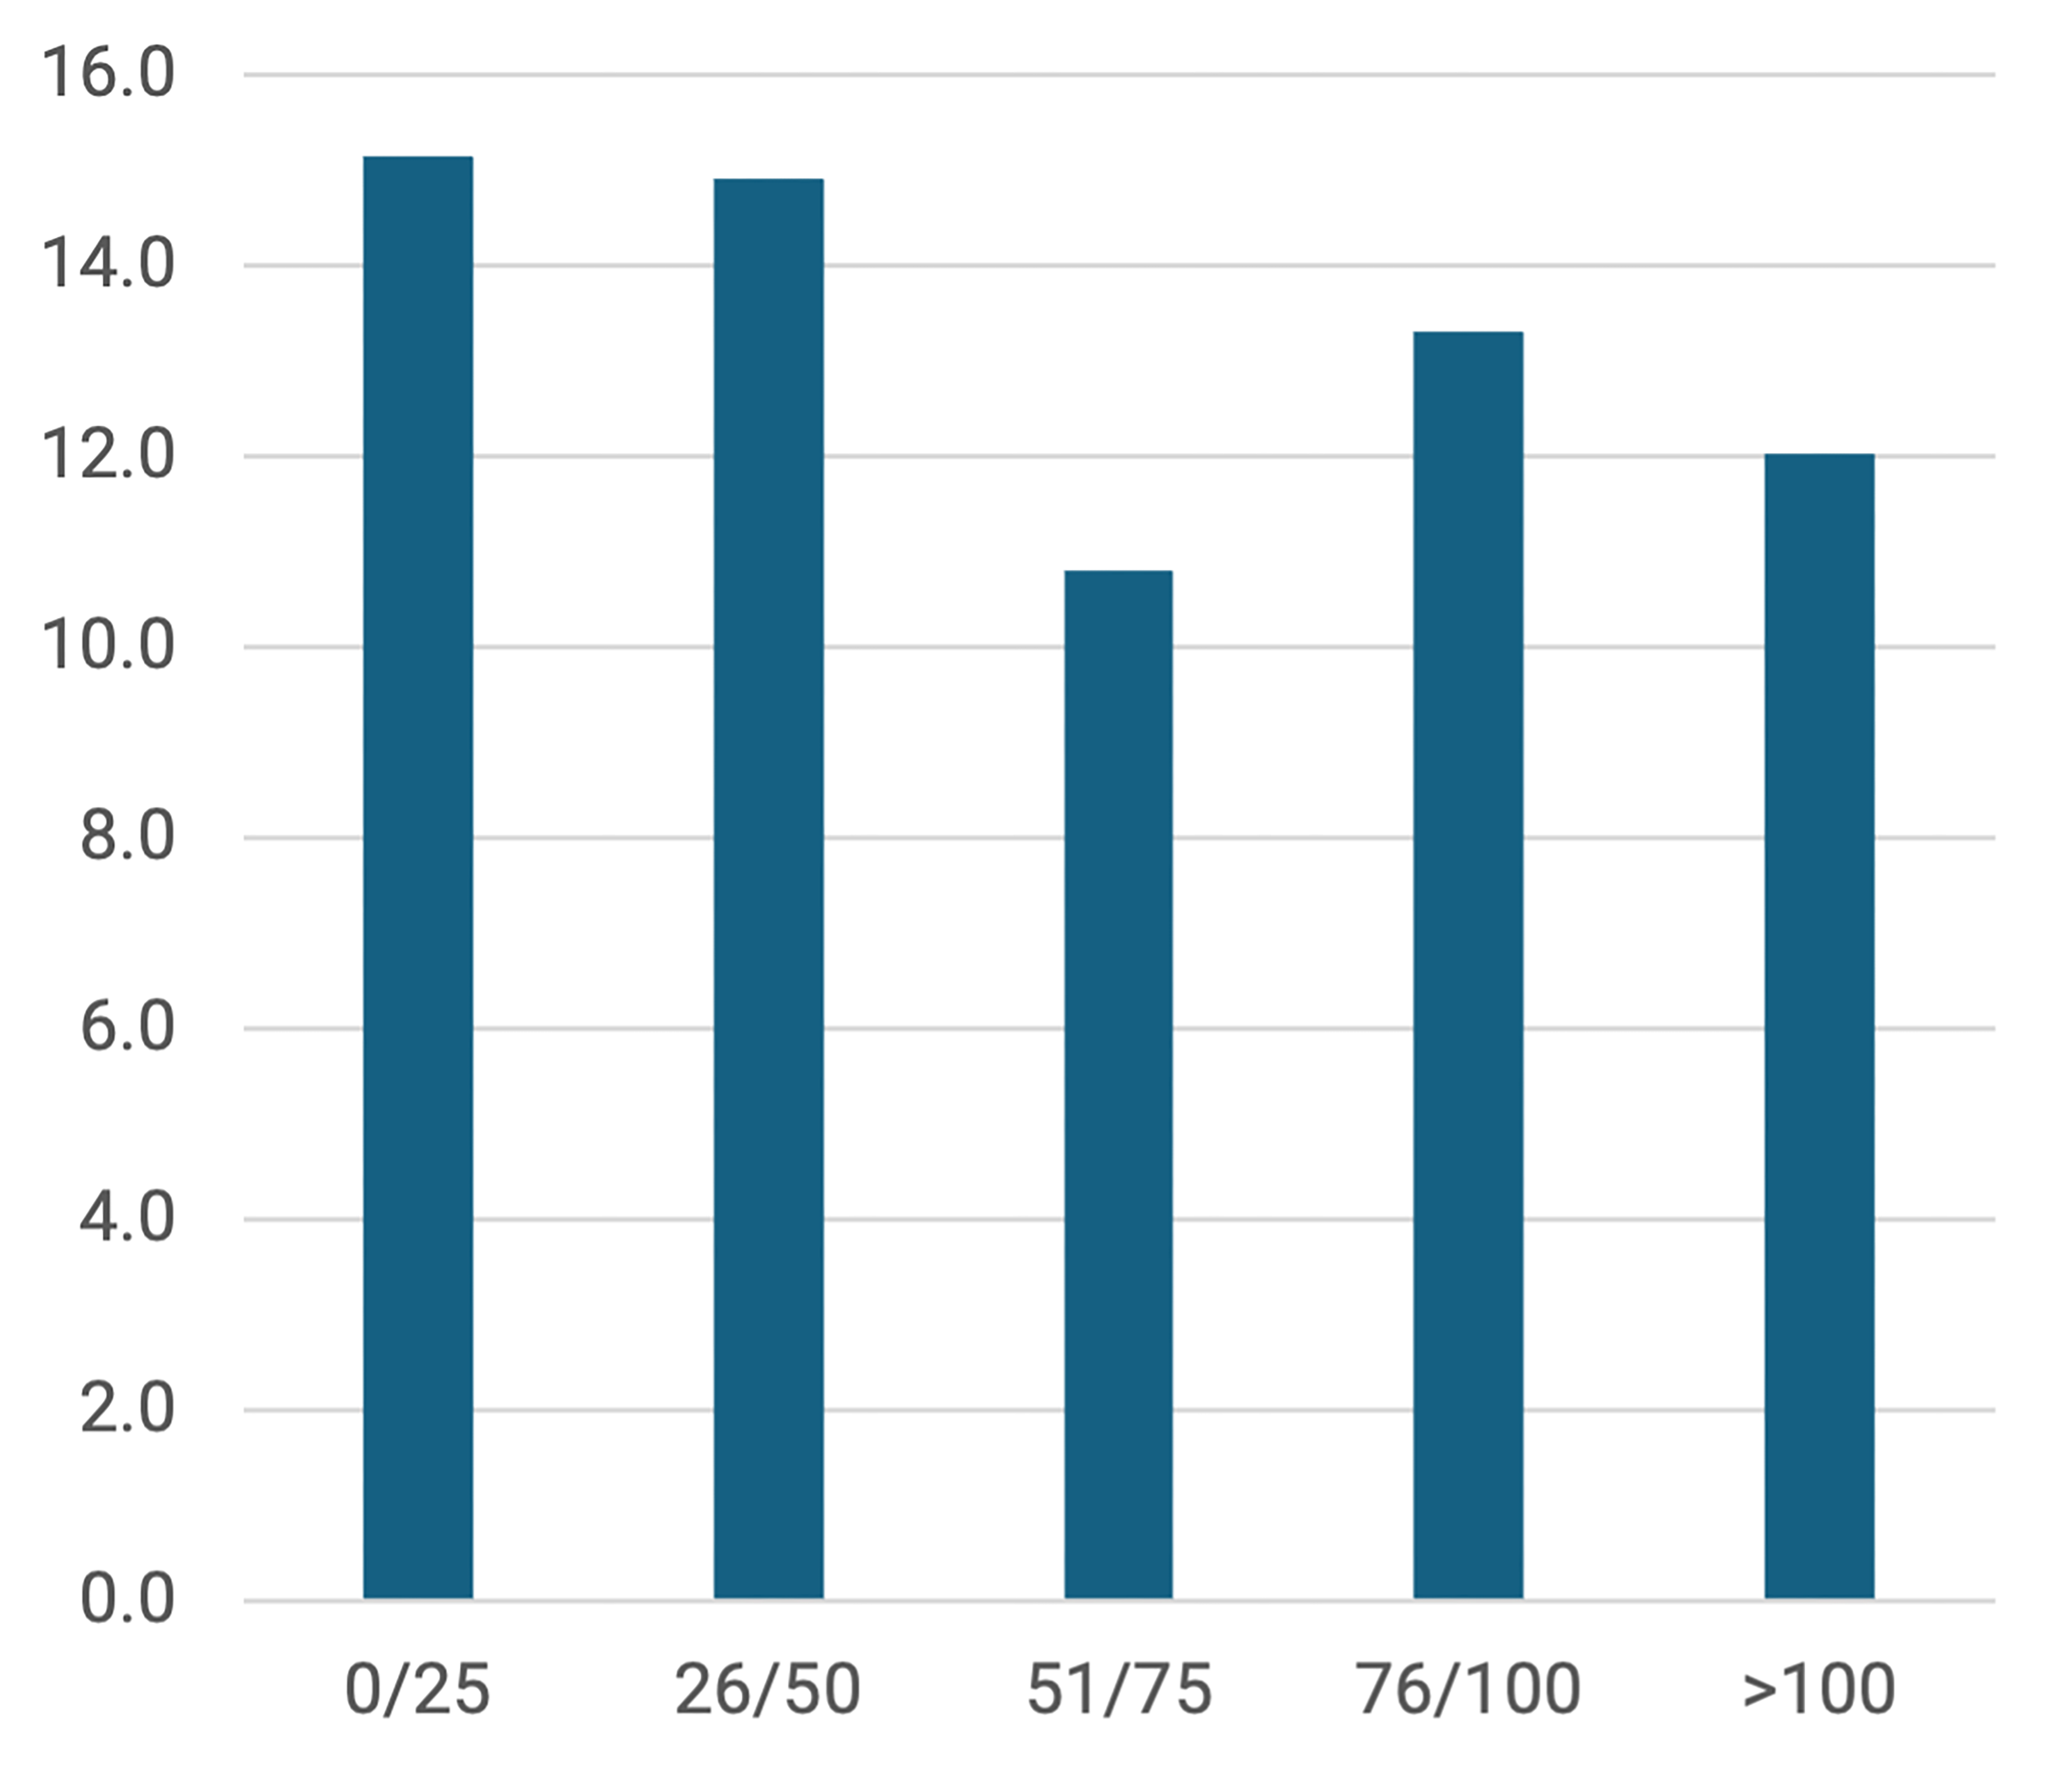
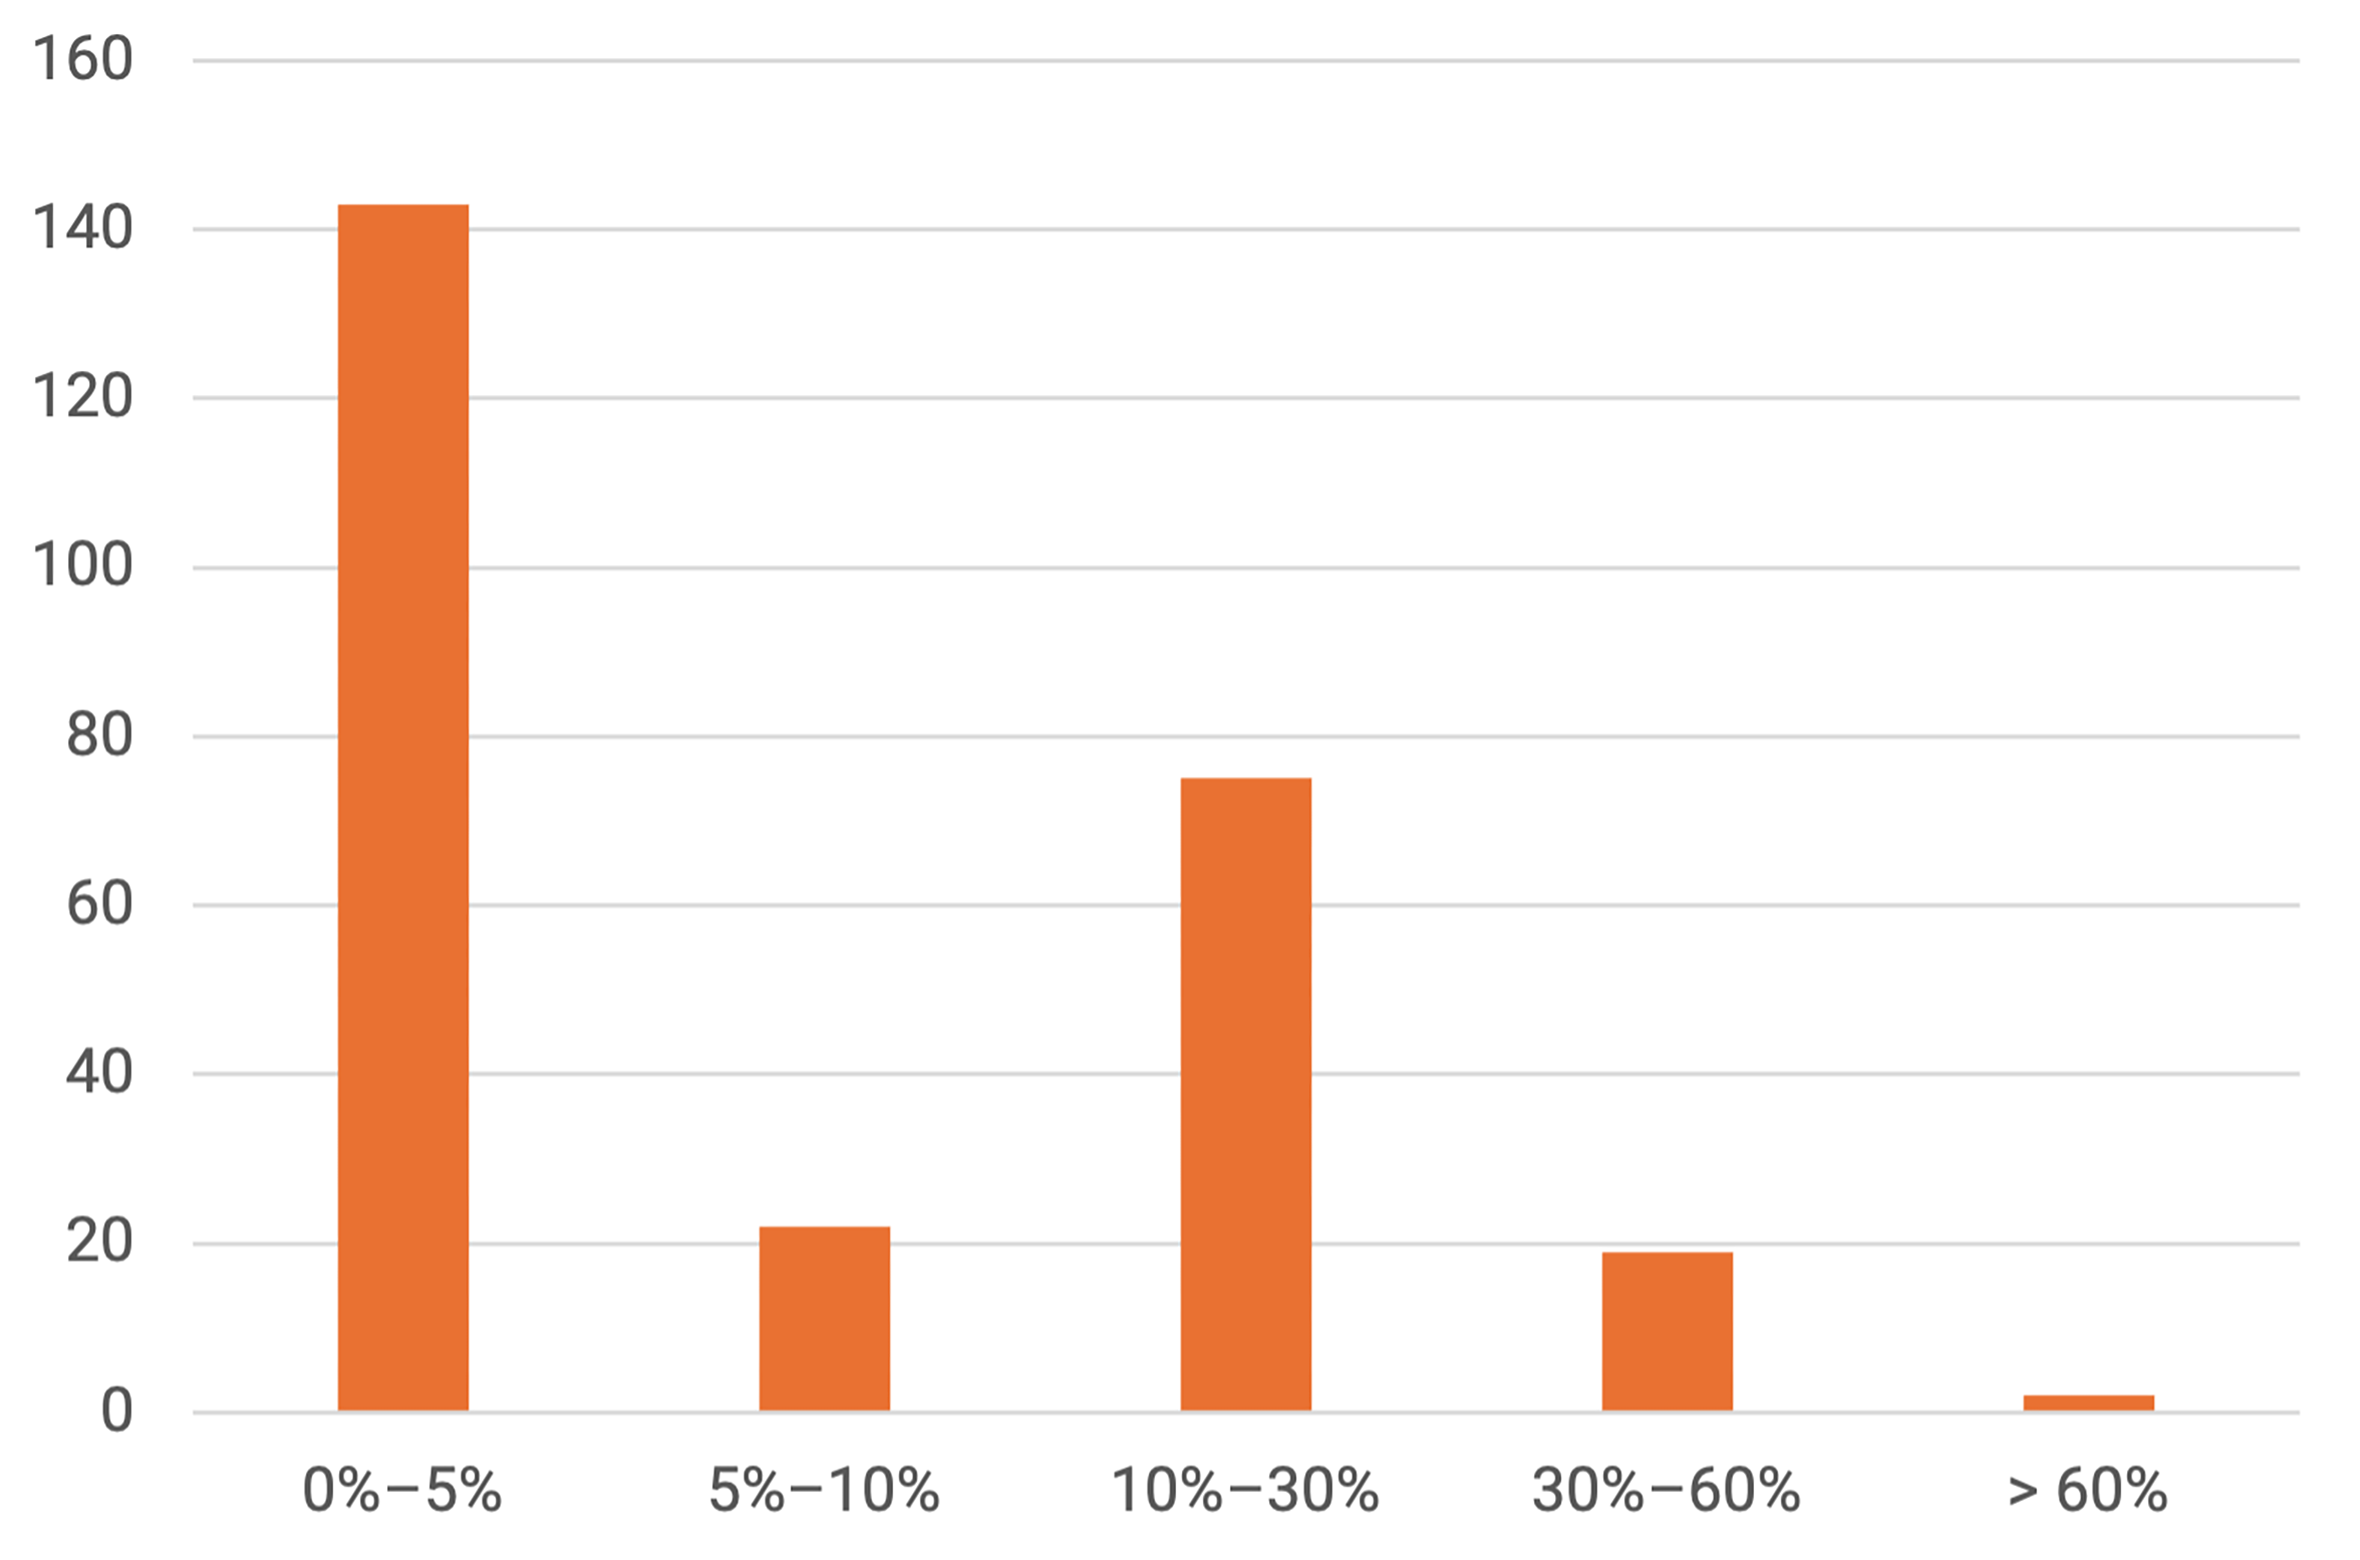
Figure 8 — Number of HISD Campuses by Adjusted FCI Score Range
Targeting Investment by Use and Condition
When evaluating both FCI and occupancy together, an overlap emerges between high-utilization campuses — particularly those in the 76%–100% and over 100% occupancy categories — and buildings in fair or deteriorating condition, defined as FCI scores over 10%. These schools face high student demand and may also experience greater physical wear. At the same time, the district has a growing number of underutilized campuses, including many with occupancy rates under 50% that also need expenditure for maintenance and repair. Considering both capacity utilization and facility conditions helps identify opportunities to repurpose or consolidate schools, allowing the district to better align student distribution with building maintenance and usage.
By integrating both data sets, HISD can more strategically identify where consolidation, renovation, or replacement may be warranted. The goal should be to maximize the use of facilities in better condition while prioritizing upgrades or new construction at high-demand sites that are in decline. This dual approach — grounded in utilization and facility conditions — can help HISD allocate its resources in a way that is fiscally responsible, equitable, and responsive to both current needs and future trends. When comparing FCI scores across occupancy rates, several key patterns emerge:
- Schools in the 0%–50% occupancy range have the highest average FCI scores, placing many in the fair or needs attention categories.
- Highly utilized campuses are often in the fair or needs attention category as well.
- Schools operating above 100% capacity tend to have lower average FCI scores, often in the good to fair range — possibly reflecting recent capital improvements or maintenance investments.
Districtwide, most campuses fall within the 0%–5% (excellent) and 10%–30% (fair) ranges, suggesting overall reasonable facility conditions at the time the data was collected and following the improvements made after 2012. However, 19 campuses exceed the 30% threshold, and three surpass 60%, signaling that replacement or significant renovations may be necessary.
Latest Assessment
In 2020, Rice & Gardner completed the most recent assessment of HSID campuses and presented the results to the HISD Capital Planning And Steering Committee. As part of the evaluation, they calculated FCI scores. Table 1 shows the aggregate results, categorizing facilities based on condition score, with lower scores indicating better condition:
- 0% to 30% — new or well maintained.
- 30% to 50% — significant systemic issues requiring repair or replacement.
- 50% to 65% — renovation or replacement recommended.
- 65% or higher — replacement likely needed soon.
Based on this assessment, approximately eight schools were identified as strong candidates for replacement, and 24 were found to need major renovation or replacement.
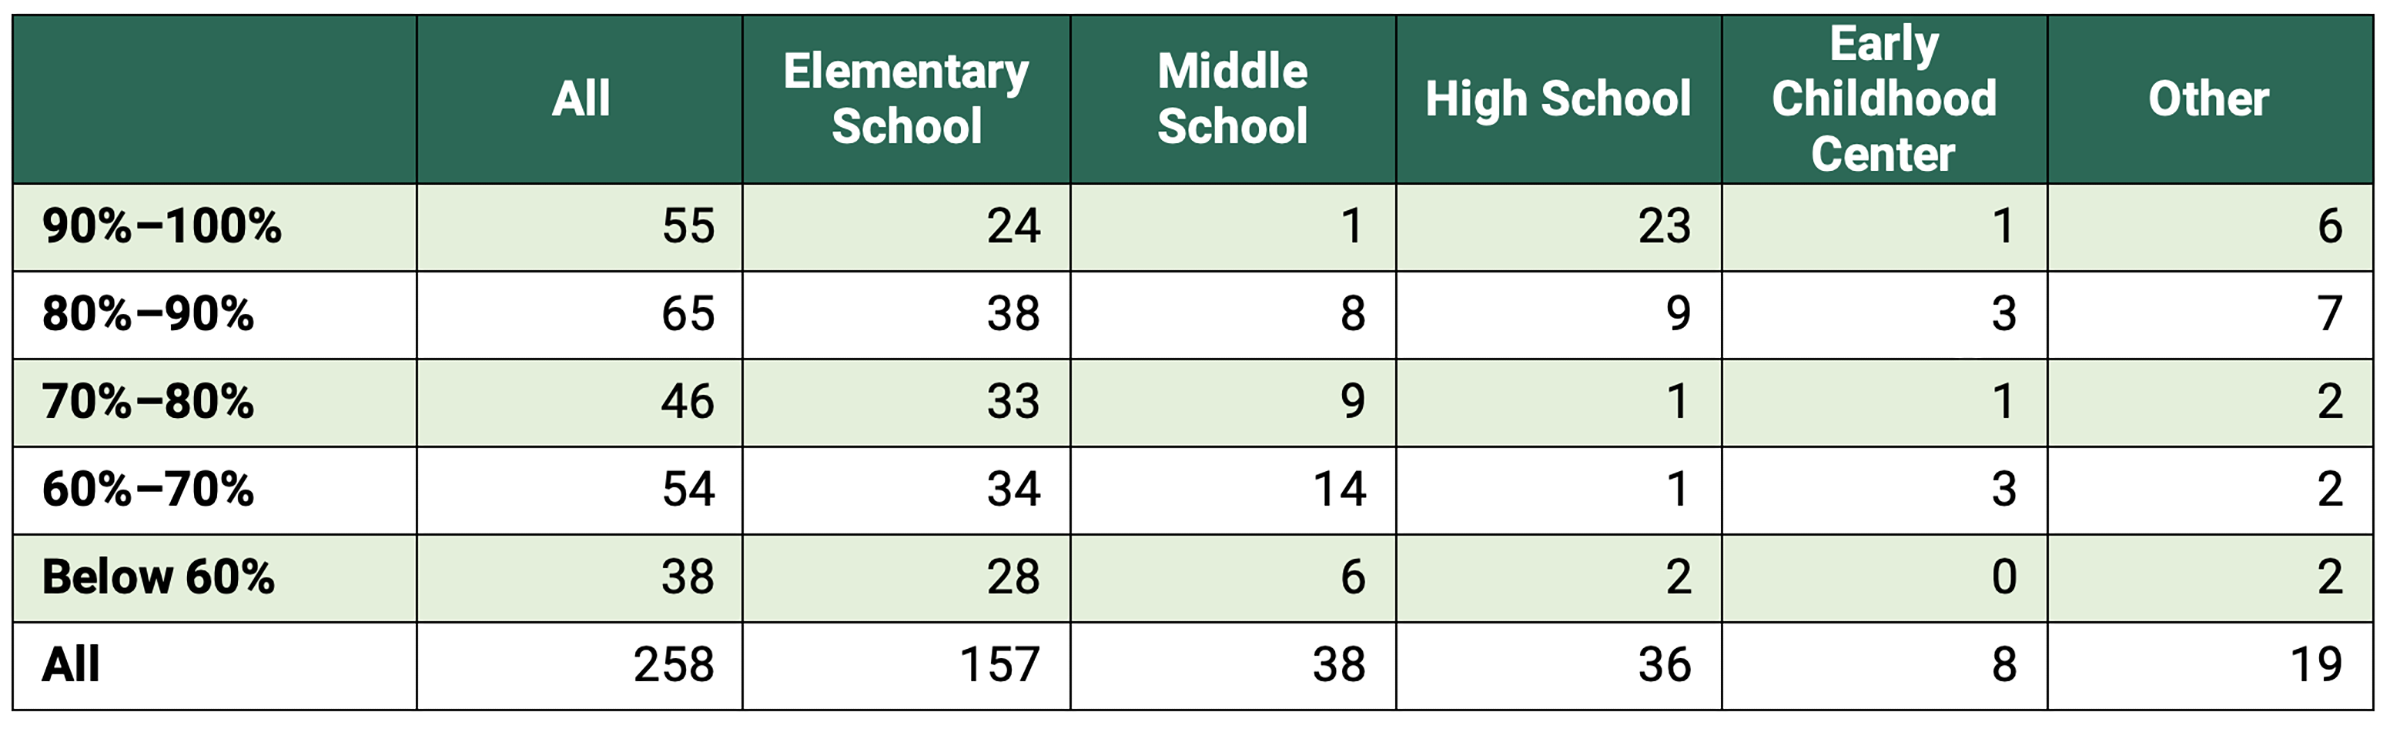
Rice & Gardner also calculated an Educational Adequacy Index (EAI), which measures how well a facility supports the instructional needs of students. A lower percentage score indicates that a facility is less aligned with educational program requirements and may lack critical instructional infrastructure or space. Table 2 shows the distribution of school facilities by EAI rating across different grade levels.
- Only 120 out of 258 schools — fewer than half — have an EAI score above 80%, suggesting that most facilities face at least some infrastructure concerns.
- A total of 38 schools fall below 60%, indicating poor conditions and potential need for replacement or significant renovation.
Elementary campuses make up a substantial share of both the highest- and lowest-rated facilities, highlighting wide disparities in building conditions across the district.
Table 1 — 2020 HISD Facility Condition Index by School Type
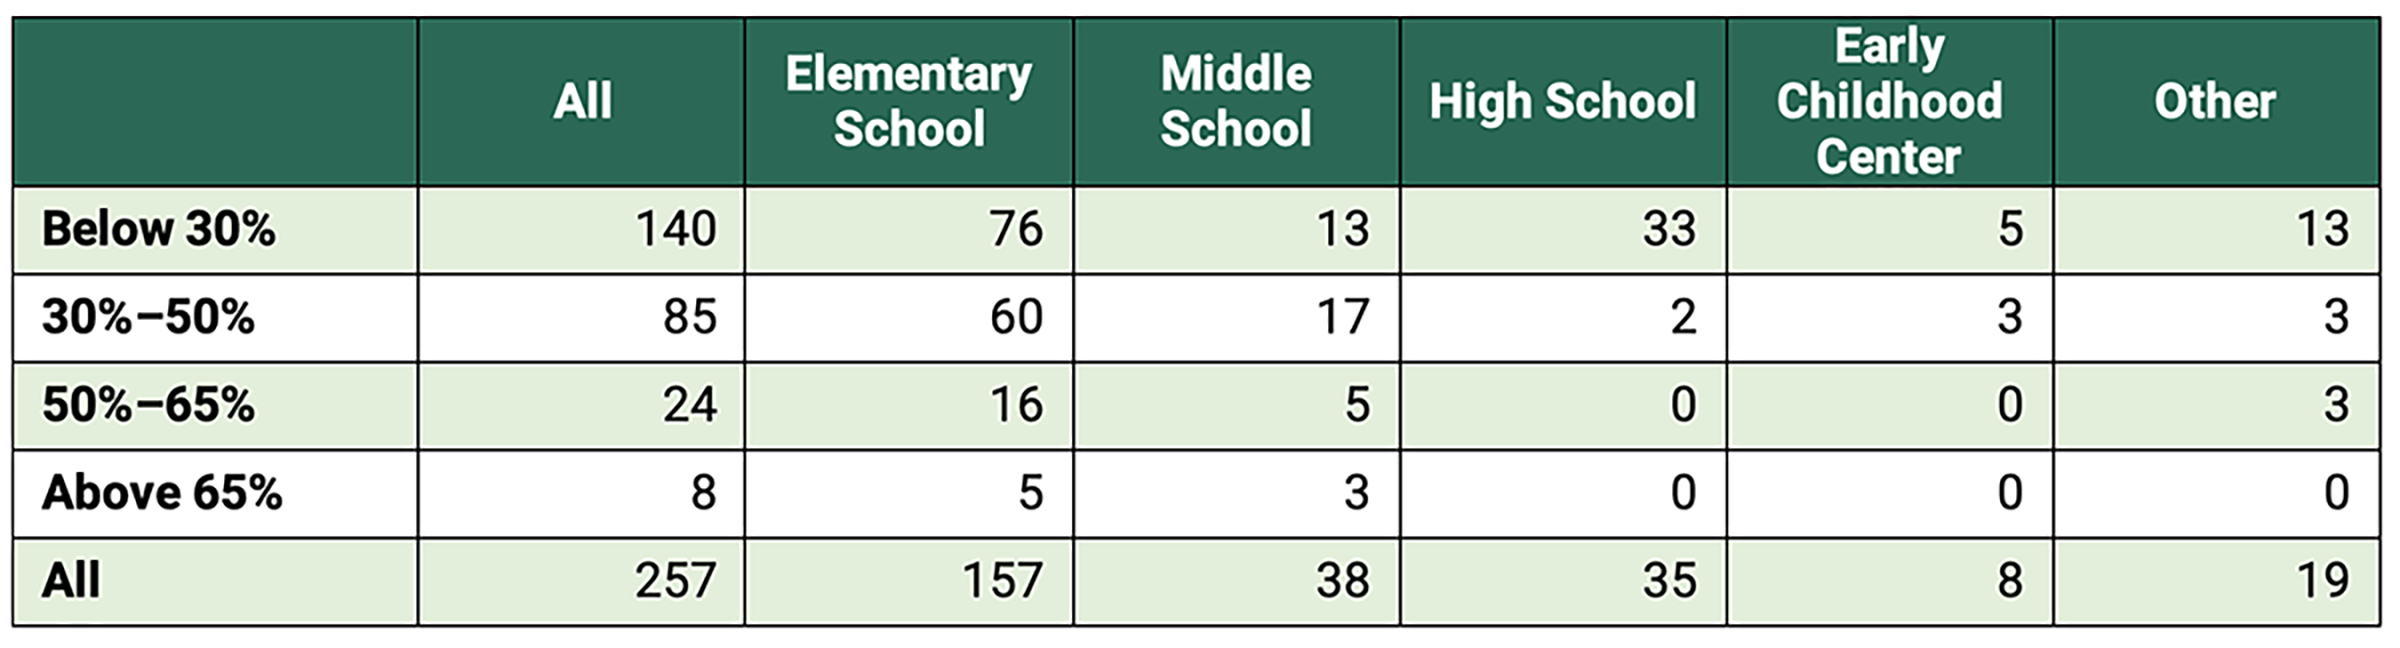
Table 2 — 2020 HISD Educational Adequacy Index by School Type
Aging Facilities
Since many U.S. schools were built during the post-World War II baby boom era, a considerable number are relatively old and likely in need of replacement or major renovation. According to the National Center for Education Statistics and Government Accountability Office, the median age of U.S. school buildings is 49 years, and over 50% of schools were built before 1970.
Conclusion
Houston ISD stands at a pivotal crossroads in addressing its facility and capacity challenges. The combination of aging infrastructure, uneven school utilization, and shifting demographics requires a forward-thinking strategy focused on efficiency and equity. To effectively address these challenges, the district could take the following actions:
- Consolidate underutilized campuses to reallocate resources more efficiently.
- Target investments in overcrowded schools, particularly those in poor condition, to address urgent needs.
- Base decisions on updated enrollment forecasts and facility assessments to ensure sustainability.
- Ensure that any actions taken do not disproportionately impact historically underserved communities.
By aligning resources with actual needs, HISD can create safe and effective learning environments for all students, now and in the years to come.
HISD is not alone in facing these challenges. Districts in Texas, such as Northside ISD, Judson ISD, and North East ISD in San Antonio, along with large urban systems like New York City and Milwaukee, are also grappling with similar issues. This national trend reinforces the importance of proactive, data-driven planning to help school systems effectively adapt to changing demographics and infrastructure needs.
This publication was produced on behalf of Rice University’s Baker Institute for Public Policy. Wherever feasible, the material was reviewed by external experts prior to its release. Any errors are the responsibility of the author(s) alone.
This material may be quoted or reproduced without prior permission, provided appropriate credit is given to the author(s) and Rice University’s Baker Institute for Public Policy. The views expressed herein are those of the individual author(s) and do not necessarily represent the views of Rice University’s Baker Institute for Public Policy.


