
The federal subsidies, even without the enhancements, have largely maintained ACA marketplace plans’ affordability for almost four million Texans.
Shifts in Texas ACA Marketplace Enrollment
Texas reached a record 4.17 million Affordable Care Act (ACA) marketplace plan selections during the 2026 open enrollment period (OEP). This marks a continuing multiyear growth in ACA marketplace plan enrollments in Texas since 2021. In 2026, reenrollment rather than new sign-ups was the primary driver of growth, signaling that the marketplace has developed into a core source of health insurance coverage for millions of Texans.
Despite sharp increases in premiums and the expiration of the enhanced premium tax credits, most Texans remained insulated from higher costs because premium tax credits continued to offset rising insurance prices for low- to moderate-income people. According to Centers for Medicare and Medicaid Services (CMS) data, rather than leaving the ACA marketplace due to price increases, Texas consumers responded by actively switching plans, most notably by transferring from Silver plans to less expensive Bronze plans. A smaller but sizable number of Texans switched from Silver plans to the more expensive Gold plans, now the most popular choice in the state. Overall, the shifts across plans reflect a growing sensitivity to affordability and perceived value of each plan’s coverage.
While this preliminary data demonstrates the program’s resilience and utility, the number of Texas enrollees who have fully paid their premiums and therefore effectuated their coverage will remain uncertain until more 2026 data is available.
For nationwide estimates, the Congressional Budget Office (CBO) projected a 20% decline in enrollment for the year. Published in April 2026, a report by Wakely estimates a decline of 17% to 26% in enrollment based in part on the number of enrollees who paid their premiums in early 2026.
ACA Marketplace Enrollment Trends in Texas
Texas ACA marketplace enrollment has grown more than five-fold since its launch, rising from 734,000 plan selections in OEP 2014 to approximately 4.17 million in OEP 2026. The historical pattern shows early growth, a plateau period (2018–20), and a significant expansion beginning in OEP 2021 (Figure 1).
These trends reflect Texans’ increasing use of ACA marketplace insurance options as well as policy shifts that have both enhanced and diminished enrollment growth. Most notably, in 2021, the federal government enhanced the premium tax credits to enable more people to receive larger subsidies, thus, expanding insurance access. That same year, Texas adopted legislation, SB 1296, that resulted in lower prices for Gold plans, which historically had been the most expensive.
As the enhanced premium tax credits expired at the end of 2025 and premium costs for all ACA marketplace plans rose due to higher medical costs, health policy experts were concerned that enrollment would decline. In fact, nationally, current preliminary reports find that 2026 ACA marketplace enrollments decreased approximately by over one million; however, Texas and several other states saw moderate growth.
Figure 1 — Texas ACA Marketplace Enrollment, OEP 2014–26
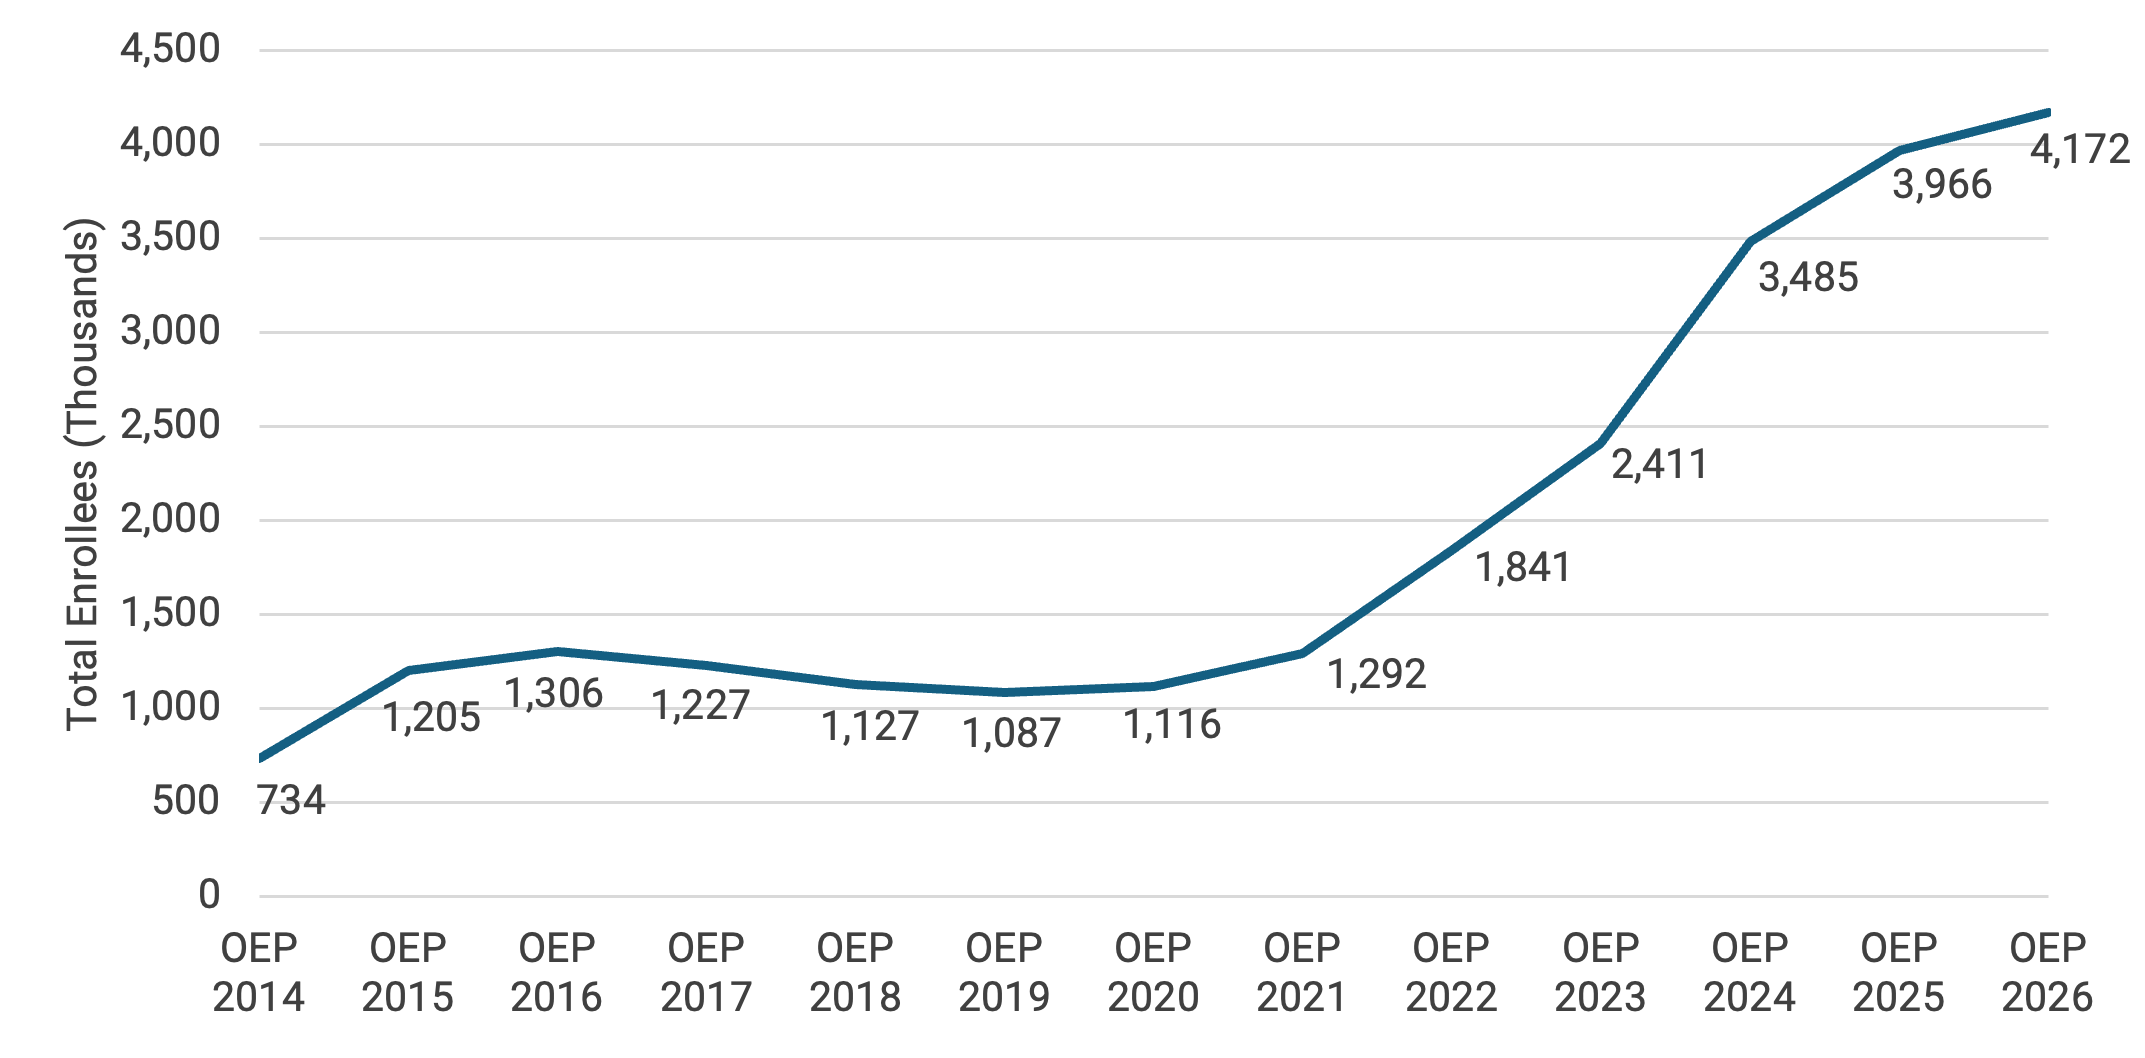
Note: OEP refers to open enrollment period.
Key Findings From 2026 ACA Marketplace Data
1. Enrollment Is Retention-Driven
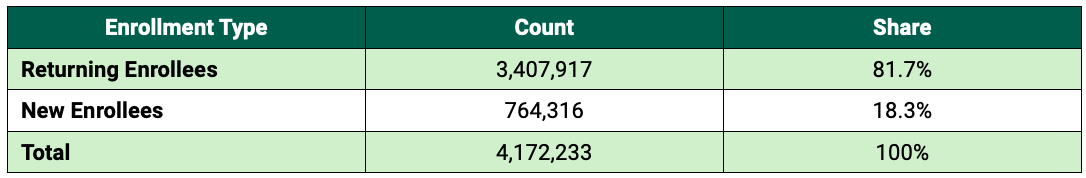
In OEP 2026, approximately 3.41 million Texans or 82% were returning ACA enrollees, while roughly 764,000 were new enrollees. This high retention rate of reenrollment indicates that Texans largely continue to maintain their ACA marketplace health insurance plans rather than selecting other insurance options or allowing their coverage to lapse.
Table 1 — Texas ACA Marketplace Enrollments by Type, OEP 2026
2. ACA Enrollees Span All Age Groups
Texas ACA enrollment spans all adult age groups, with the largest shares among adults ages 35–44 and 45–54. More than half of enrollees are between the ages of 35 and 64, reflecting groups that typically face higher premiums and are therefore more likely to require subsidies to offset costs.
Table 2 — Texas ACA Marketplace Enrollments by Age, OEP 2026
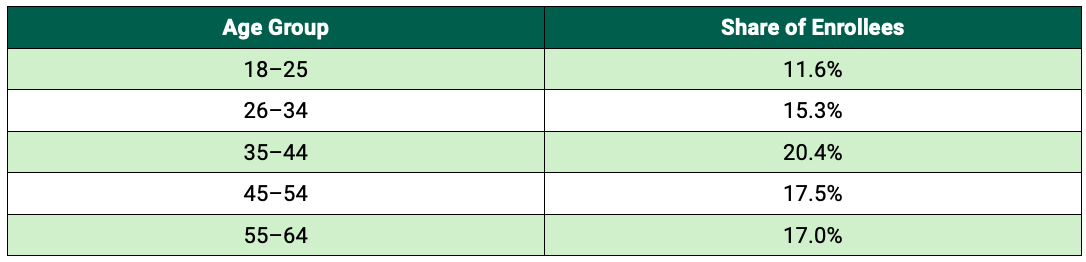
Note: These percentages are approximate calculations.
3. Majority of ACA Enrollees Are Low-Income
Enrollment in the Texas ACA marketplace is heavily concentrated among low- and moderate-income households. Nearly two-thirds of enrollees have incomes at or below 150% of the federal poverty level (FPL). With the expiration of the enhanced subsidies in 2025, only Texans with incomes between 100–400% of the FPL can now obtain subsidies, and the size of the subsidies available also decreased. As Table 3 shows, 96% of enrollees are within subsidy-receiving income brackets.
Table 3 — Texas ACA Marketplace Enrollments by Income Level, OEP 2026
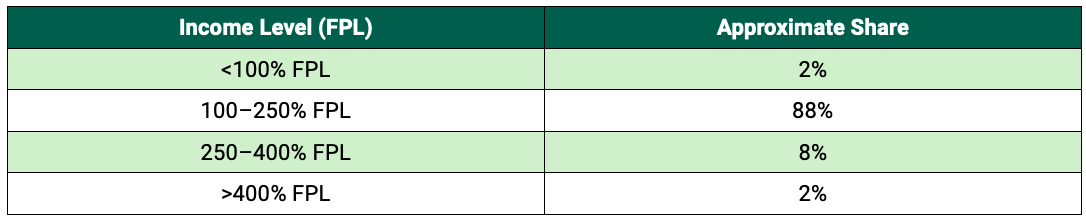
Note: FPL refers to federal poverty level.
4. Premiums Rose Sharply Following Subsidies Expiration
The expiration of the enhanced premium tax credits in 2025 caused premiums for all ACA marketplace plans to rise. The premium increases, which are also present in employer-sponsored health insurance plans, reflect significant rises in medical costs. As most enrollees were eligible for pre-2026 subsidy rates, their net premium cost remained low in OEP 2026.
Table 4 — Texas ACA Marketplace Subsidy Rates, OEP 2025–26
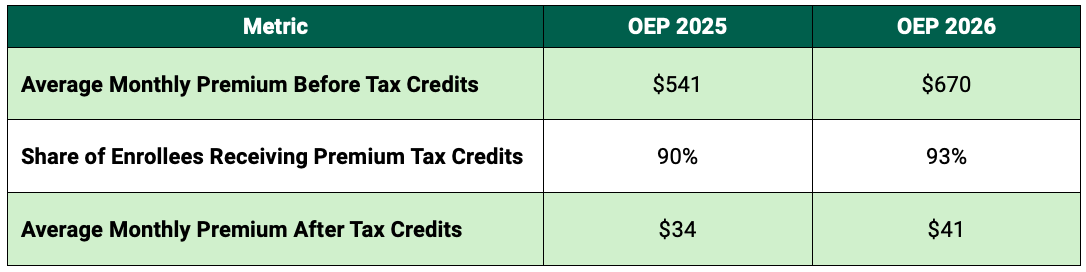
Note: These percentages and monetary amounts are approximate calculations.
5. Plan Selections Shifted Significantly Across Metal Tiers
The most notable change in Texas’ OEP 2026 was a substantial redistribution of enrollment across ACA plans’ metal tiers. ACA marketplace plans are categorized as Gold, Silver, or Bronze based on the percentage of total costs — premiums, deductible, and co-pays — that the plan covers. Gold plans cover 80% of the anticipated costs; Silver plans cover 70%; and Bronze plans cover 60%. Catastrophic plans, which have low monthly premiums in exchange for very high deductibles and fewer covered benefits, have specific eligibility criteria and comprise a small fraction of overall ACA enrollments.
People with incomes between 100–250% of the FPL — accounting for 88% of 2026 Texas enrollees — are eligible for additional cost sharing reductions, which would enable the cost coverage of 73–96% if they chose a Silver plan. As Figure 2 illustrates, the previously favored Silver plans now have the lowest number and percentage of enrollees, as Texas consumers largely switched to Bronze and Gold plans in OEP 2026.
Figure 2 — Texas ACA Marketplace Plan Selection by Metal Tier, OEP 2025–26
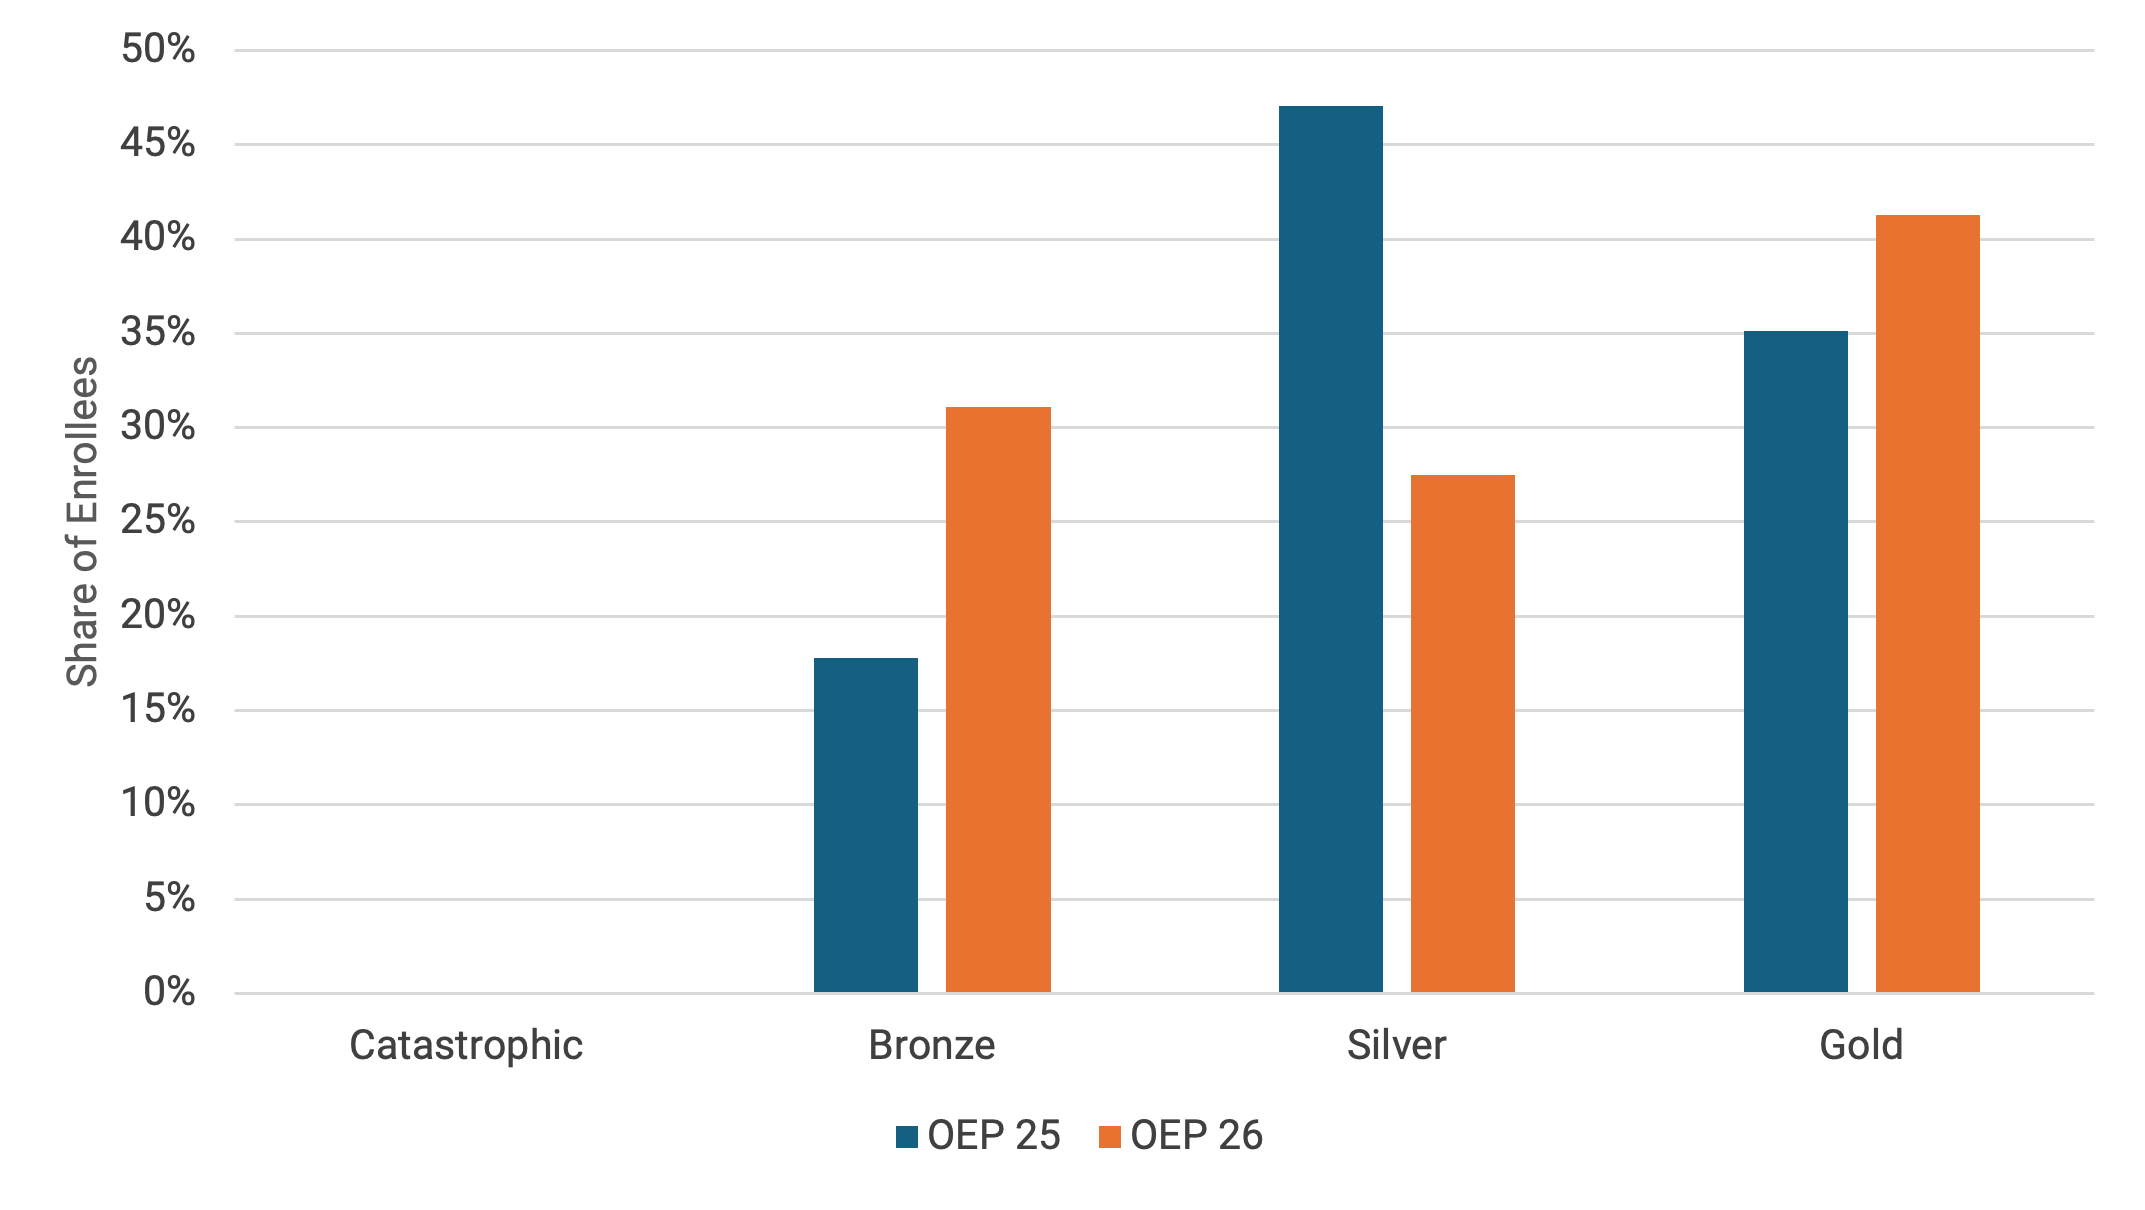
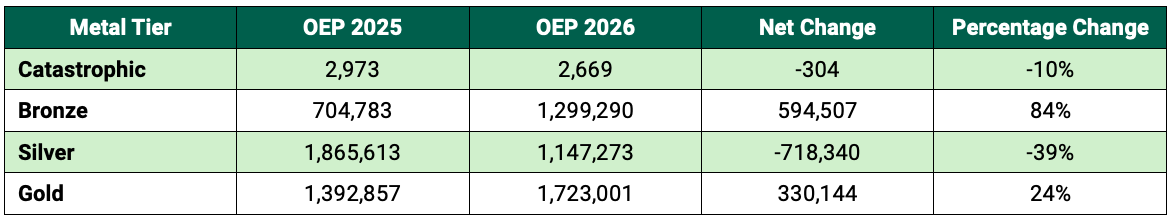
Table 5 — Net Change of Texas ACA Marketplace Plan Selection by Metal Tier, OEP 2025–26
Outcomes of Texas ACA Marketplace Trends
Texans’ Prioritization of Insurance Coverage
Overall, Texas’ continued growth in ACA marketplace enrollments demonstrates that residents prioritize maintaining health insurance coverage. Additionally, increased enrollment supports the state’s health care system, as insurance participation provides sources of payment to ensure service availability and care delivery. Based on this brief’s analysis, the authors expect CMS’ full data for 2026 will show that a sizable number of Texans effectuated — or paid for — their plans and are, in fact, insured.
Plan Selection Implications
In terms of Texans’ switching plan tiers, the substantial number of enrollees who selected Bronze and Gold plans over Silver plans may appear counterintuitive, as people chose both more and less expensive alternatives. At the same time, Bronze plan selections likely signal that paying one of the lowest possible premiums is an enrollee’s primary objective, even in the face of higher deductibles and co-pays.
As of OEP 2026, Bronze plans include the option to obtain a Health Savings Account (HSA), which may have contributed to shifts in plan selection. HSAs are tax-favorable savings accounts that enable account holders to use these funds to cover some medical expenses, such as co-pays, but not premiums. Typically, HSAs are offered by employers to accompany employer-sponsored high-deductible plans. Whether marketplace enrollees will establish their own HSAs remains uncertain; however, the new rule’s effect on enrollees’ plan selections will become clearer once more 2026 data is available.
For the 1.3 million Texans who selected Bronze plans for OEP 2026, their ability to afford the higher co-pays and deductibles remains a concern, as these enrollees could decide to forgo necessary care to avoid such costs or incur medical debt. For the 1.7 million Texans who chose Gold plans, they may consume more services than anticipated or needed, which could contribute to increased premiums in the future.
Expanding Health Insurance Affordability
Policy decisions at the state and federal levels influence whether Texans obtain health insurance and what kinds of health insurance plans they select. The federal subsidies, even without the enhancements, have largely maintained ACA marketplace plans’ affordability for almost four million Texans. More specifically, state-level review of ACA marketplace plans has made Gold plans more affordable for Texans.
If health insurance affordability for all is the primary goal, both state and federal policymakers should continue identifying pathways to expand the ACA marketplace’s ability to provide accessible and low-cost health plans for Texans.
This publication was produced by Rice University’s Baker Institute for Public Policy. Wherever feasible, the material was reviewed by outside experts prior to release. Any errors or omissions are solely the responsibility of the author(s).
This material may be quoted or reproduced without prior permission, provided appropriate credit is given to the author(s) and Rice University’s Baker Institute for Public Policy. The views expressed herein are those of the individual author(s) and do not necessarily represent the views of Rice University’s Baker Institute for Public Policy.


