


Author(s)

Introduction
CEO compensation at nonprofit hospitals across the United States has increased substantially in recent years. These pay packages, designed by boards and compensation committees, often include large bonus payments that can reach millions of dollars. Increases in CEO pay is frequently linked to growing system size and hospital profitability. Over the past 20 years, nonprofit hospital consolidation has accelerated, and higher prices have often followed hospital mergers. While the price effects of consolidation have important consequences for patient care, recent literature also finds that mergers leading to greater market concentration can suppress wage growth among healthcare workers.
In exchange for favorable tax treatment, nonprofit hospitals are obligated to serve the communities in which they operate. However, as small, mission-driven hospitals have been acquired in the recent wave of nonprofit hospital consolidation, governance and accountability are shifting to corporate entities and away from local community leaders. For other healthcare organizations, mergers and acquisitions have also had a significant effect on the composition of the labor force. After an acquisition, physician practices are likely to experience higher turnover of physicians and replace highly trained providers with lower cost alternatives like nurse practitioners.
As consolidation transforms governance across many nonprofit hospital systems, executive compensation models have increasingly tied incentives to financial performance. Consequently, direct care providers may face lagging wage growth as institutional priorities shift toward fiscal sustainability and market expansion. To understand how these market forces affect internal pay structures, this brief evaluates comparative wage trends between direct patient care (DPC) staff and hospital executive compensation.
Researching Pay
Previous research has shown that real wages, or wages adjusted for inflation, stagnated for hospital employees while executive pay packages rose. However, prior analysis did not distinguish between pay practices at the largest systems versus other healthcare organizations. The largest systems in this country span multiple states and control tens of thousands of beds, which may involve different compensation strategies. In addition, prior analysis did not test whether the amounts of profit earned and charity care provided are associated with the CEO-to-staff pay ratio.
Corporate governance that rewards executives for profits over patients may reduce clinicians’ autonomy and lead to burnout. The disconnect in wage growth between clinicians and healthcare executives has contributed to divisions within the workforce, leading to strikes and labor disputes. Since 2012, as CEO pay has increased, physicians and nurses have experienced increased stress and burnout, and many have left the profession. Labor costs account for approximately 60% of hospital operating expenses as of 2025, making staffing levels, wage growth, and the balance between clinical and nonclinical employees central to hospitals’ financial performance and the quality of patient care.
With executive compensation incentives primarily tied to system growth and profitability rather than quality of care, boards may prioritize strategies that suppress wage growth and lower operating costs. By breaking down disparities in CEO-to-employee salary differentials by time and system size, and identifying factors associated with wider salary disparities, this brief provides insights on nonprofit healthcare system behavior.
Data and Methods
This study uses CEO compensation data from IRS Form 990 tax filings complied by Candid. Form 990 reports compensation for the highest-paid executives at nonprofit health systems. Data on hospital labor costs come from the National Academy for State Health Policy (NASHP) Hospital Cost Tool (HCT), which provides detailed information on labor spending.
HCT Data Structure
Labor cost categories: The HCT categorizes patient costs into:
- Direct patient care.
- Administrative and management labor.
- Home office and affiliates labor.
- Overhead.
- Other non-DPC labor.
DPC inclusions: Hospital employees and contracted labor providing direct patient services.
DPC exclusions: Personnel not providing direct services (e.g., administration, maintenance) as well as patient care services billed through other methods, such as:
- Physician direct patient services.
- Anesthetists.
- Hospital-based rural health clinics.
- Other federally qualified health centers.
Compensation components: Labor costs include vacation, holiday sick leave, paid time off (PTO), severance pay, bonuses, and benefits.
FTE Standardization: Labor costs are converted into full-time equivalents (FTEs). This is calculated by dividing total labor costs for each category by total labor hours, then multiplying by 2080 hours — the standard for one employee working 40 hours per week for one year.
Comparing CEO and DPC Compensation
CEO-to-DPC labor wage ratios are constructed to capture differences in compensation between CEOs and the average DPC employee. These wage gaps may vary by hospital size, as the complexity of a CEO’s role likely increases with the size of the organization, while the responsibility of DPC employees may not vary in the same way.
As such, this brief analyzes changes in CEO-to-DPC wage ratios between 2015 and 2022 by hospital bed-size decile. From 2015 to 2022, many nonprofit hospitals consolidated. To examine changes in the composition of total labor costs resulting from consolidation, the analysis tracks the average share of each labor category in both years.
The analysis also uses linear regression models at the hospital/system-year level to identify factors associated with larger CEO-to-DPC wage ratios. These models estimate the relationship between wage ratios and hospital size, quality, charity care spending, teaching status, and hospital operating profit.
Study Results
Growth in the wage gap between CEOs and DPC employees was concentrated among the largest hospitals and health systems. Figure 1 presents the CEO-to-DPC wage ratio between 2015 and 2022 by decile of hospital bed size.
Figure 1 — CEO-to-DPC Wage Ratios by Decile of Hospital Bed Size
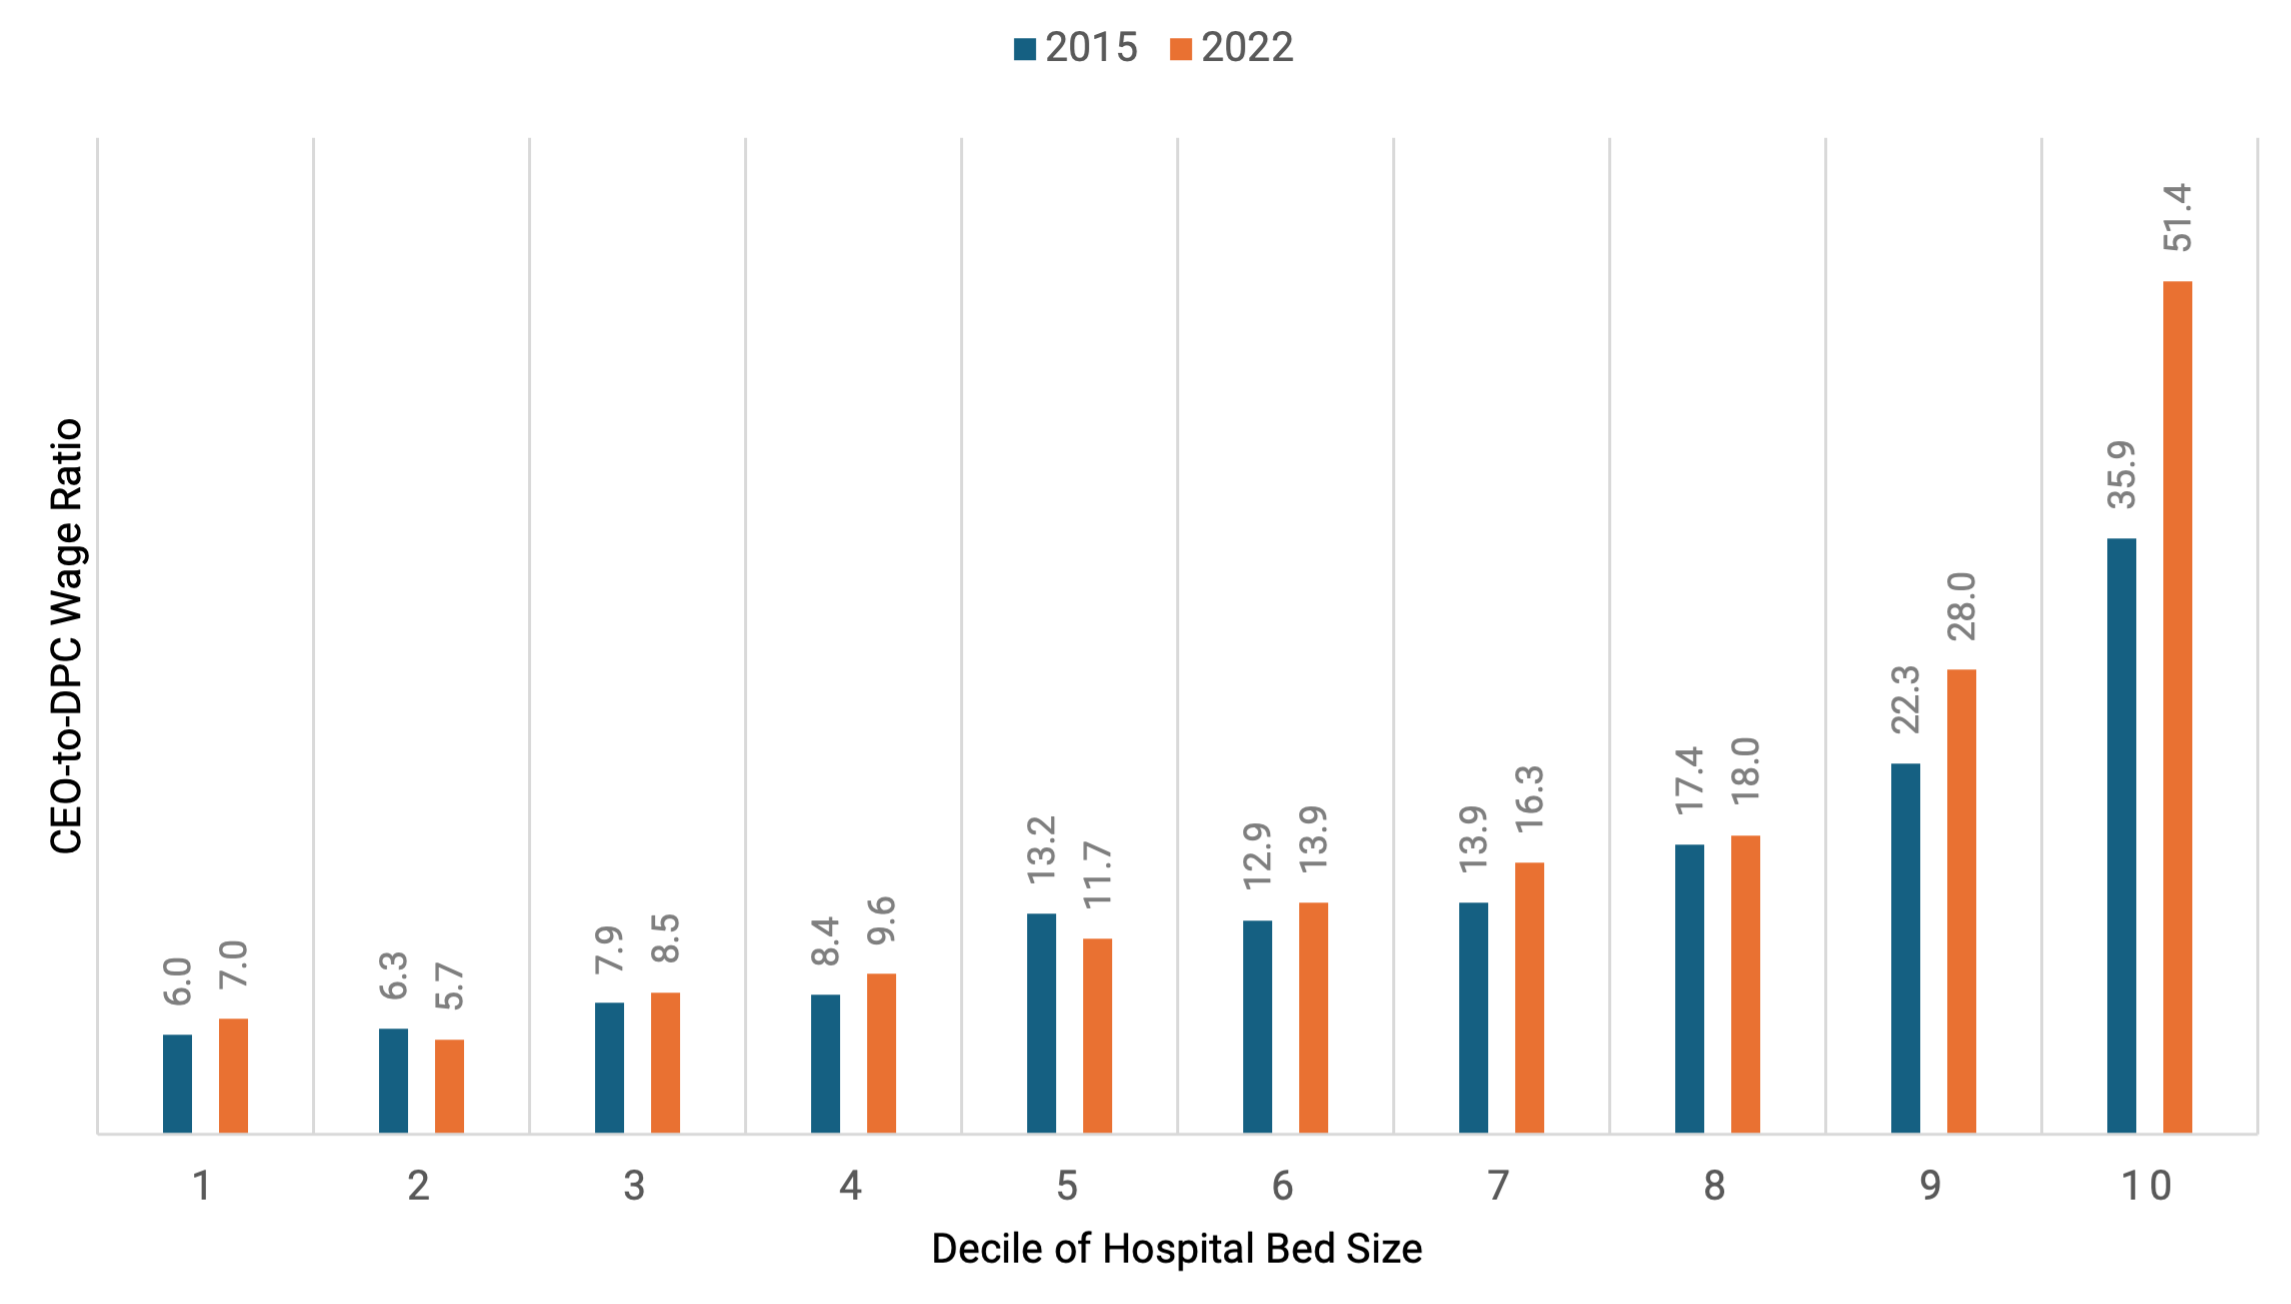
Note: Pay shown in dollars. The numbers on the x-axis represent deciles of hospital size from the smallest hospitals (1) to the largest (10).
Compensation trends for hospitals from 2015 to 2022 are shown in Table 1. For the largest 10% of hospitals (10th decile), executive compensation grew faster than direct patient care (DPC) wages, rapidly widening the pay gap:
- 2015: CEOs earned $3.9 million, compared with $108, 000 for DPC employees, resulting in a CEO-to-DPC wage ratio of 35.9 to 1.
- 2015–22 (seven-year growth rates): CEO wages increased by 62%, far outpacing the 11% growth in DPC wages.
- 2022: The highest-paid CEOs earned $6.31 million, while DPC employees at these hospitals earned $121,000, raising the CEO-to-DPC wage ratio to 51.4 to 1.
Table 1 — Real Changes in Healthcare Wages and Labor Costs From 2015–22
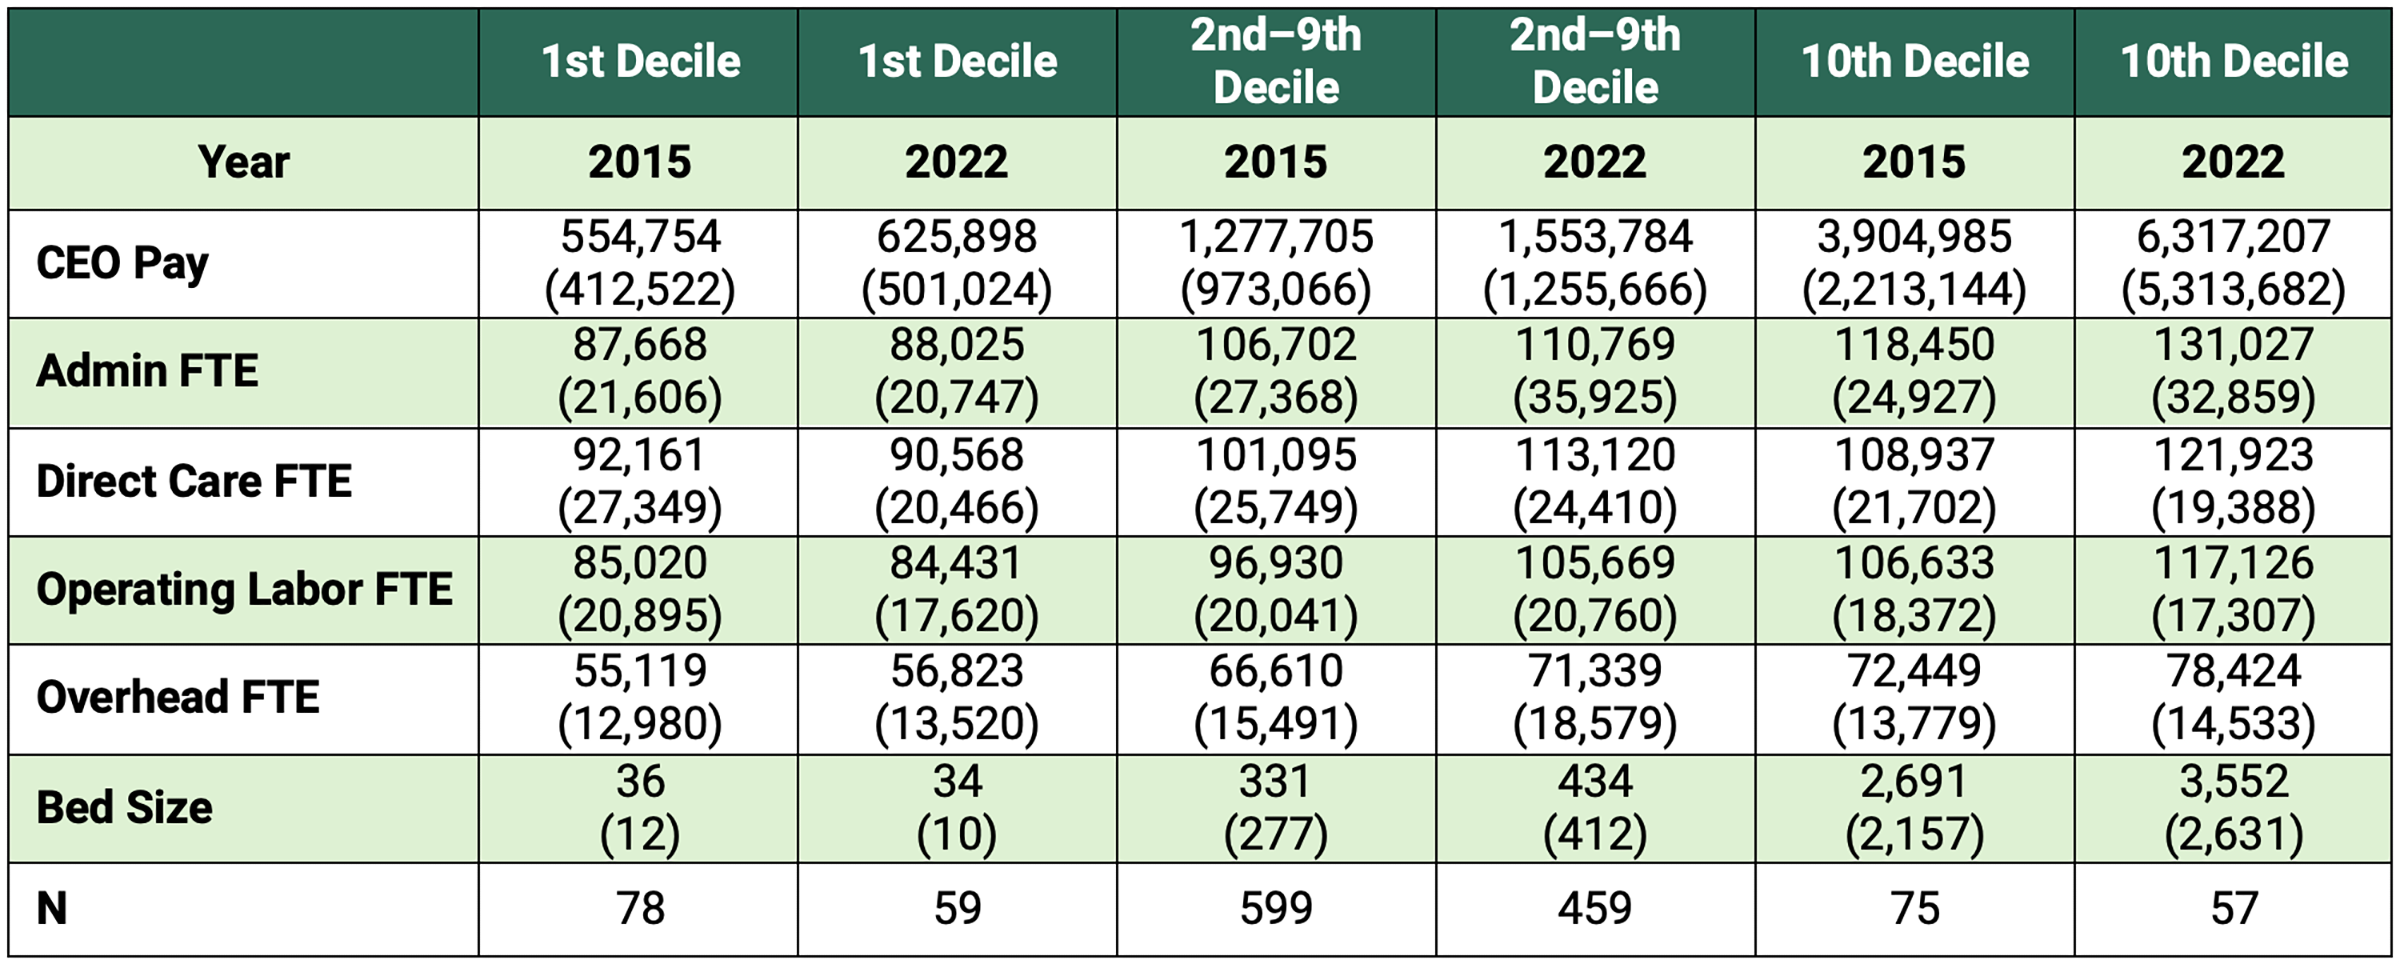
Note: “N” represents the total number of hospitals included in the analysis for each column.
Among hospitals in the second through ninth deciles of bed size (excluding the smallest and largest 10% of hospitals each year), CEO and DPC staff wage growth was less divergent. From 2015 to 2022, CEO compensation in this group increased by 21.6%, from $1.28 million to $1.55 million, compared with 12% for DPC staff, from $101,000 to $113,000.
At the smallest 10% of hospitals, inflation-adjusted DPC wages decreased between 2015 and 2022, falling from $92,200 to $90,600. This decline is likely at least partly attributable to consolidation, which may have altered the composition of hospitals in the lowest decile. CEO compensation in this group increased by 13%, rising from $554,000 to $625,000.
Other labor categories experienced similar growth to that of DPC employees across hospital size groups. Among hospitals in the largest decile, administrative and management wages increased 11%, and overhead labor costs rose by 8%. In contrast, at the smallest decile of bed size, administrative and management wages grew by just 0.3%, and overhead labor costs also increased slightly by 3.1% between 2015 and 2022.
Figure 2 tracks how hospital spending evolved between 2015 and 2022:
- Overall composition: Hospital labor cost distribution remained largely unchanged, with slight decreases in administrative and management costs and overhead labor shares.
- Total DPC growth: DPC labor costs grew slightly as a share of overall spending, increasing from 63.8% in 2015 to 64.9% in 2022.
- Shift toward contracted staff: Within DPC labor, reliance on contracted staff more than tripled, increasing from 2.5% of all labor costs in 2015 to 8.7% in 2022.
Figure 2 — Cost Composition by Fiscal Year
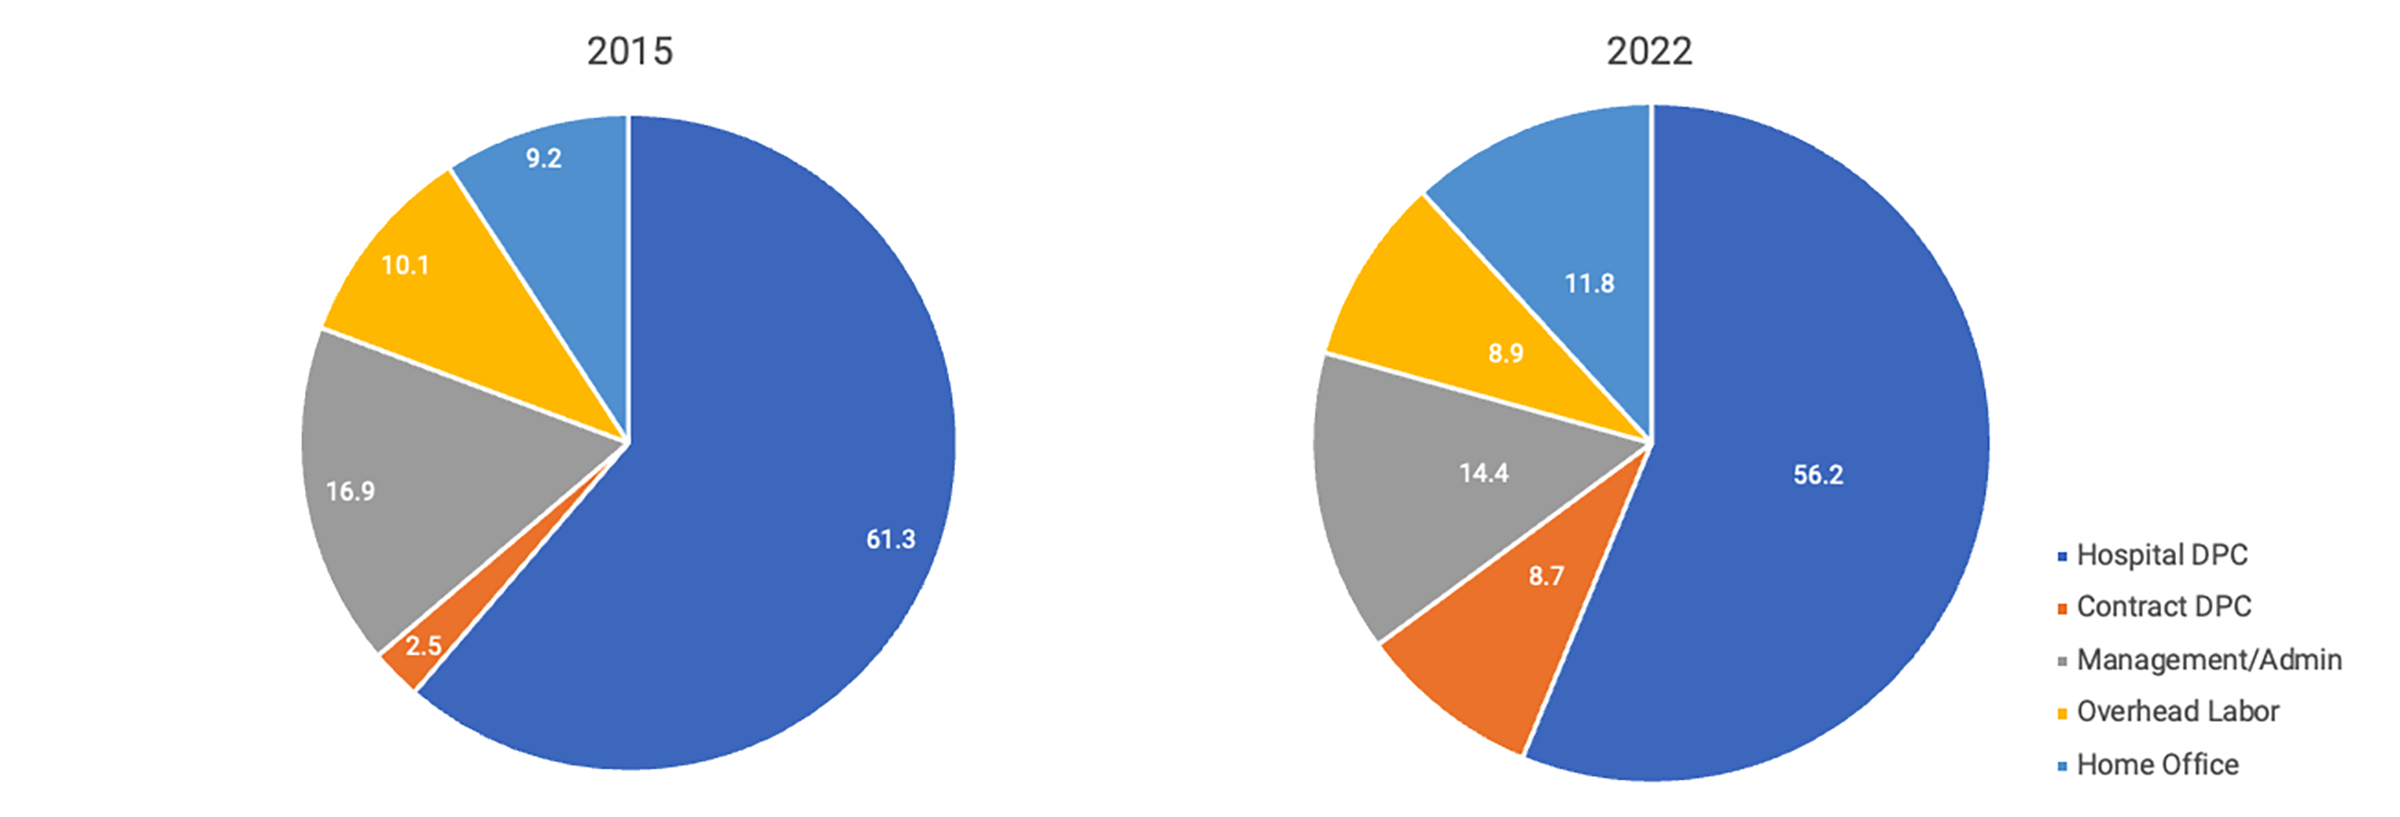
Note: Figure 2 presents the composition of labor costs in 2015 and 2022.
Table 2 presents the results of regression analysis estimating the relationship between the CEO-to-DPC wage ratio and hospital characteristics. Because the descriptive results suggest that wage ratios are higher among the largest organizations, these relationships are estimated separately for multi-hospital systems and independent hospitals.
Table 2 — Regression Estimates of CEO-to-DPC Wage Ratios
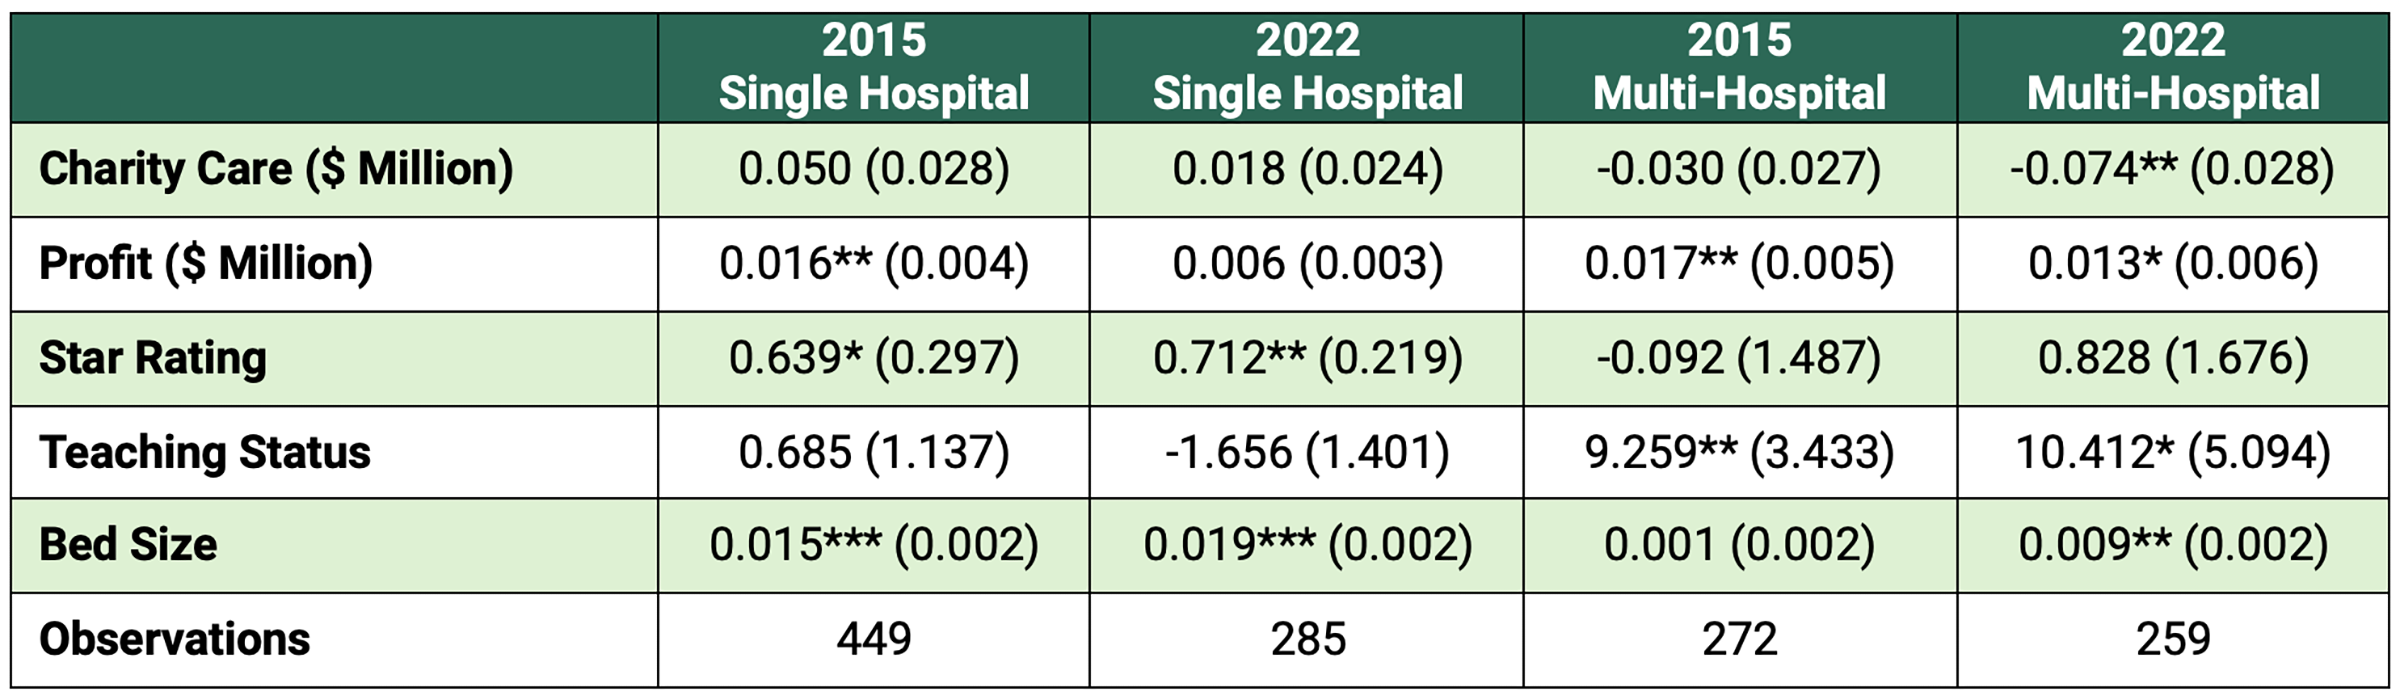
Key: “Profit” is defined as hospital operating profit and only includes costs directly attributable to patient care. “Star Rating” is weighted by hospital bed size for health systems and is an aggregate measure for quality that considers mortality and readmission statistics for many conditions among other quality related metrics. “Teaching Status” is measured differently for health systems and independent hospitals. For health systems, it represents the share of total beds located in teaching hospitals, ranging from 0 to 1 (e.g., 0.5 indicates that 50% of the system’s beds are in teaching hospitals). For independent hospitals, it is reported as a binary indicator (yes/no). Bedsize represents the total number of staffed beds for each hospital or health system.
Note: Sample differences from year to year are due to consolidation between 2015 and 2022. Standard errors are reported in parentheses. * p < 0.05, ** p < 0.01, *** p<0.001.
Charity Care
Independent hospitals: In 2015, independent hospitals that provided more charity care had slightly higher CEO-to-DPC wage ratios. Each additional $1 million in charity care spending was associated with a 0.05 unit increase in the wage ratio. By 2022, this relationship was no longer statistically significant.
Multi-hospital systems: Among multi-hospital systems, the association between CEO-to-DPC wage ratios and charity care was negative. In 2015, each additional $1 million increase in charity care spending was associated with a 0.3-unit reduction in the wage ratio, although this association was not statistically significant. In 2022, each additional $1 million in charity care spending was associated with a 0.74-unit decrease in the CEO-to-DPC wage ratio.
Profit
Financial performance was also positively correlated with the CEO-to-DPC wage ratio. In 2015, a $1 million increase in profit was associated with a 0.016 increase in the wage ratio. By 2022, this association had fallen to 0.006. While multi-hospital systems were larger on average in 2022 than in 2015, the increase in the CEO-to-DPC labor ratio cannot be explained entirely by the growth in hospital size, as the pay gap per bed was larger in 2022 (0.009) than in 2015 (0.001).
Among independent hospitals, a one-unit increase in hospital star rating was associated with a 0.639 increase in the CEO-to-DPC wage ratio in 2015 and 0.712 in 2022. The association was insignificant for multi-hospital systems.
Conclusion
This study describes the widening pay disparities between nonprofit hospital CEO compensation and DPC wages from 2015 to 2022, driven primarily by CEOs among the largest hospital systems. While DPC employees experienced wage growth similar to that of other labor categories, CEO compensation grew substantially faster, increasing the CEO-to-DPC wage ratio from 35.9 to 51.4 among hospitals in the top decile of bed size each year. In contrast, hospitals outside the top decile experienced more modest increases in CEO-to-DPC wage ratios.
The overall composition of labor costs changed very little from 2015 to 2022 despite significant consolidation over this period. Administrative wages and overhead costs remained stable, and aside from an increase in executive compensation, a greater reliance on contracted DPC labor was the only significant change. Financial performance and hospital size were consistently associated with higher CEO-to-DPC wage ratios. For multi-hospital systems, however, increased charity care provision was associated with smaller CEO-to-DPC wage ratios, consistent with previous research showing that systems have recently decreased the reward for providing charity care.
Nonprofit hospitals receive substantial tax exemptions in return for providing community benefits. As clinical staff face burnout and workforce shortages continue to affect physicians, nurses, and other healthcare employees, the widening compensation gap between executives and those providing direct patient care raises questions about compensation governance and whether it aligns with nonprofit hospitals’ charitable missions.
This publication was produced by Rice University’s Baker Institute for Public Policy. Wherever feasible, the material was reviewed by outside experts prior to release. Any errors or omissions are solely the responsibility of the author(s).
This material may be quoted or reproduced without prior permission, provided appropriate credit is given to the author(s) and Rice University’s Baker Institute for Public Policy. The views expressed herein are those of the individual author(s) and do not necessarily represent the views of Rice University’s Baker Institute for Public Policy.


