
Introduction
The North American Free Trade Agreement (NAFTA), which entered into force in 1994, was a treaty ahead of its time. It was a seminal accord not only in terms of trade liberalization but also because of its inclusion of side agreements, which were designed to mitigate the environmental impact of increased trade and to protect labor rights. A lesser-known, but equally advanced feature of the agreement — particularly in the North American context — was the creation of a work visa for professionals, known as the Trade NAFTA or TN visa.
The TN visa allows Canadian and Mexican citizens to participate in the U.S. labor market. This NAFTA provision, contained in Chapter 16 and titled “Temporary Entry for Business Persons,” remained in the U.S.-Mexico-Canada Agreement (USMCA) during the accord’s renegotiations of 2017 to 2020. Chapter 16’s provisions allow citizens of Mexico and Canada to apply for and, if they meet all requirements, obtain a TN visa to work temporarily in the U.S with a nonimmigrant work visa. As did NAFTA, the USMCA thoroughly outlines the type of eligible professionals from Mexico and Canada who can apply for a TN visa.
This brief outlines the list of eligible professions for TN visa applicants, analyzes the visa’ advantages and disadvanges, and examines various use trends of the visa related the top U.S. states and occupations for TN visa holders, both in general and by nationality. The data to examine these trends in the use of the TN visa was requested from the State Department through a Freedom of Information Act (FOIA). In the conclusion, this brief argues that the TN visa has demonstrated its value for the U.S. labor force as well as its unique flexibility given its indexation to U.S. economic performance, and, thus, should survive in the 2026 renegotiations of the USMCA.
TN Visa’s Qualifying Professions
To this day, over 30 years later, the USMCA — previously NAFTA — contains the same list of 63 eligible professions, which was later expanded to 64. Thus, the list has remained largely the same. The USMCA’s Chapter 16 under Appendix 2: “Professionals” provides a directory of eligible professions. As evident in the list of professions, the TN visa is reserved for higher-skilled fields, such as health care, engineering, research, teaching, and executive and administrative positions (Table 1).
Table 1 — Professional Activities That Qualify for a TN Visa Under the USMCA

TN Visa Characteristics
The TN visa is a nonimmigrant visa, which means that it does not provide a pathway to becoming a U.S. permanent resident and eventually a citizen. This visa grants legal status only to work for a specified period of time as a nonimmigrant. It is usually valid for three years, but can be extended to four years, as long as the visa holder maintains “nonimmigrant intent.” In order for Mexican or Canadian citizens to apply for this visa, they are required to have a job offer from a U.S. employer in one of the professions listed in the table above and with the level of education and experience required for that position.
Application Process
Importantly, the visa application processes are slightly different for the two nationalities. Canadian citizens with a job offer in hand can apply for and obtain the TN classification directly at a U.S. port of entry or at U.S. preclearance and preflight stations with the required documentation. Mexican citizens are required to apply for and acquire a TN visa at a U.S. consulate with the necessary documentation. In the latter case, even if the visa is approved, the U.S. port of entry official can deny admission into the country as they deem appropriate.
Disadvantages
As for additional features, the TN visa has a few significant disadvantages, but also several important advantages. One disadvantage is that the list of eligible professions has not been revised or updated since NAFTA entered into force in 1994, except for the addition of one profession. Given the 30 years that have passed, the list of qualifying professions no longer adequately reflects the evolution and needs of the U.S. labor market.
The current U.S. labor market significantly differs from its composition in the early 1990s, when, for example, the internet was not yet an integral part of the workplace. Given various technological advances and innovations, the nature of most professions has swiftly changed over the last three decades. Thus, the list of eligible professions would greatly benefit from updates and expansions to ensure that it aligns with the U.S. labor market’s needs. However, this is unlikely to happen under current U.S. trade policy.
Another disadvantage of the TN visa is its lack of accessibility for Canadian and Mexican citizens with lower- and mid-skilled jobs. In fact, the U.S. economy produces job opportunities of this kind — including workers in construction, services, agriculture, and food processing, among others — in abundance when the economy is strong. Other visas for temporary work, such as the H-2A and H-2B, apply to jobs of this kind, yet these visas are considerably less flexible than the TN visa.
Although H-2A and H-2B visas are readily available, they are technically difficult to obtain and, thus, tend to not satisfactorily mitigate labor shortages across these sectors. Likely, as a result, most undocumented labor in the U.S. is concentrated in these industries.
Advantages
The TN visa, however, has been significantly valuable to both employers and workers for several reasons:
- It can be renewed without limit, provided the job offer remains valid.
- There are no restrictions on the number of visas that can be issued by profession or nationality.
- An individual only requires a job offer that qualifies under the listed professional categories and their accepted definitions to obtain this visa.
- The denial rates are fairly low, although recent changes in TN visa processing at U.S. consulates in Mexico has led to an increase in denials, especially in fields such as agriculture, engineering, and food safety. As reports show, the second Trump administration is further reviewing the qualifications for this visa to reduce the number of visas issued.
- It allows the visa holder’s spouse and children under 21 to enter the U.S. on a TD visa. However, they cannot work in the U.S. under this category.
- It is very closely indexed to the U.S.’ economic performance, meaning that the number of job offers leading to TN visas follows fluctuations in the economy.
In addition to these advantages, the TN visa is also easily obtainable, as long as the requirements are met. It is also less costly than other temporary work visas, although the process would become more expensive if an immigration lawyer is hired.
Given the TN visa’s significant advantages of affordability, accessibility, and economic adaptability, expanding its use in the future would likely benefit the U.S. labor market, especially as the U.S. population declines, its workforce shrinks, and its labor market continues to experience shortages.
The political context for the TN visa, however, has shifted under the second Trump administration, potentially putting this visa category at risk. Many observers did not expect Chapter 16 to be maintained in the transition from NAFTA to the USMCA and are uncertain as to whether Chapter 16 will be preserved after the USMCA’s upcoming review. The USMCA-mandated review and revision process scheduled for mid-2026 could lead to a modification, if not the complete elimination of the TN visa.
TN Visa Category in Numbers
The following analysis is based on data obtained via a Freedom of Information Act (FOIA) from the Department of Homeland Security (DHS) and the Office of Performance and Quality from the U.S. Citizenship and Immigration Services (USCIS).
The data on the TN visa collected by the State Department are based on the Form I-129 for TN professionals — a form that visa petitioners fill upon requesting a TN visa. A U.S. employer is required to complete this form to request nonimmigrant work in the U.S. under most visa categories. However, for TN visa holders, petitioners from Mexico and Canada use this form only to request an extension of stay in the U.S. or change of status to this visa.
Consequently, the data do not include all TN visa holders who apply for this visa or information on their status outside the U.S. Nevertheless, these data, though incomplete, provide important information about the TN visa’s use trends, as they may represent a key sample of the entire TN visa holder population. The following analysis focuses on TN visa holders who used Form I-129 and whose visas were approved in their respective calendar year.
After the 9/11 attacks in 2001, U.S. national security significantly increased. This led to stricter entry and stay procedures for immigrants seeking temporary work in the country, which also affected the TN visa (Figure 1).
Another foremost visa for high-skilled workers, the H-1B visa, saw its cap for the number of new holders reduced from 195,000 to 65,000 by 2004, after the threshold was temporarily raised in fiscal years 2001, 2002, and 2003. Like the TN visa, the H-1B visa holders work in specialized fields. In many ways, the H1-B visa can be applied to several more professional categories than the TN visa, but it has restrictions on the number of new visa holders in a given year.
Moreover, unlike the TN visa, the H1-B visa can be converted into a permanent resident card, also known as a green card. As it is considered a dual intent visa and not a nonimmigrant visa, the H1-B visa holder is not required to implicitly declare their intent to become a permanent resident or their lack of intent to do so.
The use of TN visas spiked in 2006, then declined and recovered after the global financial crisis of 2007–09, as firms began to need more workers. The same pattern was observed during and after the COVID-19 pandemic, mainly in key sectors such as health care. The increase in TN visas after 2006 could be partly due to TN visa workers serving as substitutes for H-1B visa workers, given this visa’s reduced cap.
Another potential reason for this increase was the recovery of the U.S. economy from the 2001 recession and its subsequent expansion. The U.S. economy experienced a strong growth of around 3.1% during 2005 and 2006, with low unemployment rates of approximately 4.8%. With economic growth and a low unemployment rate, the U.S. economy was healthy and expanding during those years, though with some challenges in specific sectors facing labor shortages, such as health care. Immigrant workers with TN visas alleviated these shortages to some extent. Increases and decreases in the number of TN visa holders can be explained by one of the key advantages mentioned above: The visa is fairly well indexed to the U.S. economy’s performance.
Regarding TN visa denial rates, these figures have been quite low in recent years, according to the data from a FOIA. For example, from 2015 to 2023, the data show that the denial rate was around 8.7% for Canadian citizens and slightly higher for Mexican citizens at 9.4%. However, from 2019 to 2023, this rate decreased for Mexicans, reaching the same level as for Canadians at 8.5%. Future data, reflecting the reported restrictions on this visa during the second Trump administration, will likely begin appearing in records for 2025.
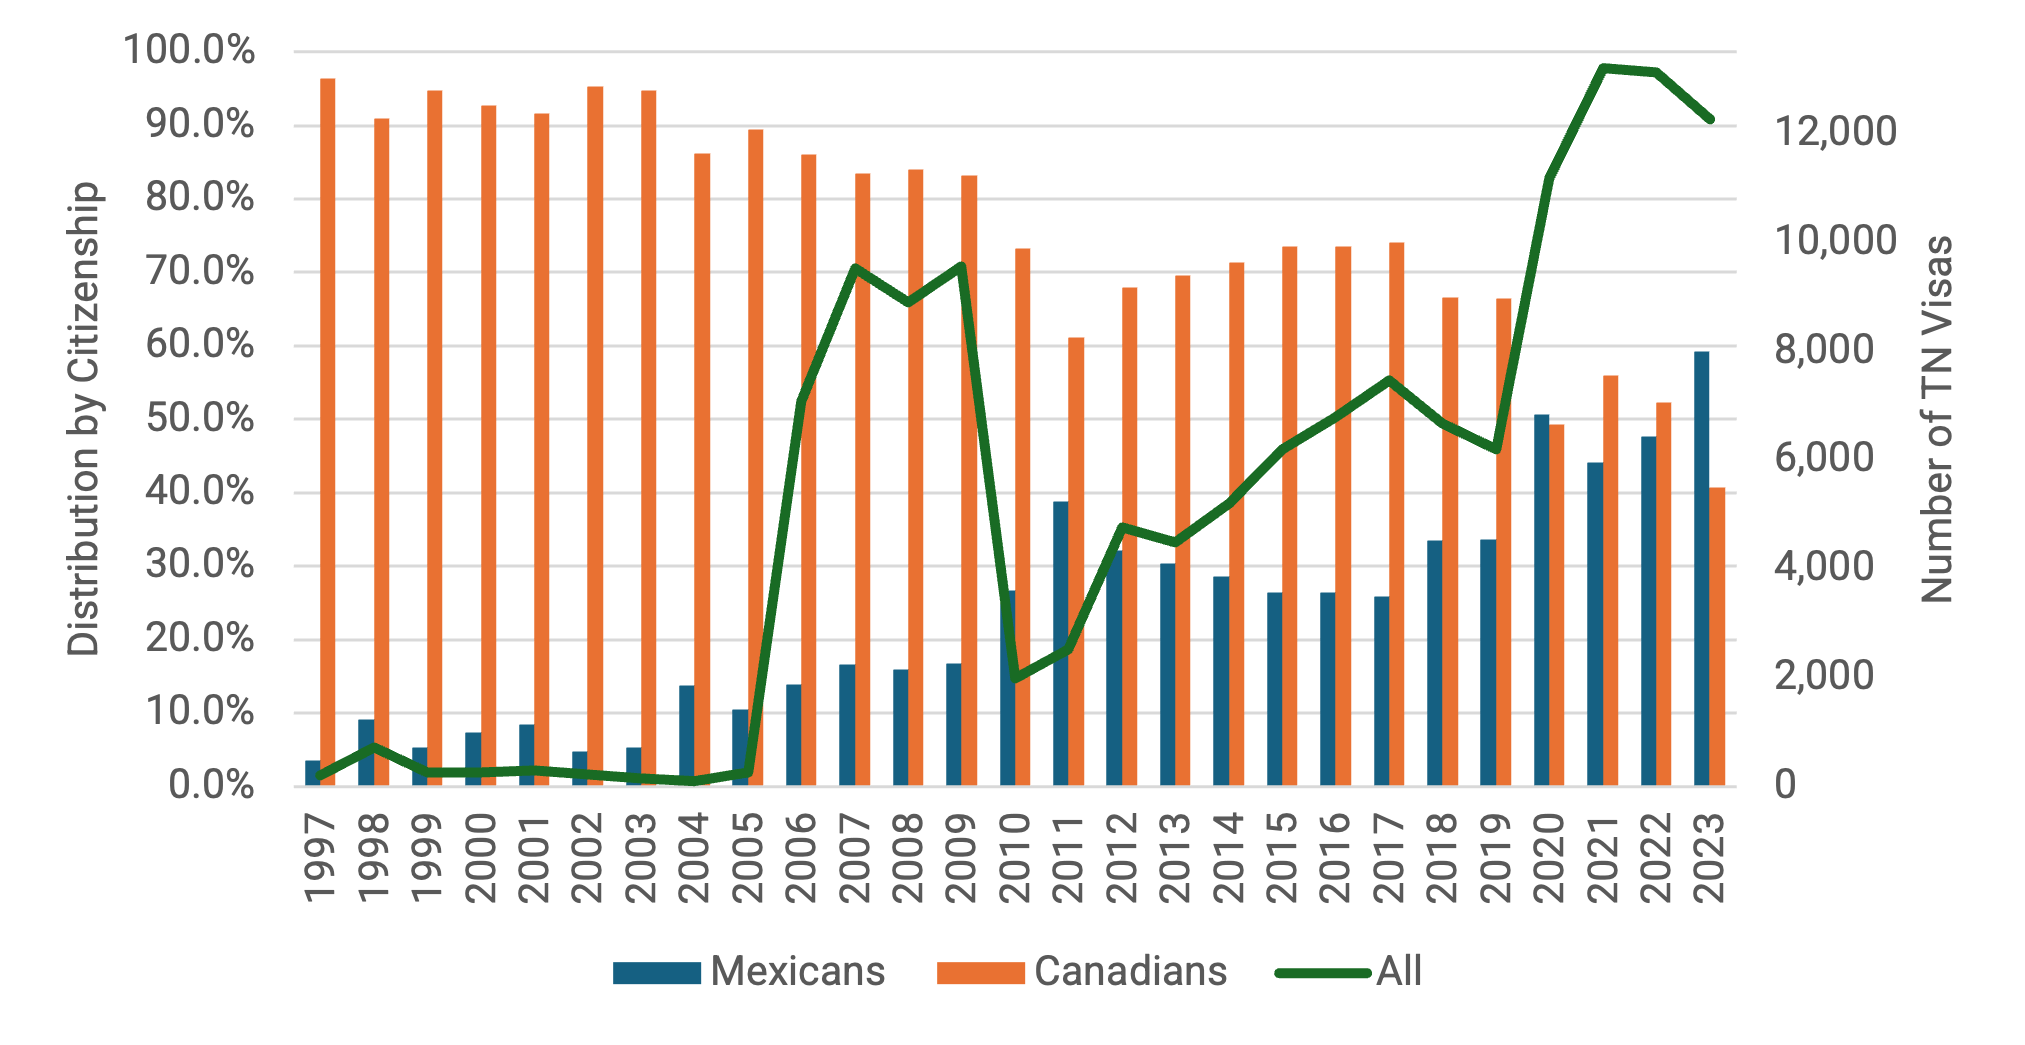
Figure 1 — Number of TN Visas and Their Distribution by Citizenship, 1997–2023
TN Visa Holders by Nationality
The analysis of the data by nationality demonstrates a significant shift in Mexican citizens’ use of the TN visa. In 2006, around 14% of TN visa holders, according to the data from a FOIA, were Mexicans, and the majority — 86% — were Canadians. Since that time, the share of Mexicans using this visa has increased considerably. In 2023, 59% of TN visa holders were from Mexico, and only 41% were from Canada.
This illustrates an important shift, as it may reflect a growing complementarity between U.S. labor force needs and an increasingly skilled Mexican population available to work in the U.S. This shift may also relate to the accessibility and affordability of obtaining a TN visa given its advantageous characteristics. Additionally, in recent years, many Mexican citizens have gradually discovered the TN visa’s existence, the ease with which it can be obtained, and the lack of competition with other nationalities — except for Canadian citizens — which all could contribute to this shift.
TN Visa Holders by State
The following graphs show the location of TN visa holders within the U.S. for the years of 2005, 2010, 2015, 2019 (before the COVID-19 pandemic), and 2023 (Figures 2–6). As the U.S. government instituted border and consulate closures due to the COVID-19 pandemic in 2020, which affected all visa processes, 2019 rather than 2020 was selected as a representative year for analysis. While these graphs illustrate changes in the distribution of TN visa holders for the selected years, the analysis in the next sections covers all years after 2005.
This data also illustrate that some states have utilized and benefited from the TN visa category considerably more than others. California consistently has a high overall percentage of TN visa holders, and Texas, Florida, North Carolina, and New York are also important beneficiaries. These results also reflect how some states’ labor markets, such as those in California and Texas, are more interconnected with the Mexican economy in comparison to other U.S. states. Also, the below percentages of TN visa holders by state vary based on nationality, which is discussed in the next section.
Figure 2 — Location of TN Visa Holders, 2005
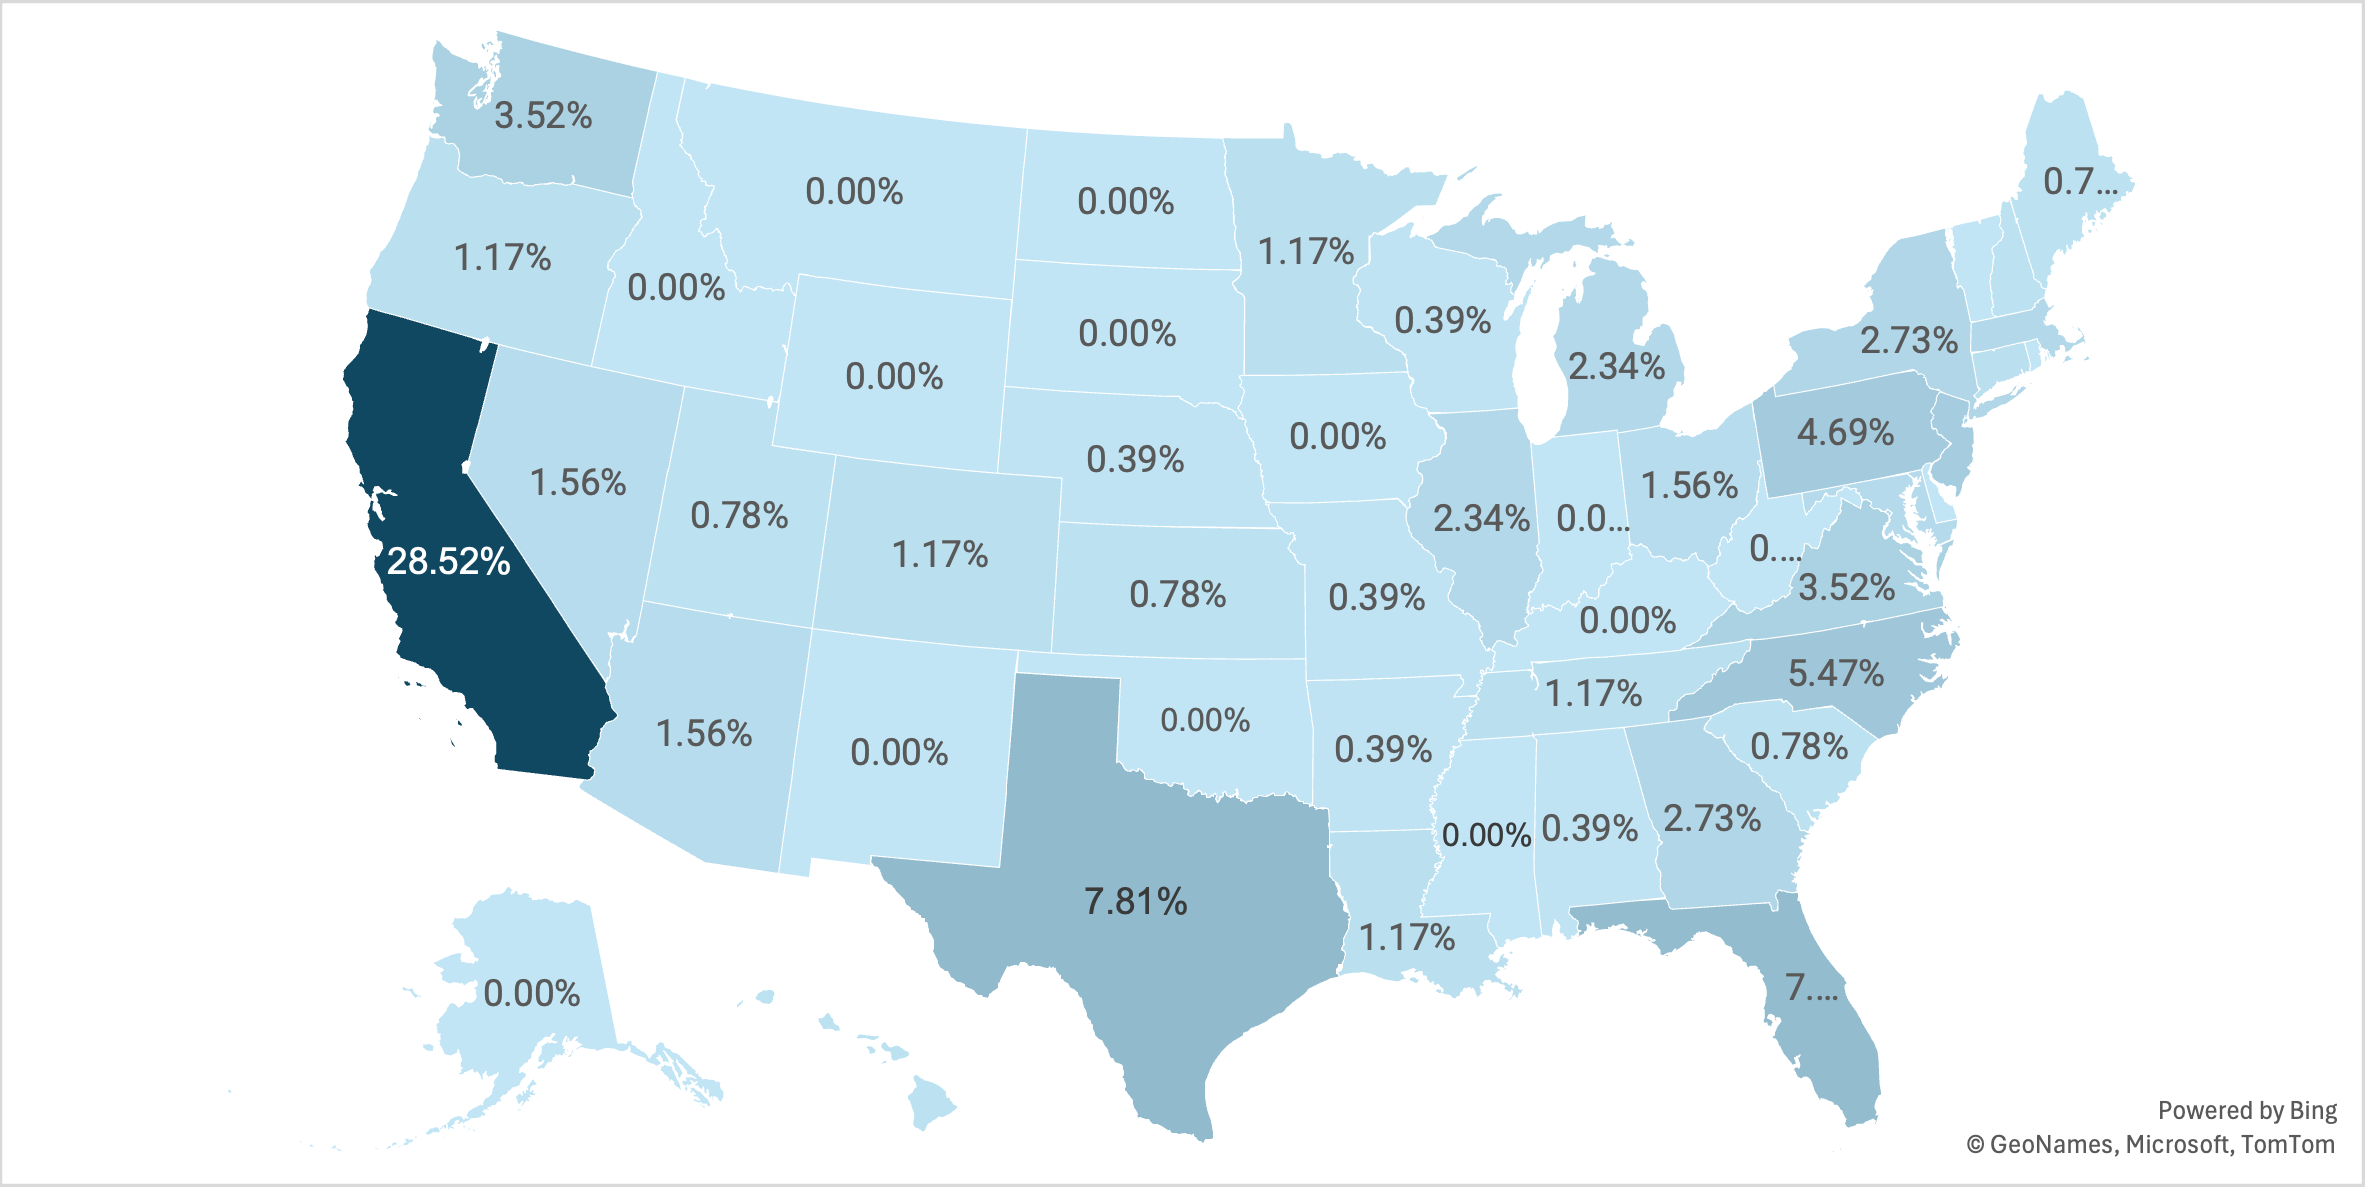
Figure 3 — Location of TN Visa Holders, 2010
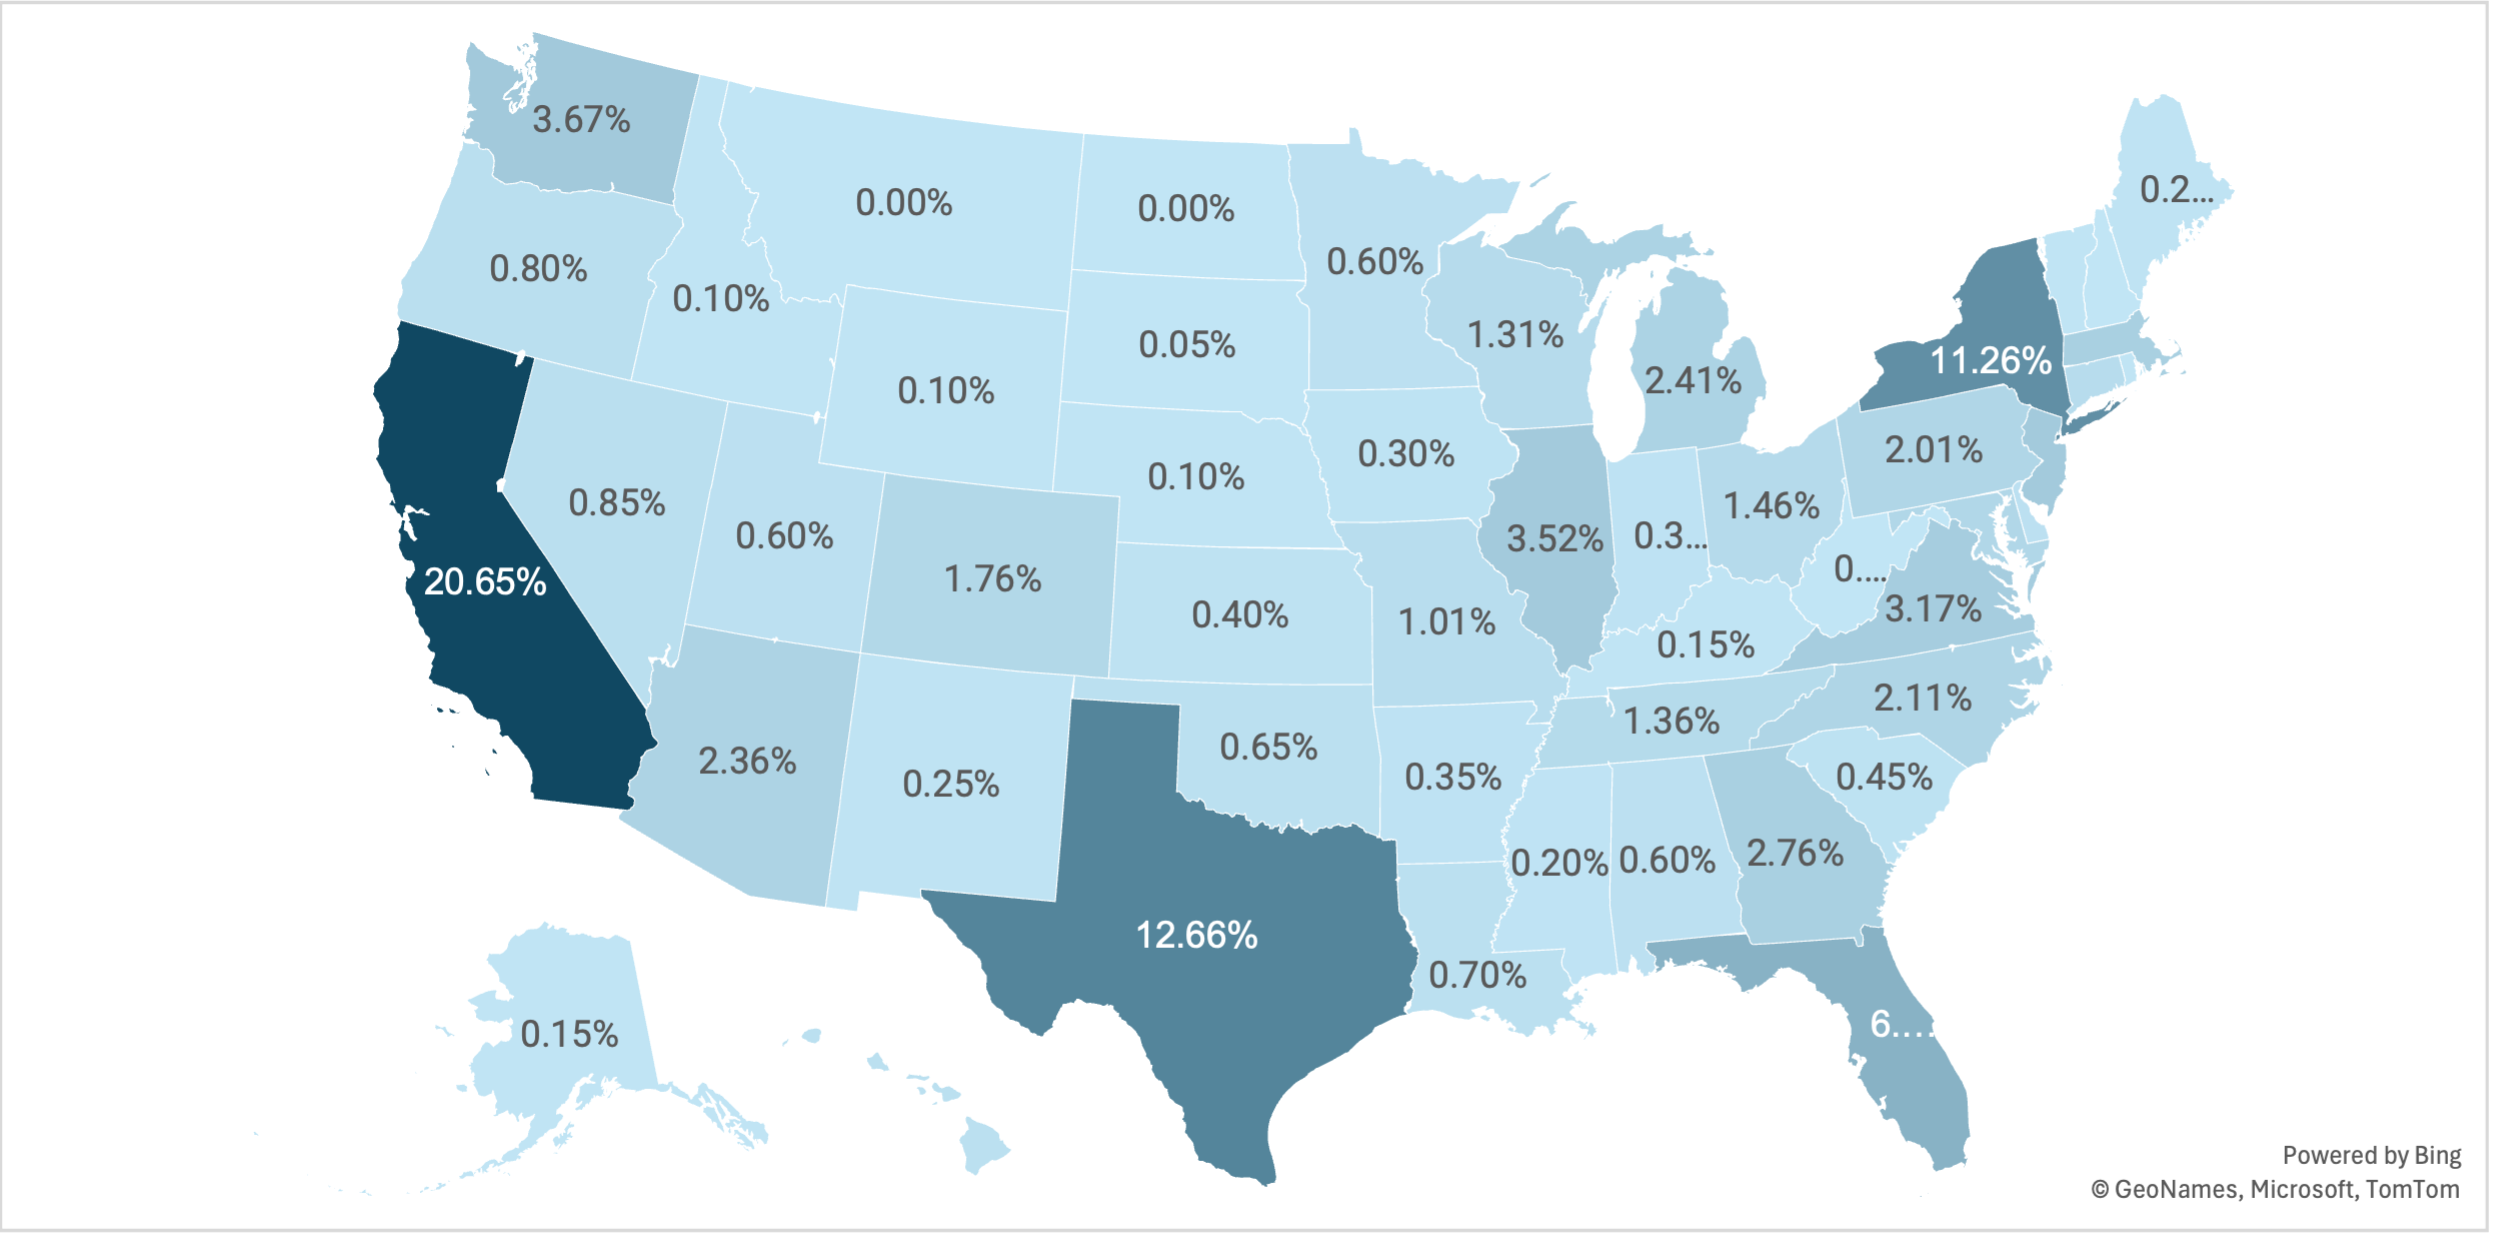
Figure 4 — Location of TN Visa Holders, 2015
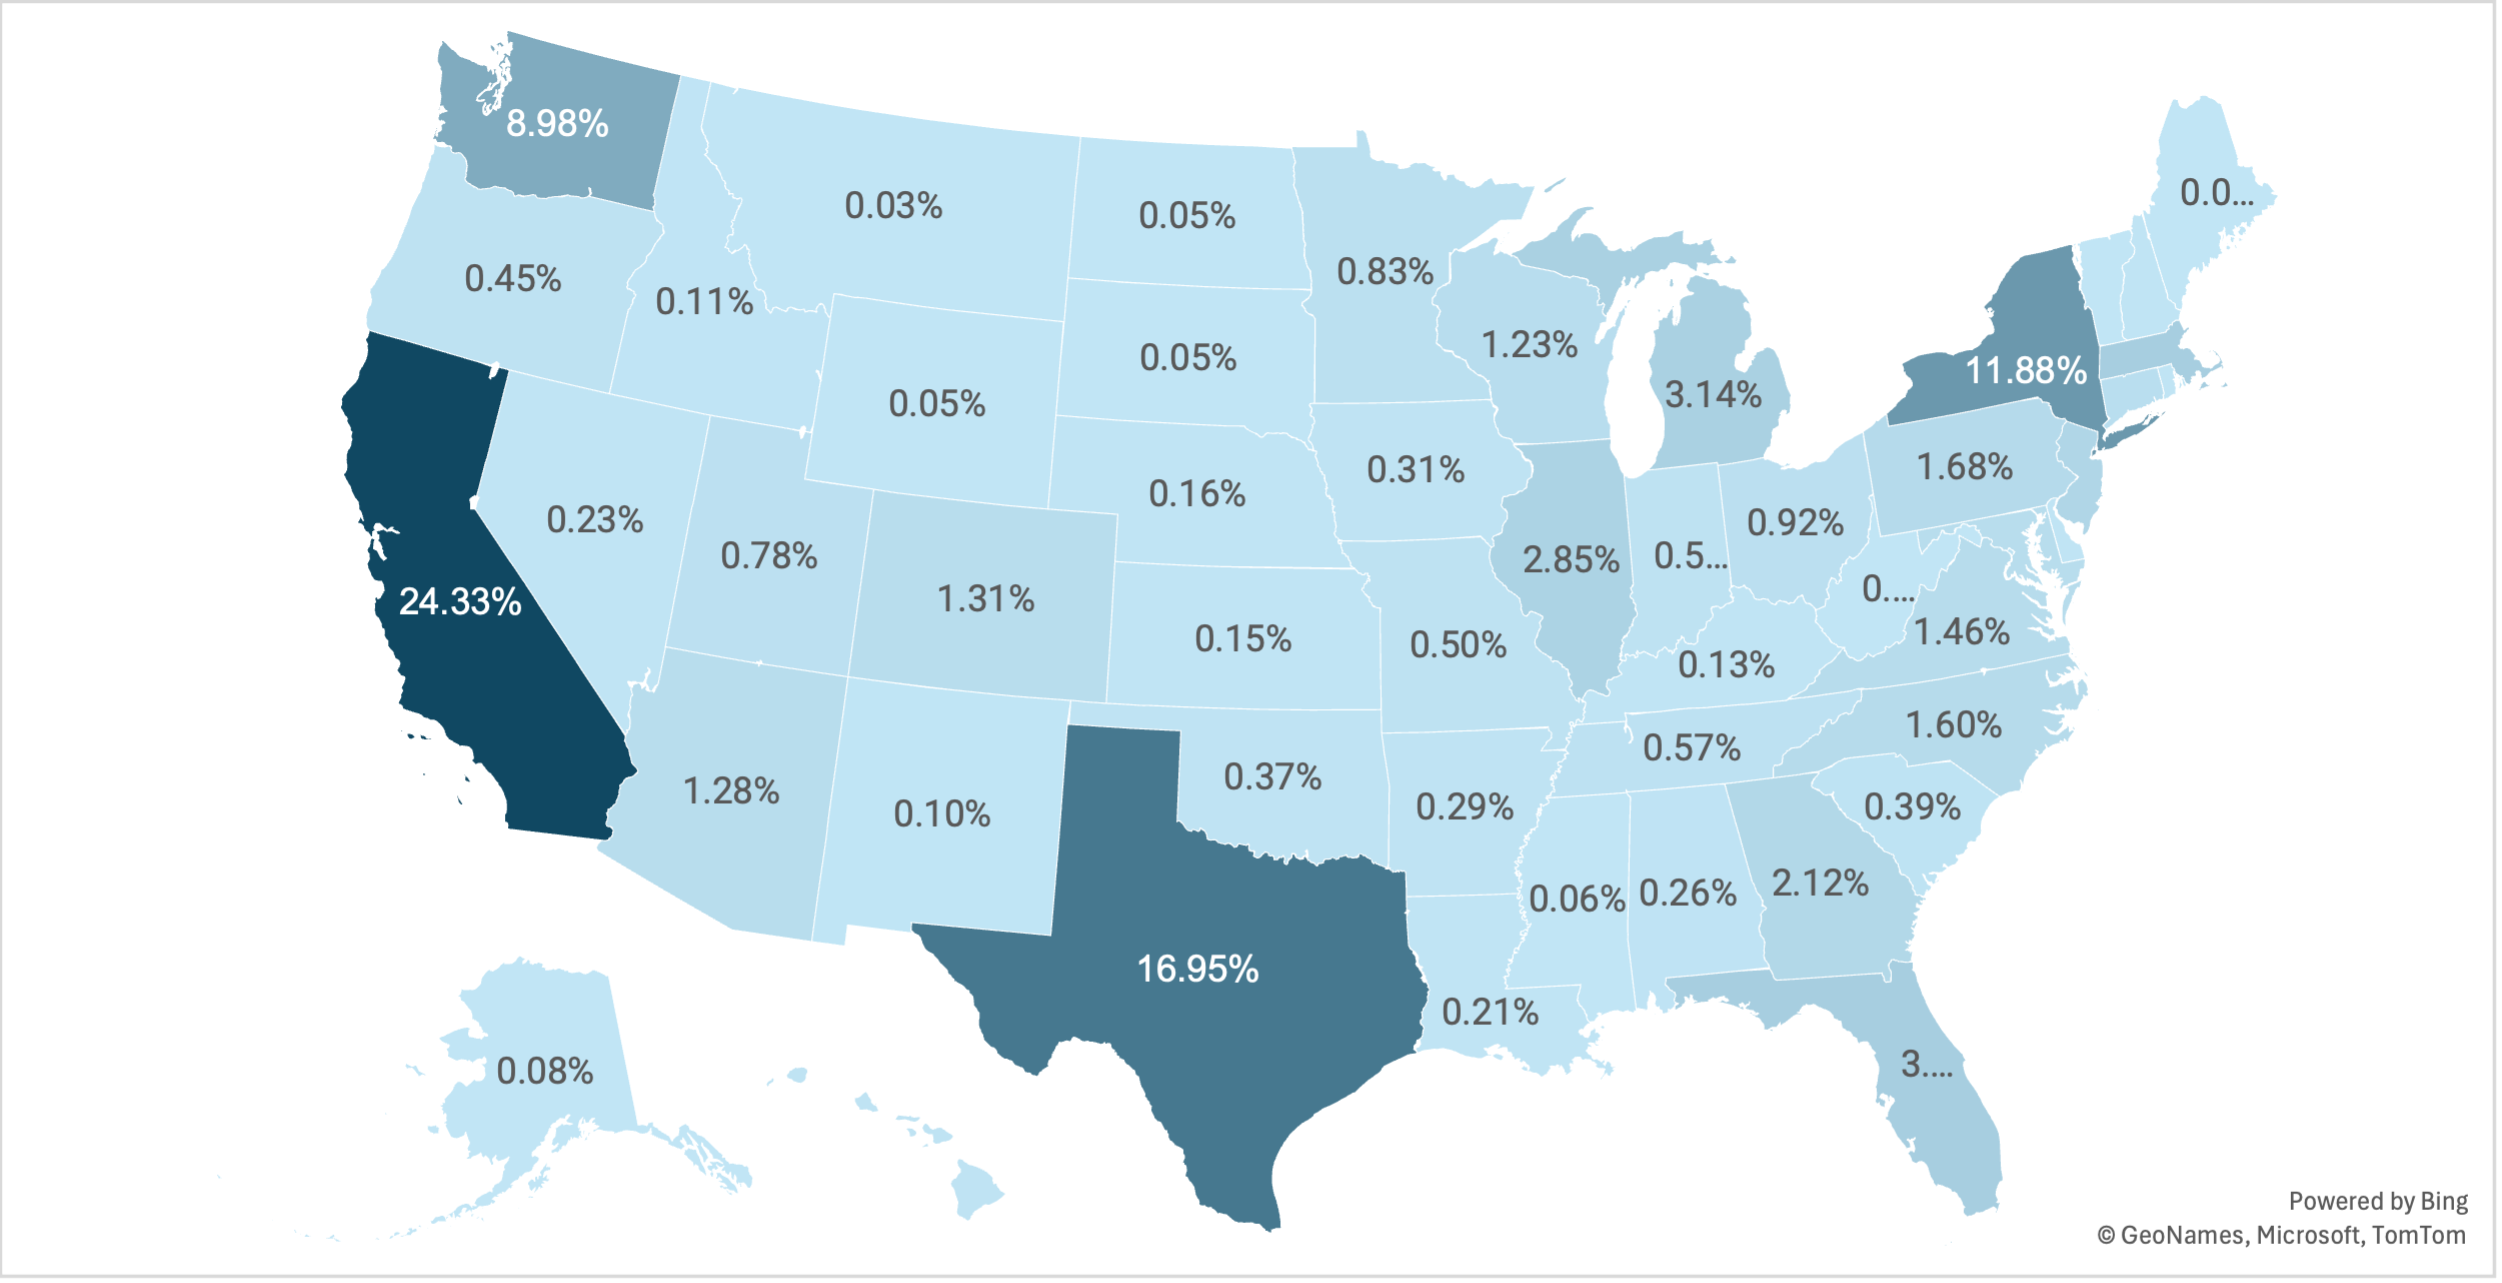
Figure 5 — Location of TN Visa Holders, 2019

Figure 6 — Location of TN Visa Holders, 2023

Given the data, California had the highest percentage of total TN visas granted, but with a significant decrease of around 11.81% between 2005 with 28.52% and 2023 with 16.70%. Texas ranked second in almost every following year except 2017 and 2019, as it was third place in those years. Overall, Texas increased its number of TN visas from 7.81% in 2005 to 13.50% in 2023, with a peak of 16.95% in 2015. Florida started in third place in 2005 with 7.42% and decreased its share of TN visas in the following years. In 2023, Florida ranked eighth with 3.50% of the total TN visas.
Other states where TN visa holders have been consistently present include Washington, New York, and Michigan. Washington increased its participation from 3.52% in 2005 to 5.90% in 2023, with a peak of 20.41% in 2017. New York showed a similar pattern, with 2.73% in 2005 and 8.42% in 2023, with a maximum of 11.88% in 2015. Michigan has become another common location for these workers, increasing from 2.34% in 2005 to 5.90% in 2023. A contrasting case is North Carolina, with a decline in its share from 5.47% in 2005 to 2.51% in 2023, with a low of 1.30% in 2017. In 2023, five states accounted for 50.42% of total TN visa workers: California (16.70%), Texas (13.50%), New York (8.42%), Washington (5.90%), and Michigan (5.90%).
In recent years, the use of the TN visa has not only increased significantly across the country, but has also spread to all states. Before 2005, some states did not participate in this visa. In 2005, for example, eight states had no workers with this status. However, since 2006, all states have had TN workers. By 2023, the states with the lowest participation in this visa were Vermont (0.057%), Maine (0.049%), and Rhode Island (0.041%).
TN Visa Holders’ Nationality by State
Mexican Citizens
Texas was the top location for TN visa workers from Mexico. In 2005, the percentage was 11.11%, setting it in second place. However, Texas’ percentage increased after that year to reach first place, peaking at 32.99% in 2015. This percentage decreased after that year but maintained the first spot, and in 2023, Texas’ share of TN visa workers from Mexico was 17.95%.
California started at the top of the list in 2005 with 29.63% of Mexican TN visa holders and subsequently maintained second place, reaching 8.49% in 2023. New Jersey was a location preferred by Mexicans in 2005 with 7.41%, but its share steadily decreased to 0.56% in 2023. In recent years, Michigan, Iowa, and Illinois have emerged as the top destinations for Mexicans using this visa. In 2005, Iowa and Illinois had no Mexican TN visa holders, but they increased in both states, reaching 6.46% and 4.85% in 2023, respectively.
In 2023, seven states accounted for 51.36% of total number of Mexican TN visa holders: Texas (17.95%), California (8.49%), Michigan (7.10%), Iowa (6.46%), Illinois (4.85%), Minnesota (3.36%), and North Carolina (3.15%). In that same year, the states with the lowest participation of Mexicans were Rhode Island (0.028%), Vermont (0.028%), and Hawaii (0.014%).
Canadian Citizens
For Canadians, the top state for TN visas was California in the years analyzed. In 2005, the percentage was 28.38%, with a maximum of 35.23% in 2019, and decreased after that year to 28.63% in 2023. New York has been in second and third positions since 2007, rising from 7.01% in that year to its highest share of 17.25% in 2023.
Washington has held second and third place since 2016. However, this state has shown high variability across all years analyzed. For example, the number of Canadians with this visa was only 3.49% in 2005, 8.94% in 2009, 5.83% in 2012, 23.51% in 2017, and 11.90% in 2023. Texas is another state with a high share of Canadians with 7.42% in 2005 to 7.02% in 2023, peaking at 11.81% in 2013. Finally, Michigan has been increasing its share of Canadian TN visa holders since 2018. Before that year, the average percentage in this state was around 2.03%; after that year, the average was approximately 4.31%. A contrasting case is Florida, with a decline in its share of Canadians from 11.96% in 2005 to 4.04% in 2023, with a minimum of 2.08% in 2017.
In 2023, three states accounted for 57.78% of the total number of Canadian TN visa holders: California (28.63%), New York (17.25%), and Washington (11.90%). For that same year, the states with the lowest participation of Canadians were North Dakota (0.040%), Mississippi (0.040%), and South Dakota (0%).
Most Requested Occupations for the TN Visa
As already stated, the occupation list that allows immigrants from Mexico and Canada to work in the U.S. has not been updated since NAFTA was established in 1994 — except for the addition of one profession. While some occupations tend to garner less interest to applicants and demand in the U.S., other occupations on the list are in high demand because they are in key sectors of the U.S. economy, which typically require more workers than are available within the U.S.-citizen workforce.
The following assessment shows that some occupations have recently been in high demand among TN visa holders. The data cover various job descriptions similar to those in Table 1. Not all individuals who apply for a TN visa extension or adjustment via Form I-129 provided complete information about their jobs. Only 87% of workers with approved TN visas noted this information. In the data provided, various professions were identified, and the following are those with the highest proportion of approved TN visas. The most prominent occupation categories based on the data were engineers, health care professionals, mathematicians, and life and environmental scientists.
Occupation Categories
The data catalogued different types of engineering. The engineer category as analyzed includes: electrical or electronic, mechanical, industrial, civil, chemical, aerospace, and other types of engineering. More specifically, engineers apply scientific and mathematical principles to design and maintain systems, structures, and technologies in key industries, such as manufacturing, information technology (IT), construction and infrastructure, transportation, aerospace, health care, energy, and utilities.
Similar to engineering, the category of health care professionals includes various roles: health service, health technician, pharmacist, dietitian, physical therapist, physician, surgeon, osteopath, registered nurse, and other health care practitioners. Health care professionals engage in patient care, medical research, public health, and administrative support. They primarily work in hospitals and health systems, long-term care facilities, pharmaceutical and biotechnology industries, health care IT, and research.
Per the data, the category of mathematicians includes statisticians and actuaries. These professionals utilize advanced mathematics and data analysis to solve problems in diverse areas, such as finance, insurance, IT, health care, academia, research, energy, manufacturing, consulting, and business analytics.
The scientific technician category refers to roles that support scientists and researchers in their laboratories, mainly assisting them with experiments and data analysis. These technicians work in a variety of industries, such as pharmaceutical and biotechnology, environmental and energy services, health care technology, agriculture, and food.
Life and environmental scientists comprise another top occupation category. They study ecosystems and environmental systems to understand and solve ecological problems that promote sustainability. These scientists work in key sectors including environmental consulting, agriculture, food, pharmaceuticals, biotechnology, research, academia, energy, and utilities.
The category of management support professionals refers to workers providing administrative, operational, and strategic assistance to companies. They work across various leading industries, such as health care, finance, insurance, IT, and manufacturing.
Finally, the category of accountants and auditors pertains to workers responsible for the accuracy of financial records and compliance with corporate tax laws. They work in business management, technology, manufacturing, retail, financial services and banking, real estate, energy, and utilities.
Analysis
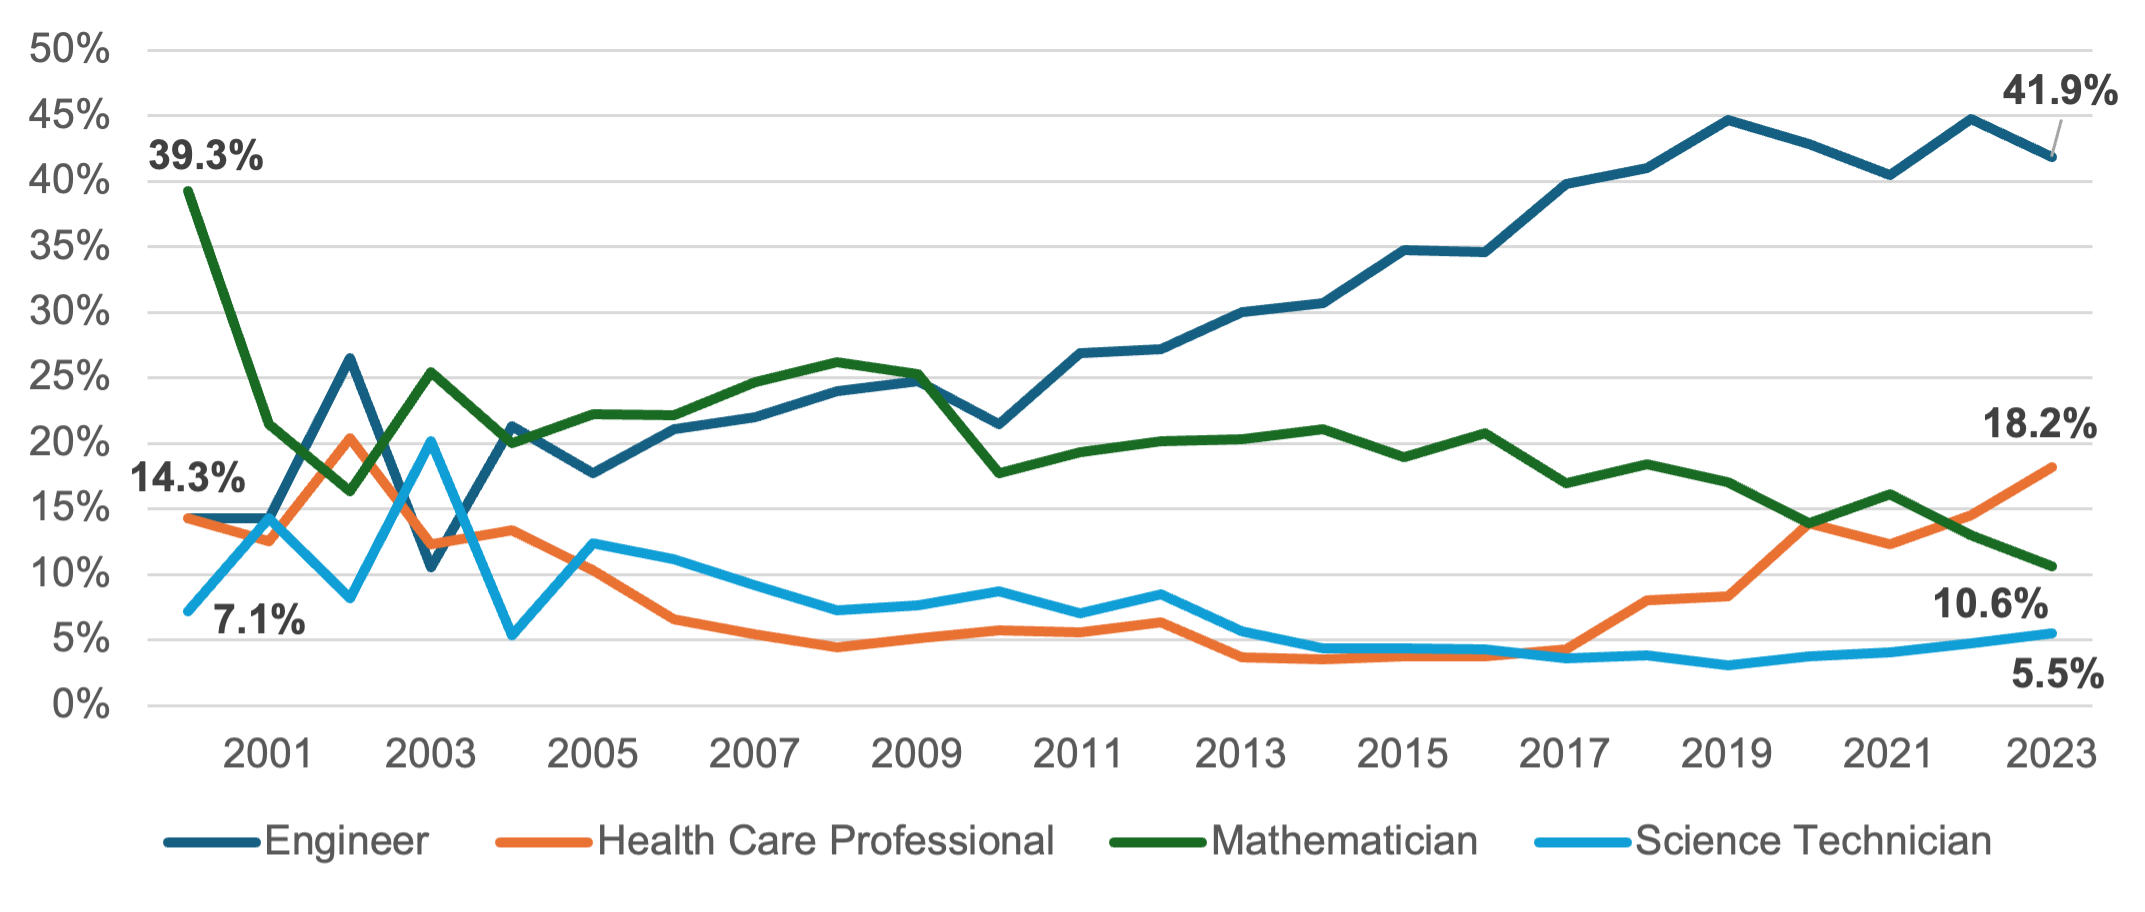
The following analysis focuses only on professions with percentages greater than 10% of the total number of TN visas. Engineering has been the leading occupation for all approved TN visa holders since 2010 (Figure 7). That year, its share was 21.5% and increased considerably to 41.9% in 2023. This occupation’s share averaged 38.68% between 2013 and 2023.
Mathematics has been another notable profession for this visa, ranking second between 2010 (17.7%) and 2021 (16.1%). After that year, it dropped to third place. From 2013 to 2023, it averaged 17.01%. While the industries that require engineers and health care professionals tend to be more evident, the industries in which mathematicians work are not so readily clear. In 2023, for example, most workers in mathematics were in IT (45.34%), followed by financial services and banking (21.22%). This is because this category includes data scientists and actuaries.
Health care professions have gained momentum since 2017 and surpassed mathematicians in 2022, reaching 18.2% in 2023. The average TN visa share for health care occupations was 8.55% between 2013 and 2023.
In 2023, the three occupation categories of engineer, mathematician, and health care professional accounted for 70.7% of all TN visa holders and have maintained that level since 2019.
Figure 7 — Top Jobs for TN Visa Holders, 2000–23
Future Considerations
The data above indicates that most TN visa holders work in science, technology, engineering, mathematics, and medicine (STEMM) fields. STEMM is a pillar of the U.S. economy, driving innovation, employment, and productivity, and thereby increasing the country’s competitiveness. STEMM fields significantly support the U.S. workforce; for example, these positions contributed approximately 39% of its GDP in 2023.
However, for decades, the U.S. has faced a significant shortage of this skilled workforce, which has affected its economy. Therefore, the TN visa has helped alleviate these labor shortages, though not on a large scale. Furthermore, since the H-1B visa has maintained its low cap on the number of issued visas per year since 2004, the TN visa has positioned itself as an effective alternative to mitigate this labor shortage and should continue to do so. As the demand for STEMM positions is projected to increase by 10.5% between 2023 and 2033, the U.S. labor market will likely require more foreign-born workers in the coming years.
Top Occupations for TN Visa Holders by Nationality
A more detailed analysis of TN visa holders approved for Mexican and Canadian citizens reveals slightly different results, although the fundamental trends do not change significantly.
Mexican Citizens
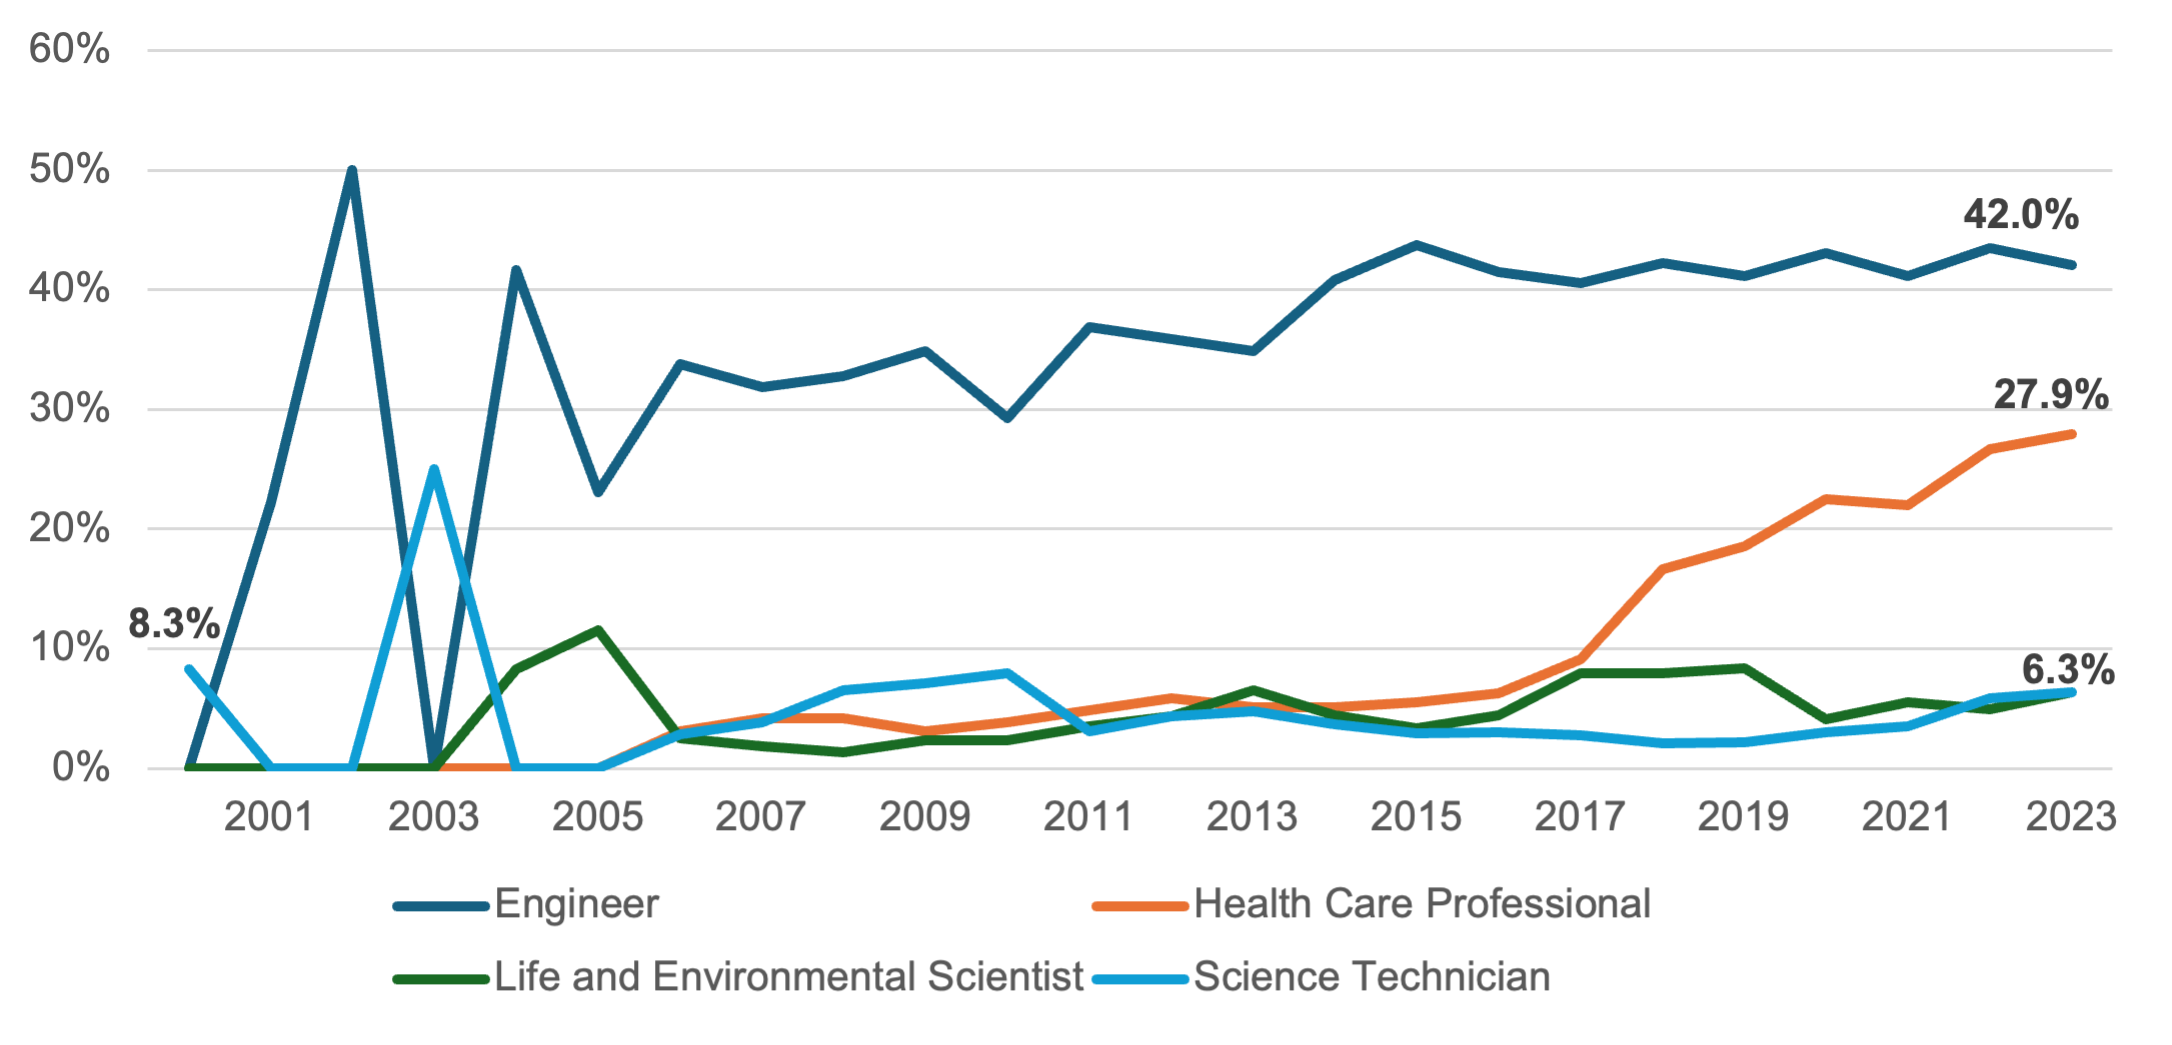
In the case of Mexican TN visa holders, engineering has been consistently the top occupation. This likely reflects Mexican universities’ sustained investment in engineering programs. Additionally, many engineers from Mexico found that the U.S. tended to offer jobs with higher salaries and more opportunities for growth. Engineer as the leading occupation for TN visa holders began in 2004 at a rate of 33.8% and subsequently increased to 42.0% in 2023 (Figure 8).
Engineering was not the only profession that trended upward among Mexican TN visa holders. In recent years, Mexicans utilized this visa for health care professions. Among health care workers, the largest increase in this visa occurred in 2018 with 16.6% and peaked at 27.9% in 2023.
Interestingly, these two professions represented approximately 70% of the total TN visas for Mexico in 2023. The share for both professions combined has exceeded 48% since 2015. Both of these trends reflect that while these are rapidly expanding professions in the U.S., labor shortages persist for both engineering and health care occupations.
Figure 8 — Top Jobs of Mexican TN Visa Holders, 2000–23
Canadian Citizens
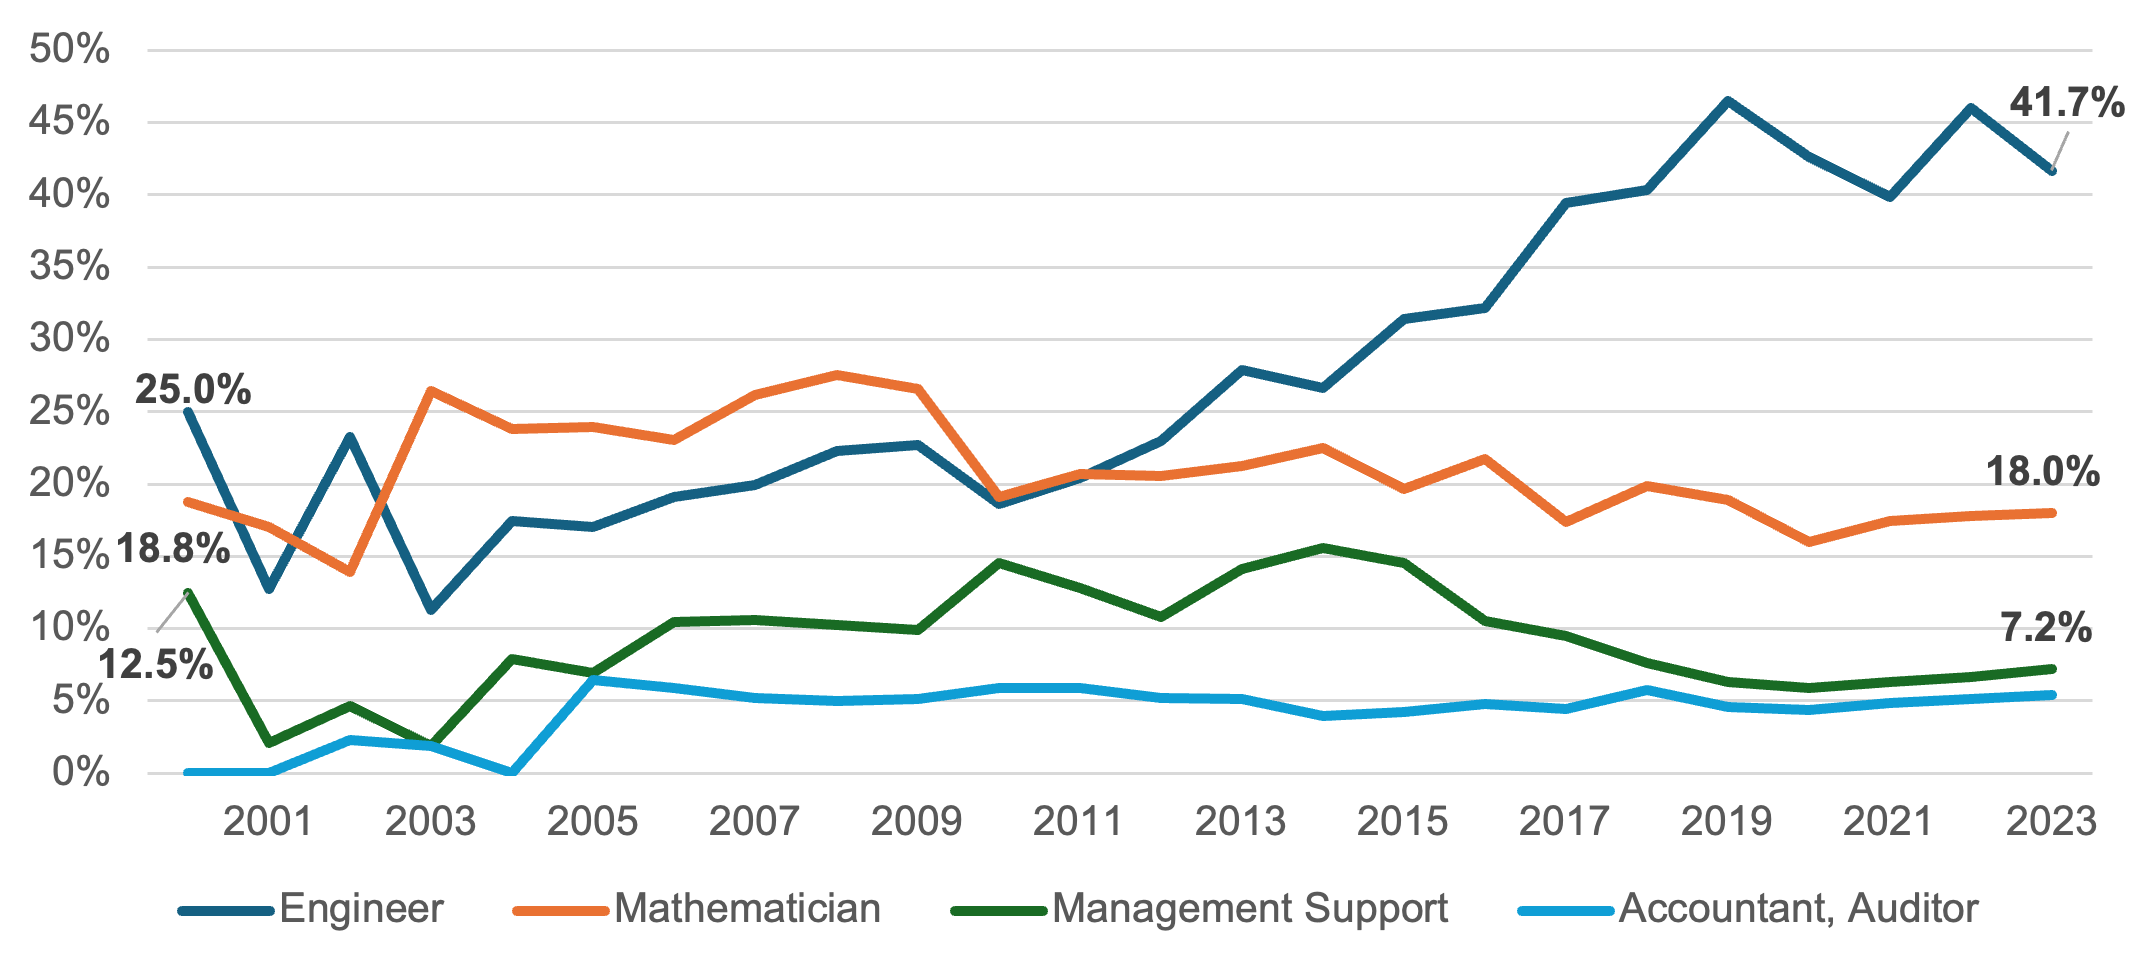
Canadian workers with TN visas are distributed mainly across two occupations: engineers and mathematicians. Engineering has held the top spot since 2011, peaking in 2019 at 46.5%. In 2023, this share reached 41.7% (Figure 9). Engineers are thus top TN-visa holders among both nationalities, Canadians and Mexicans.
Mathematicians were at the top between 2003 at 26.4% and 2011 at 20.75%. After that year, they fell to second place, ending with 18.0% in 2023.
These two professions accounted for around 60% of the total TN visas approved for Canadians in 2023. This share has exceeded 49% since 2013.
Figure 9 — Top Jobs of Canadian TN Visa Holders, 2000–23
US Labor Market Needs
Between the two nationalities, engineering, mathematicians, and health care professionals comprise the majority of TN visa holders. This greatly reflects the needs of the U.S. labor market, as health care workers, engineers, and mathematicians, including data scientists and analysts and software developers and programmers, are among the fastest growing professions in the United States.
Top Locations and Professions Chosen by TN Visa Holders
As discussed previously, in recent years, the top states where those with approved Form I-129 TN visas have worked have been California and Texas. This section combines this information with the most common occupations under the TN visa for 2023. The goal is to understand how these professions are distributed among these states and to identify any differences by state and nationality.
California
In 2023, California had approximately 16.70% of all TN visa holders. Most were engineers at 60.19%, followed by mathematicians at 8.94%. These two jobs averaged 62.86% of TN visa holders in the state between 2013 and 2023.
Canadians represented 28.63% of TN visas and had the same pattern: 58.93% for engineering and 10.43% for mathematics. Both professions averaged 61.32% during the same period.
Mexicans accounted for only 8.49% of TN visa holders in this state. Engineers were in the top position at 63.12%, followed by mathematicians at 5.48%. These two jobs averaged 68.95% from 2013 to 2023.
Texas
In 2023, Texas had a share of 13.50% of all TN visa holders. Engineers topped the list, but not as high as in California, at 43.76%, and mathematicians were second at 12.23%. Both occupations averaged 59.83% between 2013 and 2023.
However, some health care professions have increased significantly since the COVID-19 pandemic. In 2019, they represented 3.79% of total TN visas, but in 2020, their share increased to 9.72%, reaching an average of 8.12% between 2020 and 2023. This increase was accentuated among Mexicans, with an average of 8.97% for the same period.
For Mexicans with this visa, Texas was their primary destination. In 2023, engineers ranked first with 46.18%, health care professions placed second with 10.53%, and mathematicians settled at third with 9.75%. These three occupations averaged 62.13% from 2013 to 2023.
In 2023, Canadians represented only 7.02% of total TN visa holders in this state, ranking fourth. Engineers and mathematicians were the most common professions, averaging 60.70% between 2013 and 2023.
Other US States
The following states are analyzed solely by the nationality that obtained the highest number of TN visas in 2023, based on the data. Previously noted, for Mexicans, the states with the highest number of TN visa holders were Texas, California, and Michigan. For Canadians, those states were California, New York, and Washington.
Michigan
Michigan is the third destination for Mexicans with TN visas. In 2023, the professions that topped the list were engineering with 79.80%, and health care professions with 8.71%. Health care professionals increased their share since 2017, from 2.59% that year to 7.35% in 2018. These two occupations averaged 80.97% between 2013 and 2023.
New York
In 2023, TN visas for Canadians in New York ranked second in these visas. Engineers were first with 28.13%, followed by mathematicians with 21.28%. Both professions averaged 41.82% from 2013 to 2023.
Washington
In 2023, Washington represented the third-largest share of TN visa holders from Canada. The vast majority of occupations were in engineering at 62.76% and mathematics at 25.34%. These two jobs have averaged 83.37% between 2013 and 2023.
Why the TN Visa Matters
Over the last three decades, the TN visa has proven to valuable not only to many Mexican and Canadian professionals who have gained access to the U.S. labor market, but also to many U.S. businesses, which have clearly benefited from the North American regional talent. Moreover, among some of the professions listed in the USMCA, especially those that are the most utilized, U.S. university graduates appear to be somewhat misaligned with industry needs.
TN visa holders help fill the gap between U.S. graduates and labor market demand. In this sense, TN visa holders do not seem to compete with U.S. workers, but complement the market. However, this likely shows that the U.S. should implement domestic strategies to align U.S.-citizen skill acquisition with industry demand through more effective means.
At the same time, considerable skepticism surrounds the aim of freer trade under the second Trump administration, especially as its massive deportation campaign carries significant economic costs. Additionally, the USMCA is likely to be reviewed and revised in 2026 as mandated by the agreement itself, which could affect the TN visa’s status, despite it being a nonimmigrant visa.
However, the TN visa has consistently proven to be an orderly and legal way to integrate North American labor markets and grow the pool of workers to help align skills with industry demand in the region. This is a corollary to the fact that TN visa holders’ occupations are primarily some of the fastest-growing professions in the U.S.
All this indicates that the TN visa is of significant value to both workers and businesses, in addition to being a visa that is closely indexed to U.S. economic performance. More specifically, when the U.S. economy is strong, job offers will flow, and TN visas will be issued. When the economy is not performing well, job offers will not flow, and, thus, TN visas will not be requested.
This criterion gives this visa a distinct advantage, as most of its acquisition is closely aligned with U.S. market needs. Thus, in any renegotiation of the USMCA, the TN visa should be preserved, and its list of eligible professions should be updated and expanded to reflect the current U.S. labor market.
Moreover, predicting what professions will likely to be in high demand in the future is a difficult task, as the job market quickly changes based on industry needs and innovations. Thus, the TN visa’s list of qualified professions should be made slightly more flexible to allow the USMCA Trade Commission to periodically review the list and update it to align with new labor market needs.
Indeed, one of the greatest advantages of the USMCA over NAFTA is that the USMCA allows for periodic revisions in order to continually update the agreement to follow changes in the economy. Similarly, the TN visa should be periodically reviewed to ensure that it continues to serve both workers and businesses.
Conclusion
The TN visa has been a key element of the U.S. workforce in recent years. It has supported critical sectors of the economy, such as IT, health care, manufacturing, and financial services and banking. Therefore, TN visa holders have notably contributed to the economic growth of major states, such as California, Texas, and New York. Over the past decade, these three states have contributed approximately 31.15% to the U.S. GDP. California leads all states with 14.07%, followed by Texas at 8.89% and then New York at 8.18%.
Since 2006, the TN visa has been a effective substitute for the H-1B visa. However, it could be used more widely, as it has no restrictions on the number of visa issued per year and is closely indexed to the U.S. economy. Therefore, when the U.S. economy requires more workers, more TN visas should be approved.
With the USMCA’s upcoming review and revision, it is important to maintain and improve this visa by updating its list of eligible professions as well as providing the same application process for both Mexican and Canadian citizens. Moreover, a mechanism should be added to Chapter 16 in order to allow the USMCA Trade Commission to periodically update the list of professions.
This publication was produced on behalf of Rice University’s Baker Institute for Public Policy. Wherever feasible, the material was reviewed by external experts prior to its release. Any errors are the responsibility of the author(s) alone.
This material may be quoted or reproduced without prior permission, provided appropriate credit is given to the author(s) and Rice University’s Baker Institute for Public Policy. The views expressed herein are those of the individual author(s) and do not necessarily represent the views of Rice University’s Baker Institute for Public Policy.


