
Introduction
Over time, children have become less physically active. Health experts are concerned because this trend is associated with worsening physical and social health, overall well-being, and autonomy. Children’s ability to explore their neighborhood without supervision — a form of unstructured play once commonplace in the United States — has declined for multiple reasons, including the perceived risk of injury from motor vehicles. Peter Gray and others have argued that this reduction in unstructured play is a major contributor to decreases in children’s resilience, self-determination, and belief in their ability to control their lives.
When children are outside, they are at higher risk of injury due to their still developing cognitive ability and small size. This makes them particularly vulnerable to serious injuries, especially in areas where they walk or bike near high-speed motor vehicles.
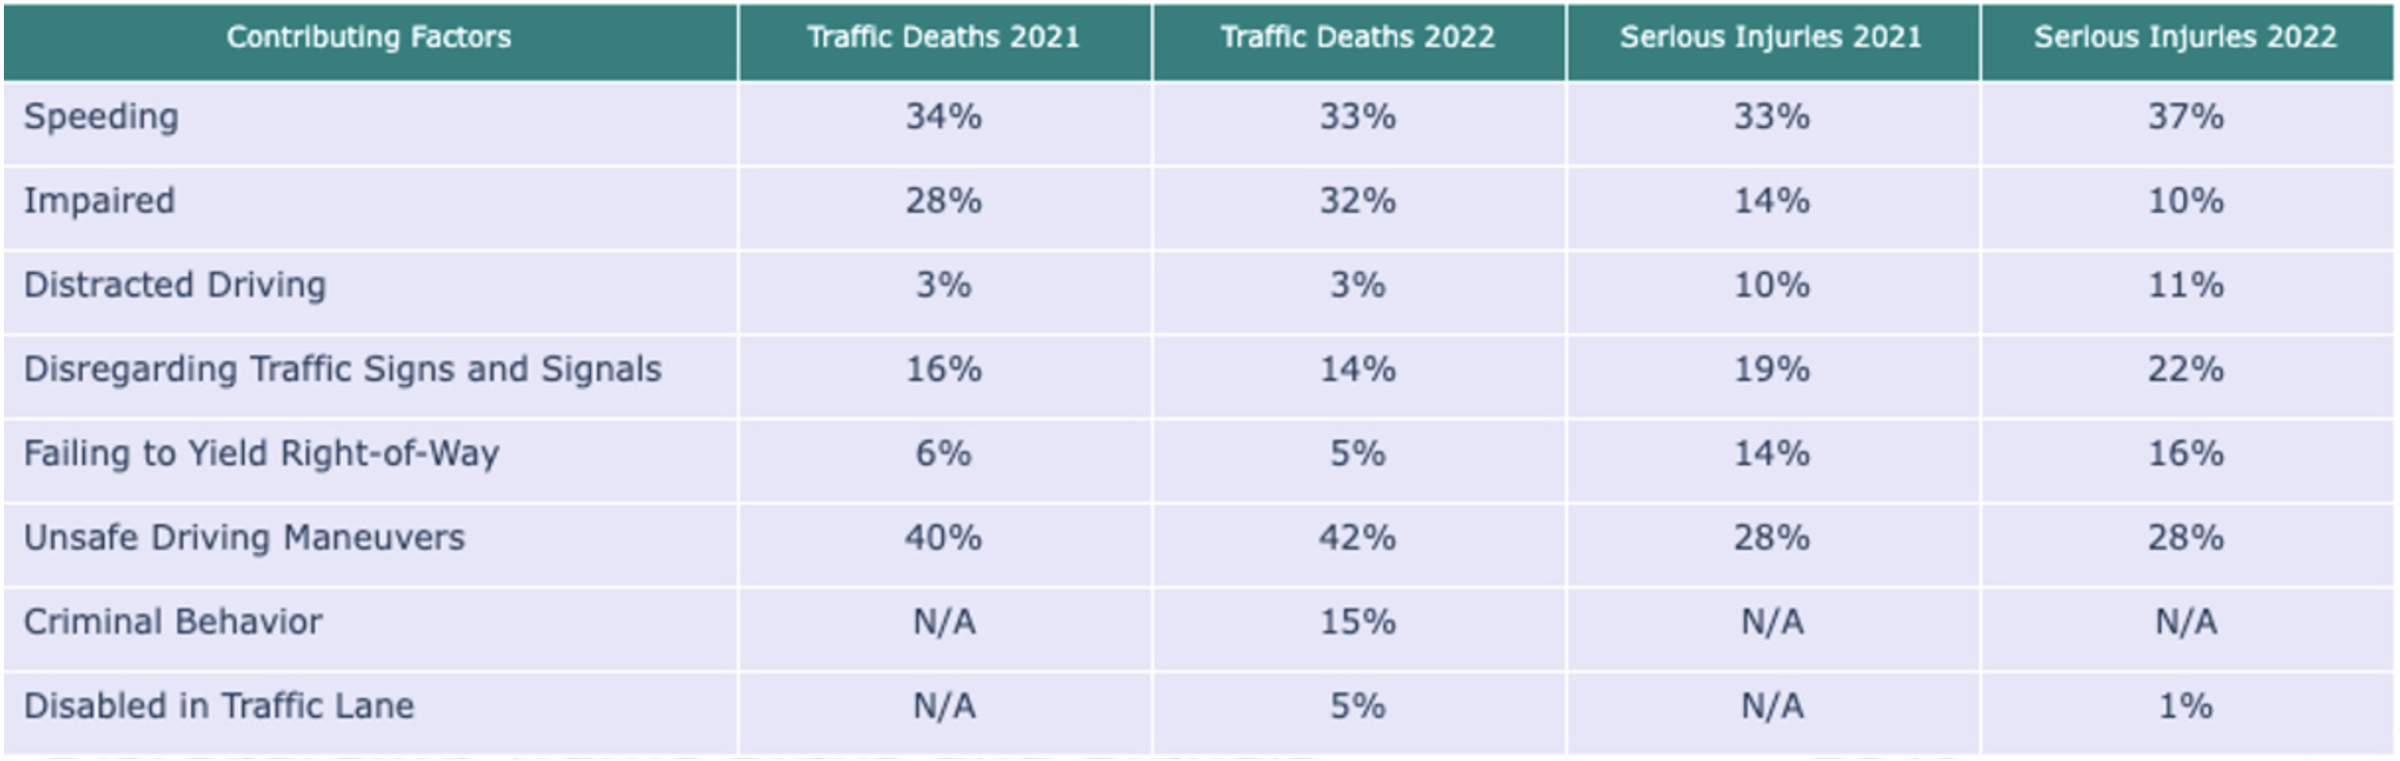
In Houston, two of the major barriers to reversing this trend are driving behavior and road design. Speeding, unsafe driving maneuvers, and impaired drivers have contributed to a considerable proportion of the traffic deaths in Houston (Table 1). However, progress is being made: In a previous policy brief we detailed the benefits of a road redesign in the Gulfton area — early data suggests that it has successfully slowed motor vehicle speeds and improved walking and biking comfort.
Table 1 — Contributing Factors to Traffic Deaths
Focus of This Brief
While there are risks for children walking and biking throughout the city, they are higher for certain groups: boys, African Americans, and those living in socially vulnerable neighborhoods. Drawing on statistical analysis, this brief looks at who is disproportionately affected, where incidents occur, and details focused interventions that can provide low cost, high yield, and equitable benefits for Houston children.
Study Methodology
Our study analyzed all active transportation injuries and fatalities to children in Houston from 2018–23, and this brief reports on the emerging patterns. A total of 646 incidents were recorded, with 454 having geospatial data. This data enabled the creation of a map including geospatial-specific variables such as the social vulnerability index (Figure 4).
Demographic Trends
Several patterns emerged from the analysis:
- Older children and boys were most likely to be injured as pedestrians or bicyclists: 67% of injured children were male and 56% were 12 years or older.
- Black children were significantly overrepresented compared to the general population: they comprised 40% of all children injured or killed, while making up only 22% of Houston’s children (Figure 1).
- Hispanic children were underrepresented among injured children compared to the general population, being 40% of our study population compared to 55% of the Houston child population.
- White and Asian children were within 2% of their proportion in the general population.
- Finally, no association was found between injury severity and age, gender, or ethnicity.
Figure 1 — Crash Victims: Ethnicity Distribution Versus Total Percentage by Race
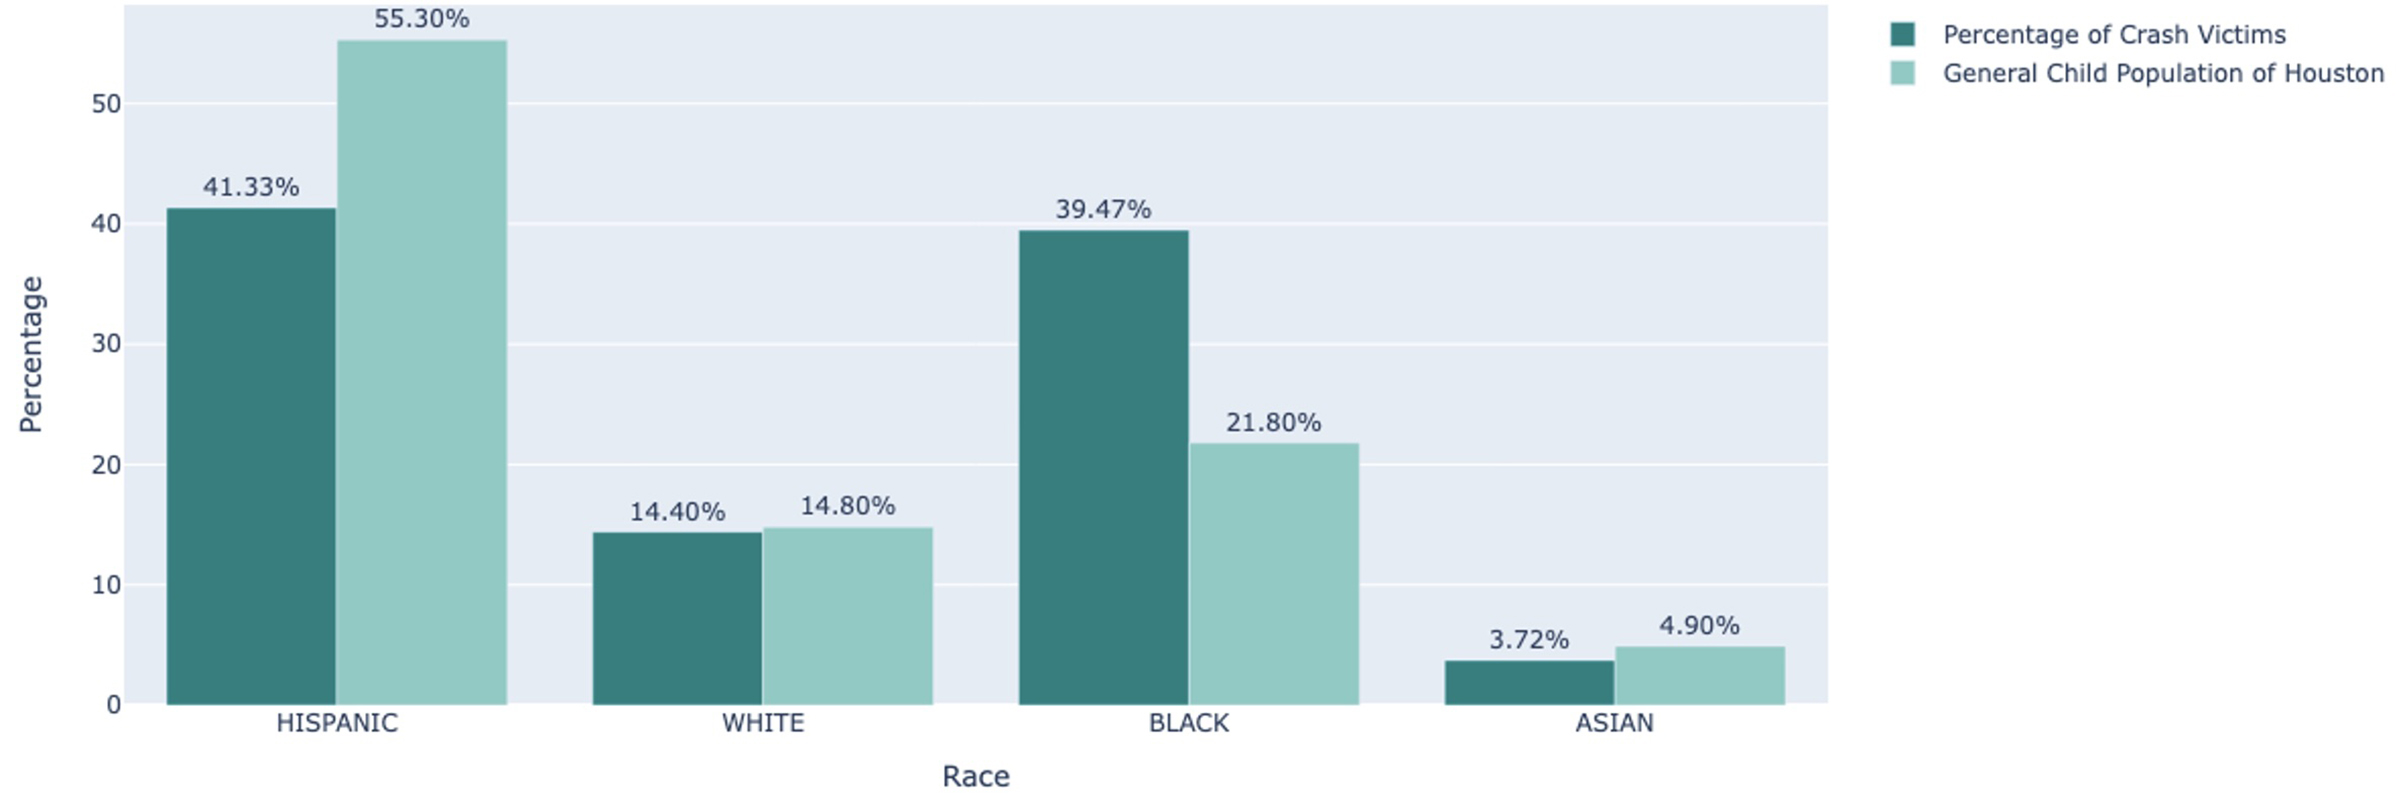
Note: This graph compares ethnicity of the children in the study to the general demographics of Houston children, using 2022 American Community Survey (ACS) 5-year estimates for the city of Houston.
Where Incidents Occur
When analyzing incident locations, while no ethnic difference in injury severity was found, these points were observed:
- A majority, 63%, of all injuries occurred outside of an intersection, reflecting national trends.
- Statistically, Hispanic and Black children were significantly more likely to be hit by drivers in non-intersection crashes (Figure 2).
- Of the 21 fatal crashes, 20 occurred outside of an intersection, a statistically significant association (Figure 3).
- Boys were more likely to be involved in non-intersection crashes, as were younger children.
Figure 2 — Percentage by Race Within Intersection Groups

Figure 3 — Relationship Between Injury Severity and Intersection Relation

Social Vulnerability
Social vulnerability, the potential negative effects on communities caused by external stresses on human health, is measured by the Centers for Disease Control and Prevention (CDC) and Agency for Toxic Substances and Disease Registry (ATSDR) using their Social Vulnerability Index (SVI) score. This 16-variable composite score is intended to measure social vulnerability and has demonstrated utility in disaster response, public and environmental health, urban planning, and policy.
In the Houston area, there is a small, but significant association between crash locations and social vulnerability. The city’s two largest hotspots are in:
- Southwest Houston between Interstate 69 and the Westpark Tollway.
- The southern portion of the city in the Sunnyside and South Park neighborhood.
The map below shows that both hotspots are in socially vulnerable neighborhoods (Figure 4). Another observation: The majority of the northwestern inner loop (Interstate 610), an urbanized portion of the city with low social vulnerability, has comparatively few crashes.
Figure 4 — Association Between Social Vulnerability and Crash Density
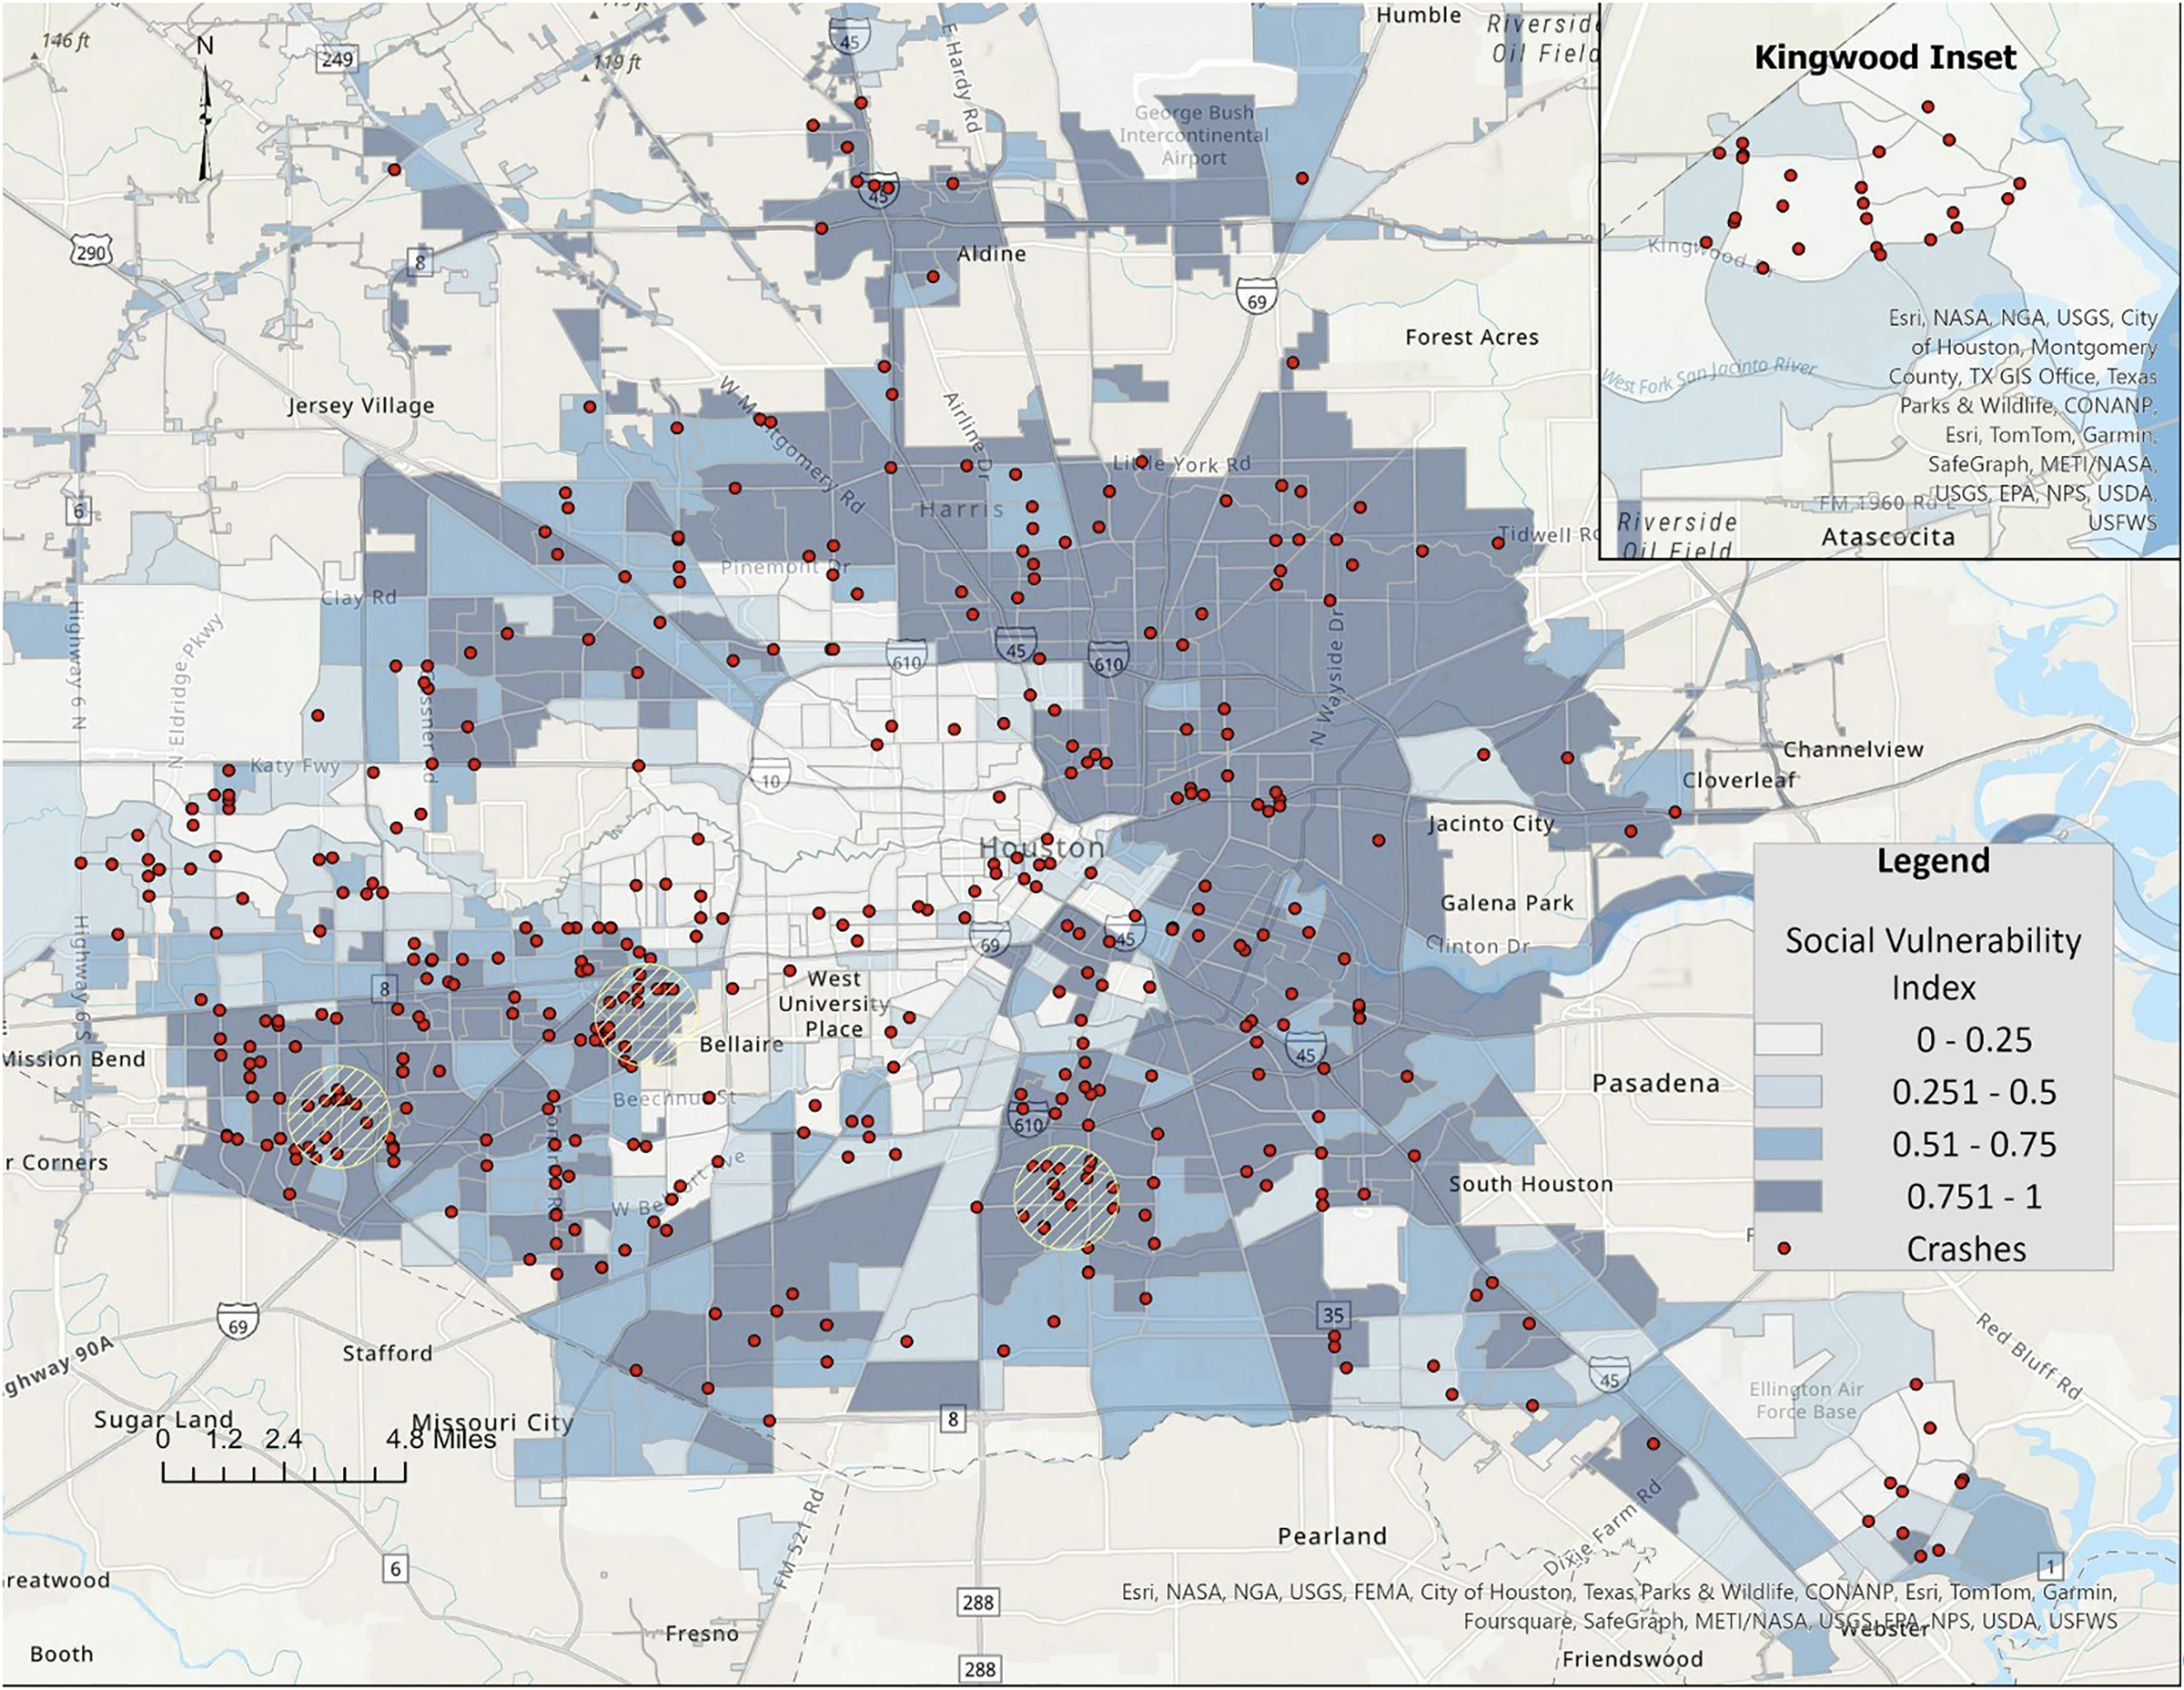
Note: The image shows a visualization of the significant association between social vulnerability and crash density. Yellow circles indicate hotspots investigated in a previous brief. A regression analysis of census tracts and their overall SVI (2020, compared to all census tracts in the country) compared to crash counts revealed a small but significant association.
Conclusions and Recommendations
Slower Roads and Safer Drivers
Traffic speed is at the core of transportation injuries worldwide. Creating a more comfortable driving experience at lower speeds, with less need for rapid braking, is central to evolving the Houston region’s transportation system to be more forgiving of human error. This can be achieved through intensified enforcement with a focus on the fastest and most reckless drivers — a stated priority for Mayor John Whitmore’s office — supplemented by low cost structural interventions where the need is highest. These include:
- Pedestrian islands and curb extensions in high-risk intersections can reduce the distance a child has to travel while unprotected from a motor vehicle driver.
- Mid-block crossings can be highlighted by pedestrian hybrid beacons (PHBs), which use flashing lights activated by a crossing pedestrian.
- Raised crosswalks can slow motor vehicle speeds and increase visibility of child pedestrians and bicyclists.
Safe Routes to School
The promotion of walking and bicycling to school through infrastructure improvement, incentives, enforcement, tools, and education is a priority of the Texas Department of Transportation’s Safe Routes to School Programs — as a result, funding opportunities exist to improve child active transportation access to schools. Some local level interventions that could benefit the region include:
- Bicycle and pedestrian school buses: A Houston-based study has shown that children chaperoned by adults to and from school using active transportation experience increased physical activity. Such interventions can also improve commute safety and neighborhood cohesion.
- Community awareness and child road safety education programs in high risk areas can improve child pedestrian and bicyclist behavior through behavioral changes.
Better Data Collection
Obtaining higher quality data to drive, support, and achieve more equitable outcomes will be crucial in serving this unusually diverse city. Child pedestrian and bicyclist injuries in Houston are notable for occurring between intersections rather than within them and for their higher likelihood of involving boys, Black children, and older youths . While there is a statistically significant association between socially vulnerable areas and crash occurrences, it is only a small part of the explanation of why crashes occur in certain neighborhoods. To address the inequitable exposure to injuries we recommend:
- Implementation of validated, objective, measures that assess school access for children commuting on foot or bicycle.
- Utilizing a school-based “walk score” for schools of different types and locations to ensure more equitable use of resources, allowing identification of and early intervention in the areas most in need.
This material may be quoted or reproduced without prior permission, provided appropriate credit is given to the author and Rice University’s Baker Institute for Public Policy. The views expressed herein are those of the individual author(s), and do not necessarily represent the views of Rice University’s Baker Institute for Public Policy.


