
Author(s)

Immigration Inflows Since 2020
Immigration has surfaced as one of the most important issues in the United States in recent years. These concerns tend to be rooted in large-scale recent inflows of immigrants, particularly the trends after 2020. According to a Congressional Budget Office (CBO) estimate, in 2023, net immigration rose to approximately 3.2 million, up from an average of about 900,000 per year between 2010 and 2020. Research from the Hamilton Project shows that the majority of this increase, however, was not due to undocumented migration but to asylum seekers crossing the U.S. southern border. These asylum seekers were primarily comprised of those waiting in the asylum court queue, which has a significant backlog, and those granted humanitarian protection.
In addition to the documented impacts on local communities, labor markets, and fiscal budgets, this post-2020 migration episode has proven pivotal in high-stakes elections. For example, several polls leading up to the 2024 presidential election indicated immigration as one of the most important issue facing voters.
This brief provides insights into the number and demographics of post-2020 immigration inflows across the U.S.-Mexico southern border through the following aims:
- Assess data on encounters at the U.S. southern border to detail recent inflows with respect to volume, timing, and source countries.
- Examine microdata from the American Community Surveys (ACS) to explore the degree to which such border crossings resulted in increased immigrant presence within the U.S.
- Analyze ACS data to characterize recent immigrants in the U.S. according to their demographic backgrounds, educational attainment, and work status.
More specifically, ACS data detail who came to the U.S.-Mexico border, who was admitted into the U.S., what their country of origin was, and where they settled in the U.S.
Understanding the key points above provides a broad view of the ways U.S. immigration trends have shift in recent years, particularly from 2021 to 2023.
Southwest Land Border Encounters Data
US Customs and Border Protection Data
Assessing U.S. southern border crossings into the United States from 2019 to 2025 is a useful starting point to navigate the dynamics of immigration inflows during this period. U.S. Customs and Border Protection (CBP) tracks encounters with immigrants crossing into the United States via its Southwest Land Border (SBO) Encounters database, which focuses on the U.S.-Mexico border.
These SBO encounters represent instances in which CBP officers or agents apprehended or processed individuals attempting to enter the U.S. without valid entry documents, either between ports of entry or at ports of entry. Importantly, these data do not correspond exactly to inflows of individuals due to the following:
- Many individuals may be apprehended and/or expelled.
- Individuals may cross multiple times, which would manifest in the data as multiple encounters.
- The data do not reflect immigrants that enter clandestinely or evade apprehension.
Trends From Encounters Data by Type of Encounter
Figure 1 displays encounters at the U.S.-Mexico border from CBP. The solid black line shows total encounters. The dashed lines disaggregate encounters by type: “Apprehensions,” “Inadmissibles,” and “Expulsions.” The category of “Apprehensions” reflects cases involving the physical control or temporary detainment of individuals encountered between ports of entry that are found to be not lawfully in the U.S. The category of “Inadmissibles” refers to individuals seeking lawful entry at ports of entry who are determined to be inadmissible — e.g., invalid entry documents or categories of immigrants explicitly barred by law — or that present themselves to be seeking humanitarian protection. Finally, the category of “Expulsions” refers to cases under Title 42 where individuals were immediately returned to their home countries without standard legal proceedings.
Per CBP data, U.S. southern border encounters rose in the first half of 2019, followed by a reciprocal decline in the second half of the year. Title 42 was enacted in March 2020 as a response to health concerns during the COVID-19 pandemic. However, this stated reason may not have been the primary motivation to use Title 42 to stem the immigration flow at the border, as it allowed the expulsion of border crossers without standard asylum proceedings. As a consequence of this measure, during 2020, almost all border encounters resulted in Title 42 expulsions, which rose steadily throughout the year. The start of 2021 saw a sudden increase, driven by apprehensions and expulsions, each ranging between roughly 60,000–110,000 per month through the year’s end.
Figure 1 — Southwest Land Border (SBO) Encounters by Month, 2019–25

Early 2022 marked a unique change in border activity. “Apprehensions” rose from around 68,000 in February 2022 to over 100,000 in both March and April 2022, and to over 120,000 in May 2022. “Inadmissibles” also rose substantially, exhibiting a significant increase with 30,000 in April 2022 from 9,000 in the previous month, and continually growing through the remainder of 2022. Throughout the second half of 2022, “Expulsions” began declining steadily, as only approximately 50,000 were recorded by year’s end, which is a stark comparison to the over 100,000 reported expulsions in each month between March and May 2022.
Early 2023 saw a brief drop in the category of “Apprehensions,” matched somewhat by an uptick in “Expulsions,” which CBP attributed to increased enforcement measures. However, SBO encounters quickly rose in March and continued to climb upward for the rest of the year. These upturns were primarily driven by those within the “Apprehensions” category, but with “Inadmissibles” also showing growth. Encounters peaked in the fourth quarter of 2023, with totals reaching over 250,000 per month.
Trends From Encounters Data by Origin Country
Figure 2 displays CBP data reporting southwest border encounters by country for select South and Central American countries. Mexico accounted for the largest number of SBO encounters, with increases beginning in 2020, and peak months reaching over 80,000. Venezuela also had substantial rise in encounters, with much of the growth occurring in 2023 and 2024 after the end of Title 42. In contrast, Cuba exhibited significant numbers earlier, between 2022 and 2023, with lesser encounters outside these years. Guatemala and Honduras also had considerable totals, with peak months reaching around 40,000 encounters. Other South and Central American nations — Brazil, Colombia, Ecuador, El Salvador, Haiti, Nicaragua, and Peru — exhibited smaller numbers individually but still contributed to overall growth.
Figure 2 — SBO Encounters by South and Central American Countries, 2019–25
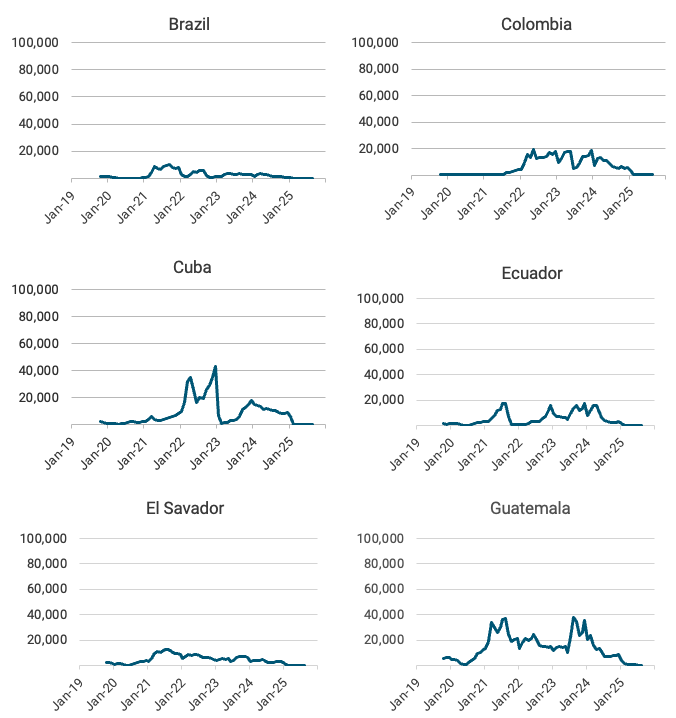
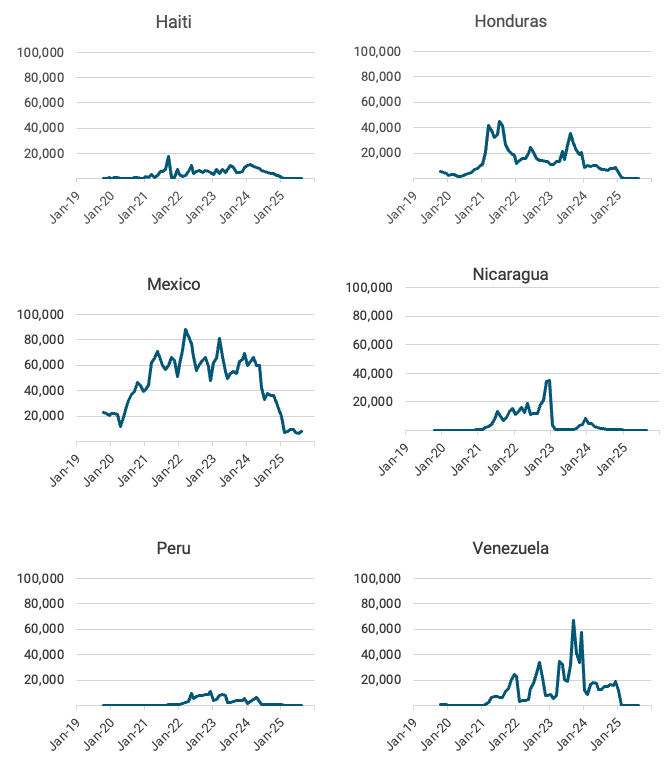
Note: Figure shows total SBO encounters by immigrants’ citizenship.
Trends From Encounters Data by Demographic Group
Much of the initial growth in SBO encounters at the U.S.-Mexico border was driven by single adults, as shown in Figures 3 and 4. Between 2020 and mid-2023, single adults accounted for roughly 70% of encounters. However, the early months of 2021 as well as the later surge in 2023 after the end of Title 24 saw shifts in the composition of encounters toward families with children. Specifically, encounters of families with children present rose considerably after March 2023, accounting for 30–50% of encounters through the end of 2024. Encounters with unaccompanied minors did increase in early 2021 and remained steadily elevated afterward.
Figure 3 — Number of SBO Encounters by Demographic Group, 2020–25
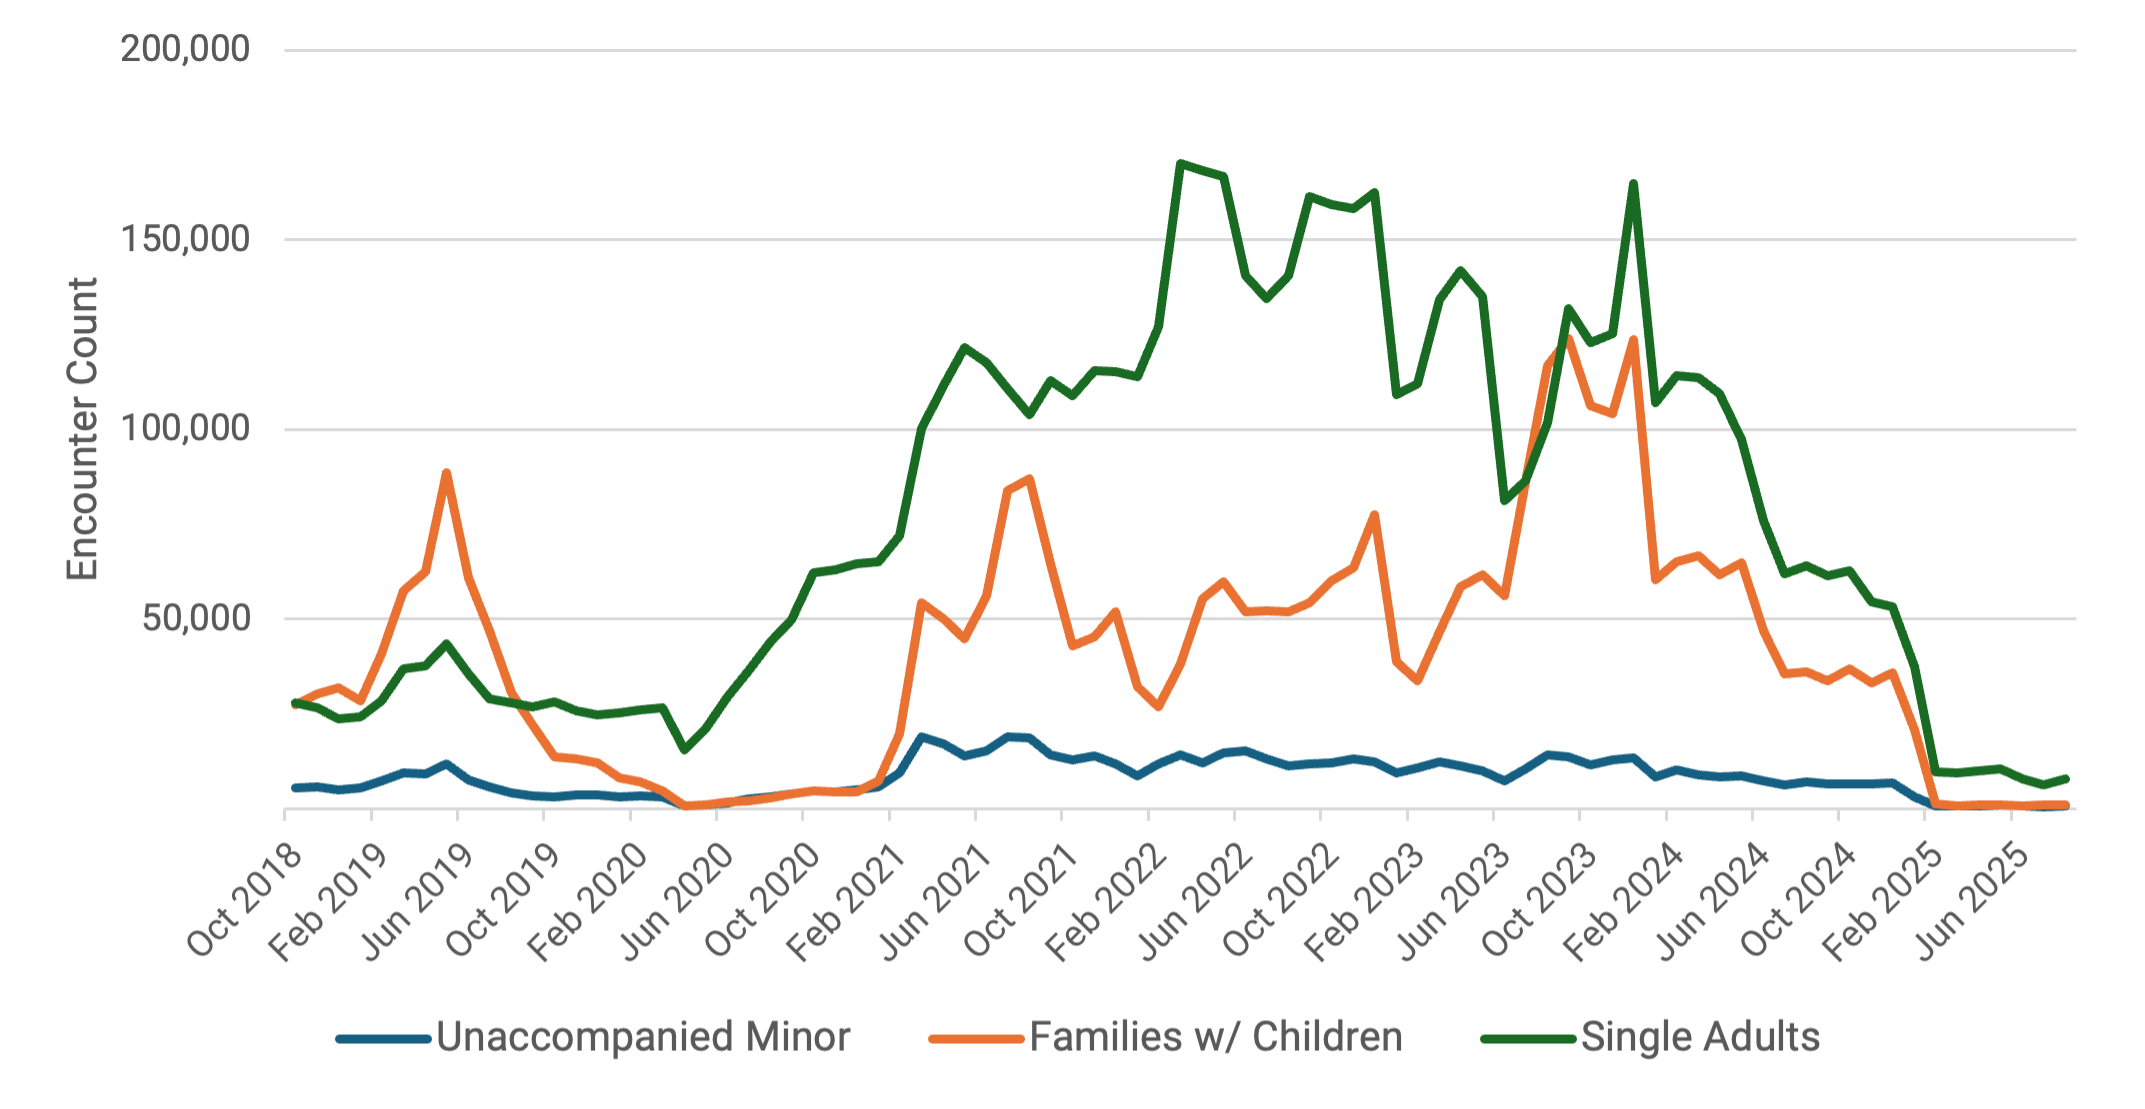
Note: Figure shows total SBO encounters by immigrants’ citizenship.
Figure 4 — Share of Total SBO Encounters by Demographic Group, 2020–25
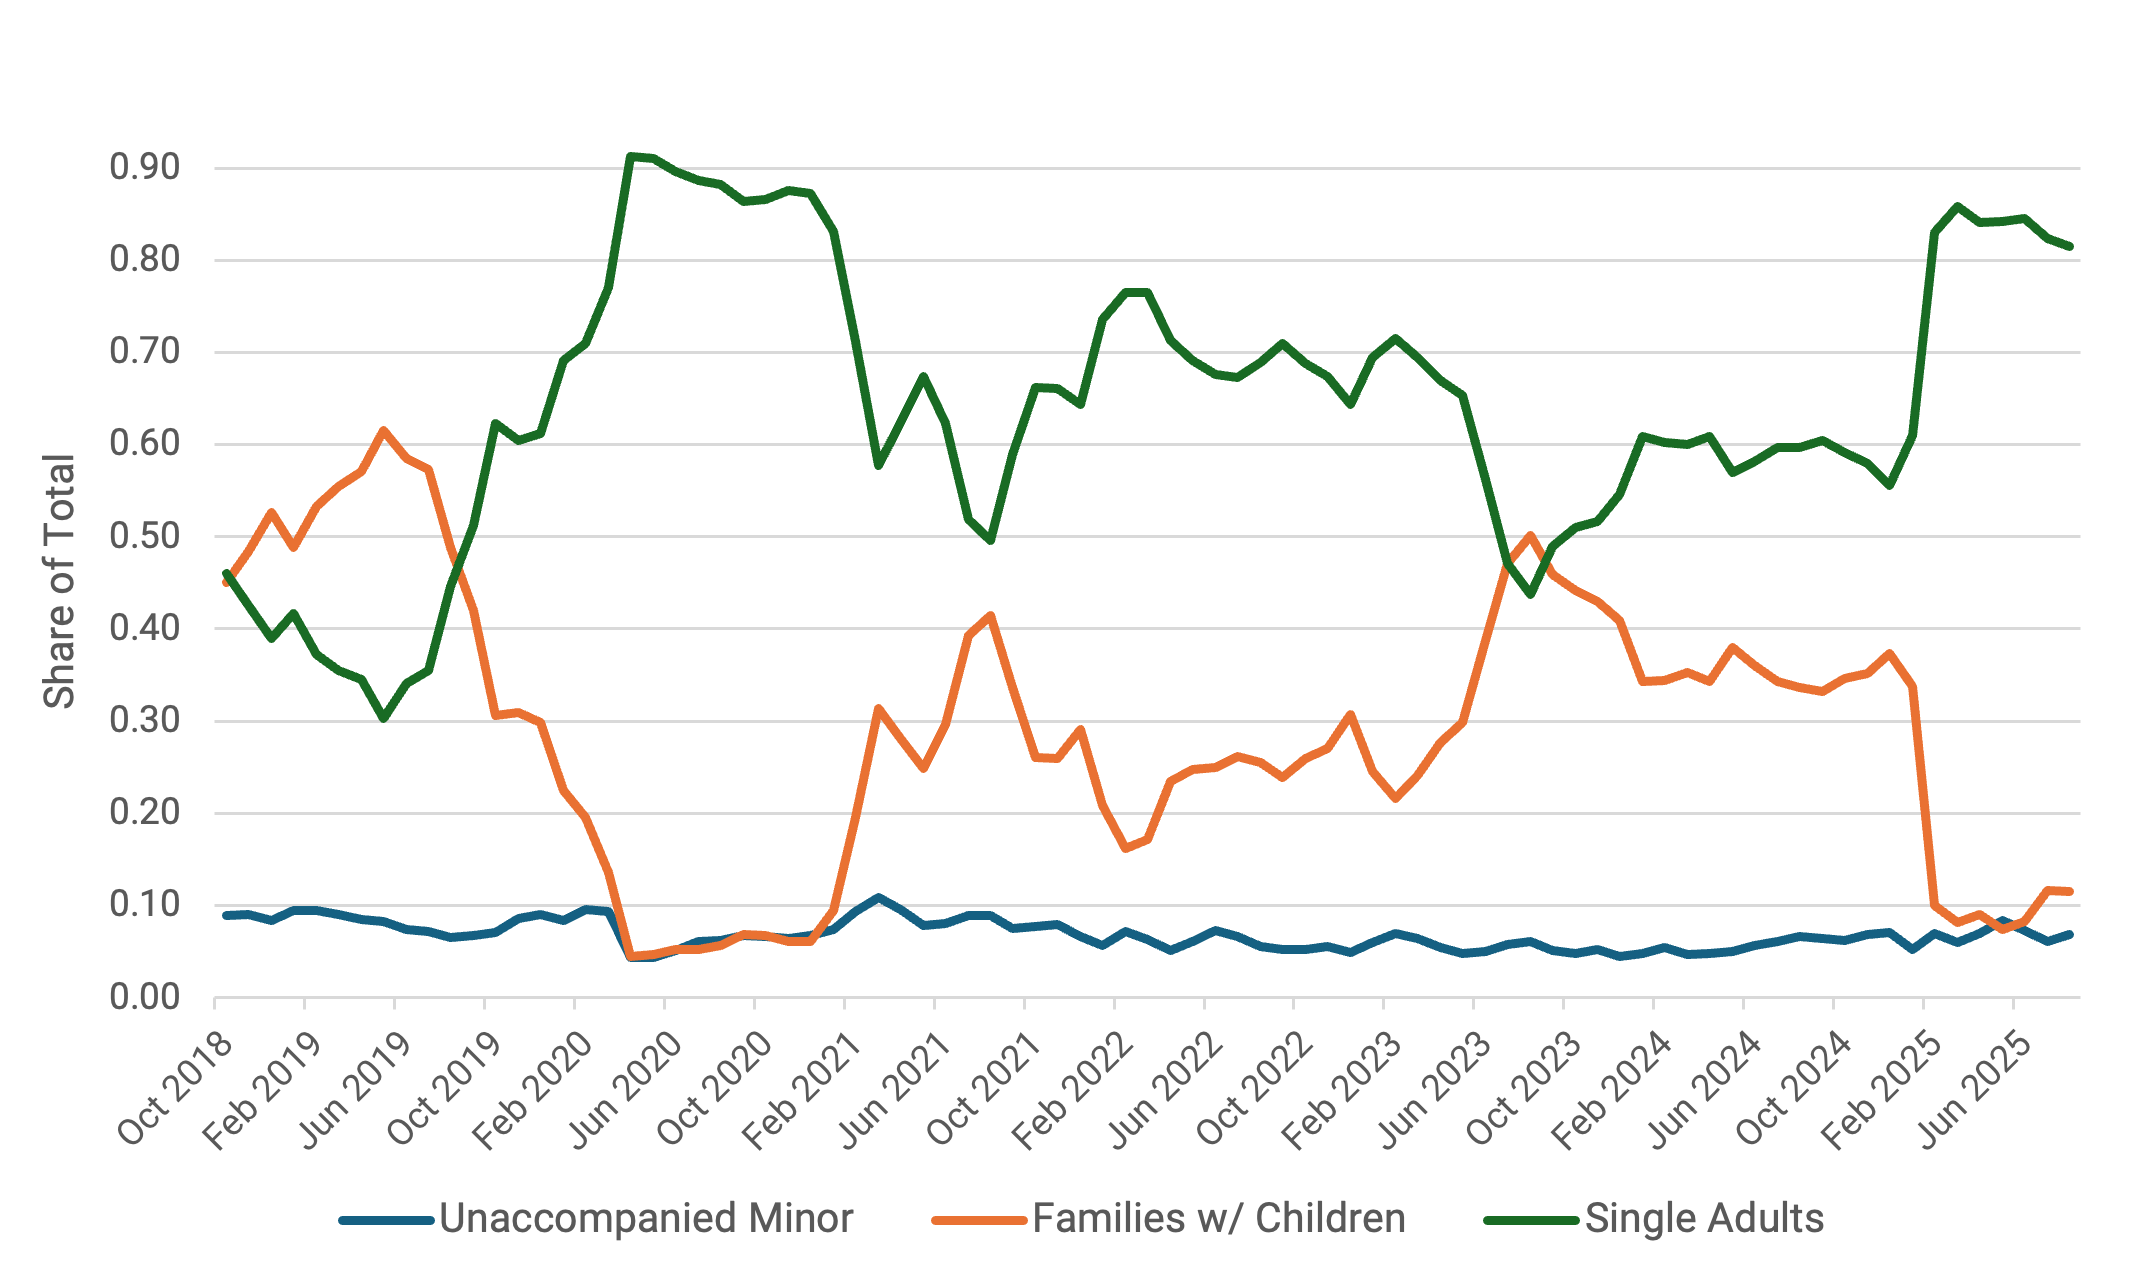
Note: The category of families with children also includes the “accompanied minors” category.
Recent Policies and Migration Trends
Several key events underlie these immigration flow and enforcement patterns in 2022 and 2023. Most notably, on April 1, 2022, the Biden administration announced that Title 42 expulsions would end by May 23, 2022. Earlier in March of that same year, federal court rulings limited the use of Title 42, restricting expulsions to countries where families would not face persecution or torture. The loosening of Title 42 may have encouraged increased border crossings in the late spring of 2022. Despite the target end date of May 2022, Title 42 did not officially end until May 2023, as courts blocked the initial order. The suspension of Title 42 likely fueled the increased border activity.
Additionally, the October 2020 introduction of and later reforms to the CBP One app may have also contributed to slower growth in the category of “Inadmissibles.” The CBP One app provided a means for asylum seekers to schedule appointments at ports of entry in advance, and in 2023, it became the primary method of doing so. During the Biden administration, caps imposed on the number of appointments considerably decreased individuals’ arrivals at ports of entry. Currently, the CBO One app is no longer in use to process asylum seekers under the Trump administration.
Apart from U.S. border policy, the COVID-19 pandemic caused widespread economic disruption, particularly in South and Central America, where already stagnating economies generated further migratory pressures. Since 2015, the economic crisis in Venezuela also produced millions of emigrants, with most resettling in neighboring nations, but with many others continuing north through Mexico to the U.S. border. In addition, the significant immigration inflows in 2022–23 may also have been driven by the strong U.S. labor-market rebound as the nation emerged from the COVID-19 pandemic.
At the U.S.-Mexico border, the large rise in SBO encounters markedly slowed beginning in January 2024, as the Mexican government began addressing the growing numbers of migrants situated near the border by taking measures such as busing migrants further south. These actions likely stemmed from then-U.S. Secretary of State Antony Blinken’s visit to Mexico, where he pressed the government for greater involvement in managing recent migration inflows. Additionally, President Joe Biden implemented a June 2024 proclamation that suspended asylum claims and greatly limited entries at the U.S.-Mexico border. Consequently, this action significantly curtailed border crossings, resulting in encounters only numbering in the 100,000 range through late 2024 (Figure 1).
Despite the notable decrease in encounters throughout late 2024, then-presidential candidate Donald Trump heavily centered his campaign on the increase in migration inflows years earlier. Once in office in early 2025, the Trump administration became considerably more stringent with border entry, enacting an executive order in January 2025 that effectively halted entry via the southern border. As of the writing of this brief, the Trump administration continues to pursue an aggressive immigration enforcement agenda through Immigration and Customs Enforcement (ICE) detentions and deportations, revocation of visas, suspension of immigration processing for various nations, and threats to strip citizenship from naturalized immigrants.
American Community Surveys Data
SBO encounters data provides a useful picture of what occurs at the border, documenting trends and changes in border crossings and CBP activity, while also capturing impacts of U.S. immigration policies. However, SBO encounter data do not cover the demographic details of immigrants who were eventually allowed into the U.S. and settled across the country. A highly important and relevant series of question, then, is:
- How many immigrants have settled in the U.S. in recent years?
- Where have they mainly settled?
- What are their educational backgrounds?
- What are their primary occupations?
In this section, data from the 2015–23 American Community Surveys (ACS) are analyzed to shed light on the number of recent immigrants in the U.S. ACS data also elucidate the composition of recent arrivals in terms of demographics, education, and labor market integration. While the brief aims to specifically focus on the post-2020 inflow of immigrants from the southern border, descriptive statistics of those who eventually settled in the U.S. are also provided to understand their demographic backgrounds, education status, and occupations.
Accurately capturing recent inflows of immigrants via the southern border is fundamentally difficult in any household or labor market survey. This analysis relies on the ACS microdata from their Integrated Public Use Microdata Series (IPUMS), which provides representative 1% samples — equating to approximately 3.5 million individuals — of the U.S. population.
Several limitations to the ACS are worth highlighting. Similar to most nationally representative household surveys in the U.S., the ACS does not specifically ask individuals how they entered the U.S., whether they arrived by crossing the southwest border, or whether they are seeking asylum. Additionally, precisely gathering information on this population via surveys may be challenging due to possibly greater rates of nonresponse.
Furthermore, the ACS specifically samples households and surveys current residents, which is defined as persons with continuous residence at the household for greater than two months. Although the survey is administered throughout the year, the survey does not cover new residents of households, which may lead to a lack of coverage of immigrants who arrived very recently. Nonetheless, the ACS surveys provide the largest representative sample of U.S. households through 2023 with information covering demographics, education, and work outcomes of recent immigrants.
For the ACS, recent immigrants are considered foreign-born, noncitizen individuals with a reported year of arrival that is two years or fewer relative to the survey year. For example, recent immigrants in the 2023 ACS would be those reporting having arrived in the U.S. between 2021 and 2023, and in the 2022 ACS, recent immigrants would be those having arrived between 2020 and 2022, and so forth. This provides a proxy measure of the stock of recently arrived immigrants in every ACS year between 2015 and 2023. Nationally representative survey weights — or PERWT, which refers to how many individuals in the U.S. population are represented by a given individual in an IPUMS sample — are then used to construct all statistics on this sample.
Number of Recent Immigrants by Country
Figure 5 shows the total number of recent immigrants document through the ACS from 2015 to 2023. To better capture the inflows of immigrants from the southwest border, the figure also displays separate totals of individuals from South and Central American nations, including the West Indies, and individuals from all other regions. South and Central American immigrants are a rough proxy for migrants crossing through the southern border. Although many of the immigrants crossing via the U.S. southern border hailed from South and Central America, recent reporting highlighted cases of asylum seekers from China that also crossed via the southern border. Furthermore, South and Central American immigration invariably includes individuals that entered the U.S. through other means, such as work or student visas. Nonetheless, since the ACS does not ask about how individuals entered the U.S., the brief proceeds with this proxy.
Figure 5 — Number of Recent Immigrants in the American Community Surveys (ACS) by Country, 2015–23

Note: Recent immigrants are defined as noncitizens that arrived no greater than two years from the survey year. Separate totals are provided for South and Central American countries, including the West Indies, and all other regions.
Recent immigration hovered between 3 to 4 million in the years preceding the COVID-19 pandemic from 2015 to 2019. Also, importantly, recent migration appeared to have been on a downward trajectory since 2017, which then decreased further during the height of the COVID-19 pandemic from 2020 to 2021. This downward trend reversed in 2022, and the number of recent immigrants grew by 1.8 million by 2023, resulting in an increase of 2.7 million in 2021 to 4.5 million in 2023.
Disaggregating by region shows that 62% of this 1.8 million increase in recent immigration between 2021 and 2023 was largely comprised of individuals from South and Central American nations. More specifically, South and Central American immigration grew from 1,229,659 in 2021 to 2,384,989 in 2023: a net change of 1,155,330, which equals 62% of the total change in recent immigrants of 1,842,680 from 2021 to 2023. Hence, despite the potential measurement error, these data are consistent with the notion that asylum seekers from the southern border comprised a significant majority of the growth in total immigration. Immigrants from all other regions also exhibited growth, although to a lesser degree, during the period following the height of the COVID-19 pandemic.
Across the countries of origins analyzed, large-scale increases in immigration occurred in several South and Central American nations, somewhat similar to the patterns seen in CBP border encounters. Figure 6 reveals large increases in recent immigrants from Mexico, Cuba, Venezuela, and Colombia. The number of recent immigrants reached 200,000 or more in each of these four countries by 2023. Mexico saw the largest increase from 2020 to 2023, with recent immigrants growing by 270,000 — from 335,000 in 2020 to over 600,000 in 2023. Cuba also experienced significant growth, with recent immigration rising by about 200,000 over the same period. Venezuela and Colombia each saw recent immigration inflows between 130,000 and 140,000, with their increases appearing later in 2022 and 2023.
Other Central and South American as well as Caribbean nations saw significant inflows of migrants in the United States, including individuals from Honduras, Guatemala, Nicaragua, Ecuador, Brazil, Peru, and Haiti, with increases in recent immigrants ranging between 40,000 and 80,000 from 2020 to 2023. El Salvador, despite having historically larger numbers of recent immigrants, saw the smallest increase between 2020 and 2023 of around 23,000. This may reflect the Bukele government’s claim of improved safety under intensified security operations against gang violence, although its “state of exception” approach has raised concerns. While not all recent immigrants from these nations were asylum seekers who crossed through the southern border, many of these individuals were, which is consistent with the patterns across the large-scale increase in crossings and encounters along the U.S.-Mexico border from South and Central American nations.
Figure 6 — Number of Recent Immigrants in the ACS by South and Central American Countries With Largest Inflows, 2015–23

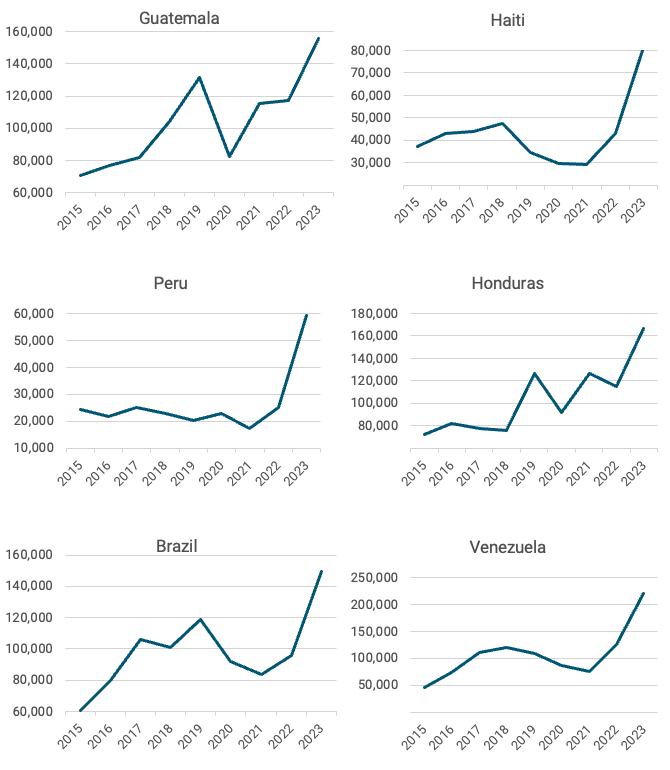
Note: Recent immigrants are defined as noncitizens who arrived no greater than two years from the survey year. Countries shown are 12 South and Central American nations exhibiting significant growth after 2020.
Settlement Locations of Recent Immigrants
Where did recent immigrants primarily settle in the U.S.? To address this question, this brief examines the growth in the number of recent immigrants by metropolitan statistical area (MSA) from ACS data. To assess cities and locales receiving large absolute numbers of recent immigrants, Figure 7 plots trends in recent immigration for the top nine MSAs according to their net change in recent immigrants from 2021 to 2023.
New York City and its surrounding areas led the nation with an increase of nearly 200,000 recent immigrants from 2021 to 2023. Miami also experienced significant growth in recent immigration of around 150,000. Although traditionally a popular destination for immigrants, Los Angeles appears to have experienced lesser growth, around one fourth of New York City’s numbers. Cities physically more proximate to the U.S.-Mexico border, such as Houston and Dallas, saw sizable growth between 80,000–90,000. The MSAs of Chicago, Washington, D.C., Boston, and Atlanta also experienced significant growth. These trends are typically expected, as large cities, major metropolitan areas, and states that customarily welcome migrants tend to be receive the majority of this population, with fewer immigrants settling in smaller cities.
Figure 7 — Trends in Recent Immigrants by Metropolitan Statistical Area (MSA), 2015–23
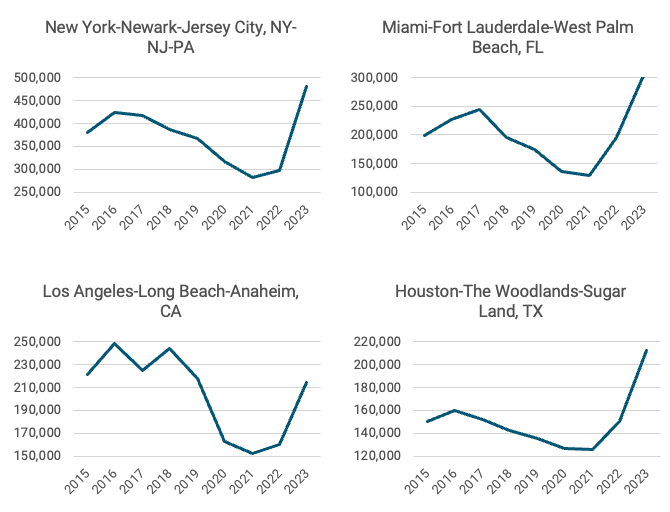
Note: The figure displays the top nine MSAs according to their change in recent immigrants from 2021 to 2023. Recent immigrants are defined as noncitizens that arrived no greater than two years from the survey year.
The substantial growth in these destinations may likely have been due to several factors. As new immigrants tend to settle in locations with large existing immigrant communities, the recent influx may have similarly settled in these large, well-known immigrant destinations. Additionally, in response to the April 2022 announcement of the end of Title 42, Texas Governor Greg Abbott enacted a busing policy to send migrants apprehended in border towns to select cities, including New York City, Chicago, Washington, D.C., Los Angeles, Philadelphia, and Denver. Further, migrants may have been attracted to specific destinations with job opportunities and welcoming immigration policies.
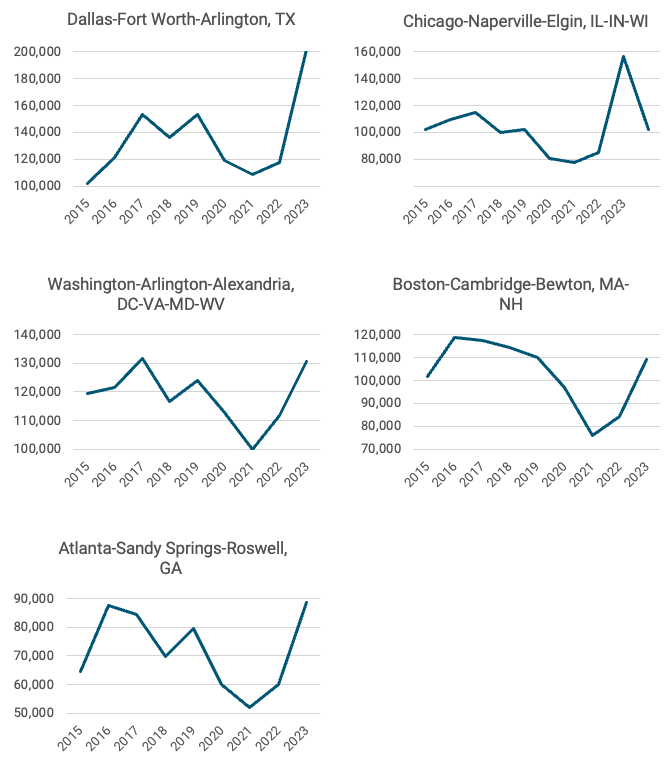
While Figure 7 provides a sense of the magnitude of immigration in terms of absolute numbers, the size of immigration relative to the receiving MSAs population is an important factor to examine. Table 1 ranks the top 50 MSAs in terms of the change in recent immigrants from 2021 to 2023 as a percentage of each MSA’s population in 2021. The recent immigration population settling in these MSAs represented, at most, a 2–3% increase. In fact, most of the MSAs experiencing large percentage increases had relatively smaller inflows in terms of absolute size. With the exception of Miami, the MSAs experiencing large absolute growth, as presented in Figure 7, did not experience large changes relative to population size. Houston, Dallas, New York City, and Chicago saw increases between 0.8–1.2% of the initial population. Miami stands apart as the lone city experiencing both large absolute numbers and the largest percentage increase among all MSAs.
Table 1 — Top 50 MSAs by Change in Recent Immigration as Percentage of Population, 2021–23
Demographics of Recent Immigrants
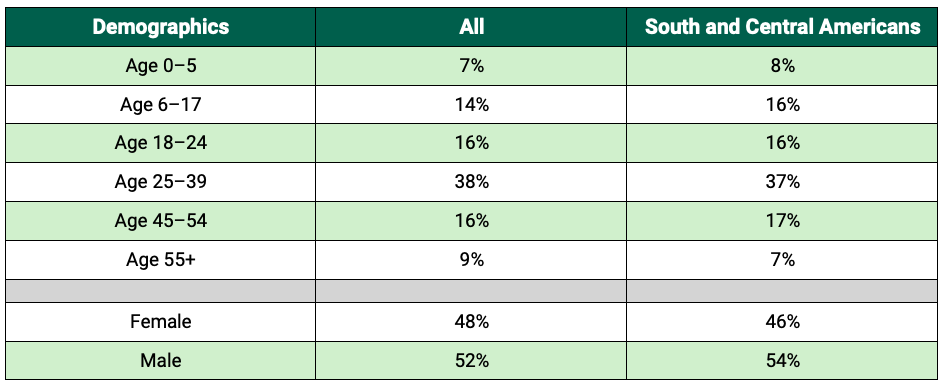
Who are the recent immigrants, in terms of their demographic background, education status, labor market attachment, and work outcomes? Table 2 provides descriptive statistics to detail several characteristics of recent immigrant population, provided by 2023 ACS data for immigrants who reported their arrival in the U.S. between 2021 and 2023. Table 2 displays these statistics for all recent immigrants and for South and Central Americans, many of whom represent asylum seekers who entered the U.S. through the southern border.
In terms of distribution across ages, around 24% of entering immigrants were minors, meaning these individuals were younger than 18 years old. Young adults aged 18–24 and also middle- and late-career adults aged 45–54 comprised significant portions — each around 16% — of recent immigrant populations. The most sizable group was early-career adults aged 25–39, equating to approximately 38% of all recent immigrants. Finally, a smaller share were older adults aged 55 and above. Recent immigrants also tended to be slightly more male.
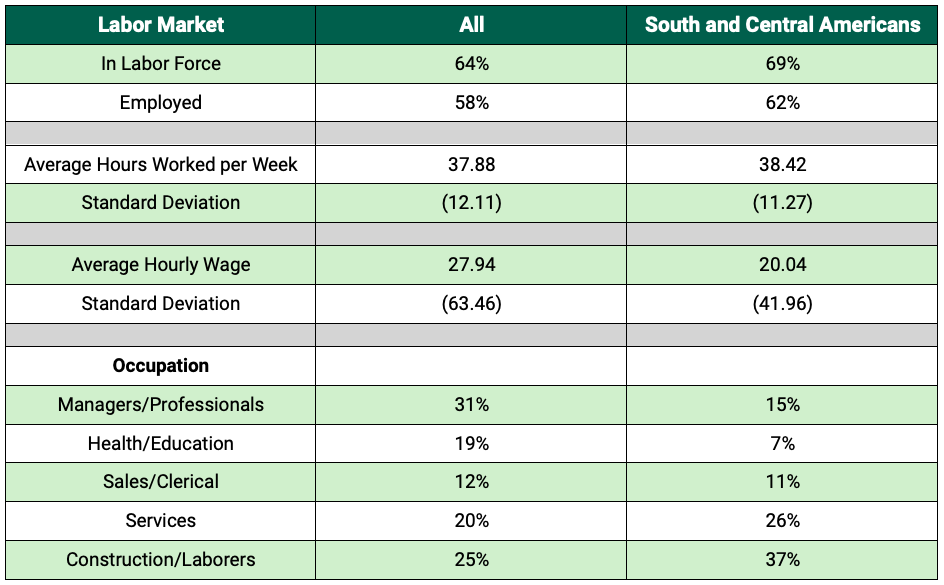
Table 2 — Characteristics of Recent Immigrants in the 2023 ACS
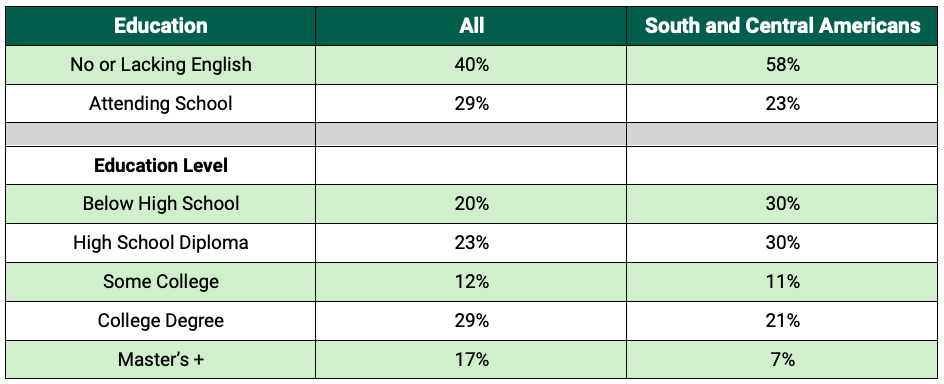
In terms of language ability, 40% of recent immigrants report not speaking English or lacking in their ability to speak English. However, nearly 60% of immigrants from South and Central American nations report not being able to or having limited ability to speak English. School attendance and educational attainment exhibit similar differences. While 29% of recent immigrant adults report attending school, only 23% of South and Central Americans are enrolled in schooling. Recent immigrants from South and Central America are also much less likely to have college or graduate degrees, and much more highly represented among individuals with a high school degree or less.
Labor market attachment is higher for South and Central Americans than for all recent immigrants. Almost 70% of South and Central Americans report being in the labor force, and 62% are employed despite only have been in the U.S. for two years or less. Employed individuals average roughly 38 hours of work per week, which roughly corresponds to full-time employment. Based on 2023 rates, hourly wages for recent immigrants average $28 compared to only $20 for South and Central Americans, possibly reflecting their lower educational attainment and English language fluency. Across occupations, South and Central Americans are much more highly represented among services, construction, and agricultural jobs.
Conclusion
The large post-2020 increase in immigration represents one of the most significant demographic shifts in recent U.S. history. This analysis documents both the scale and composition of this recent influx using official encounters data from CBP and nationally representative survey evidence from the ACS. Together, these sources show that the immigration episode, which spanned from 2020 to 2024 with significant increases after April 2022 and also in 2023, was primarily driven by asylum seekers from South and Central America, with new arrivals largely composed of families with young children.
At the same time, ACS data reveal that many of these new immigrants have already entered the labor market and are contributing to local economies, particularly in major metropolitan areas such as New York, Miami, Houston, and Dallas. Yet relative to population size, the concentration of recent immigrant arrivals appears greater outside of major metropolitan areas, marking a 2–3% population increase in smaller areas and likely placing new demands on housing, schools, and social-service systems.
Looking forward, more systematic data collection linking border activity, legal status, and settlement patterns is essential for understanding both the short- and long-run impacts created by this migration episode. Better clarification on the number and demographics of immigrants is also crucial to address questions about the population’s impacts on receiving communities, fiscal budgets, housing, education systems, and labor markets.
This publication was produced by Rice University’s Baker Institute for Public Policy. Wherever feasible, the material was reviewed by outside experts prior to release. Any errors or omissions are solely the responsibility of the author(s).
This material may be quoted or reproduced without prior permission, provided appropriate credit is given to the author(s) and Rice University’s Baker Institute for Public Policy. The views expressed herein are those of the individual author(s) and do not necessarily represent the views of Rice University’s Baker Institute for Public Policy.


