
Overview
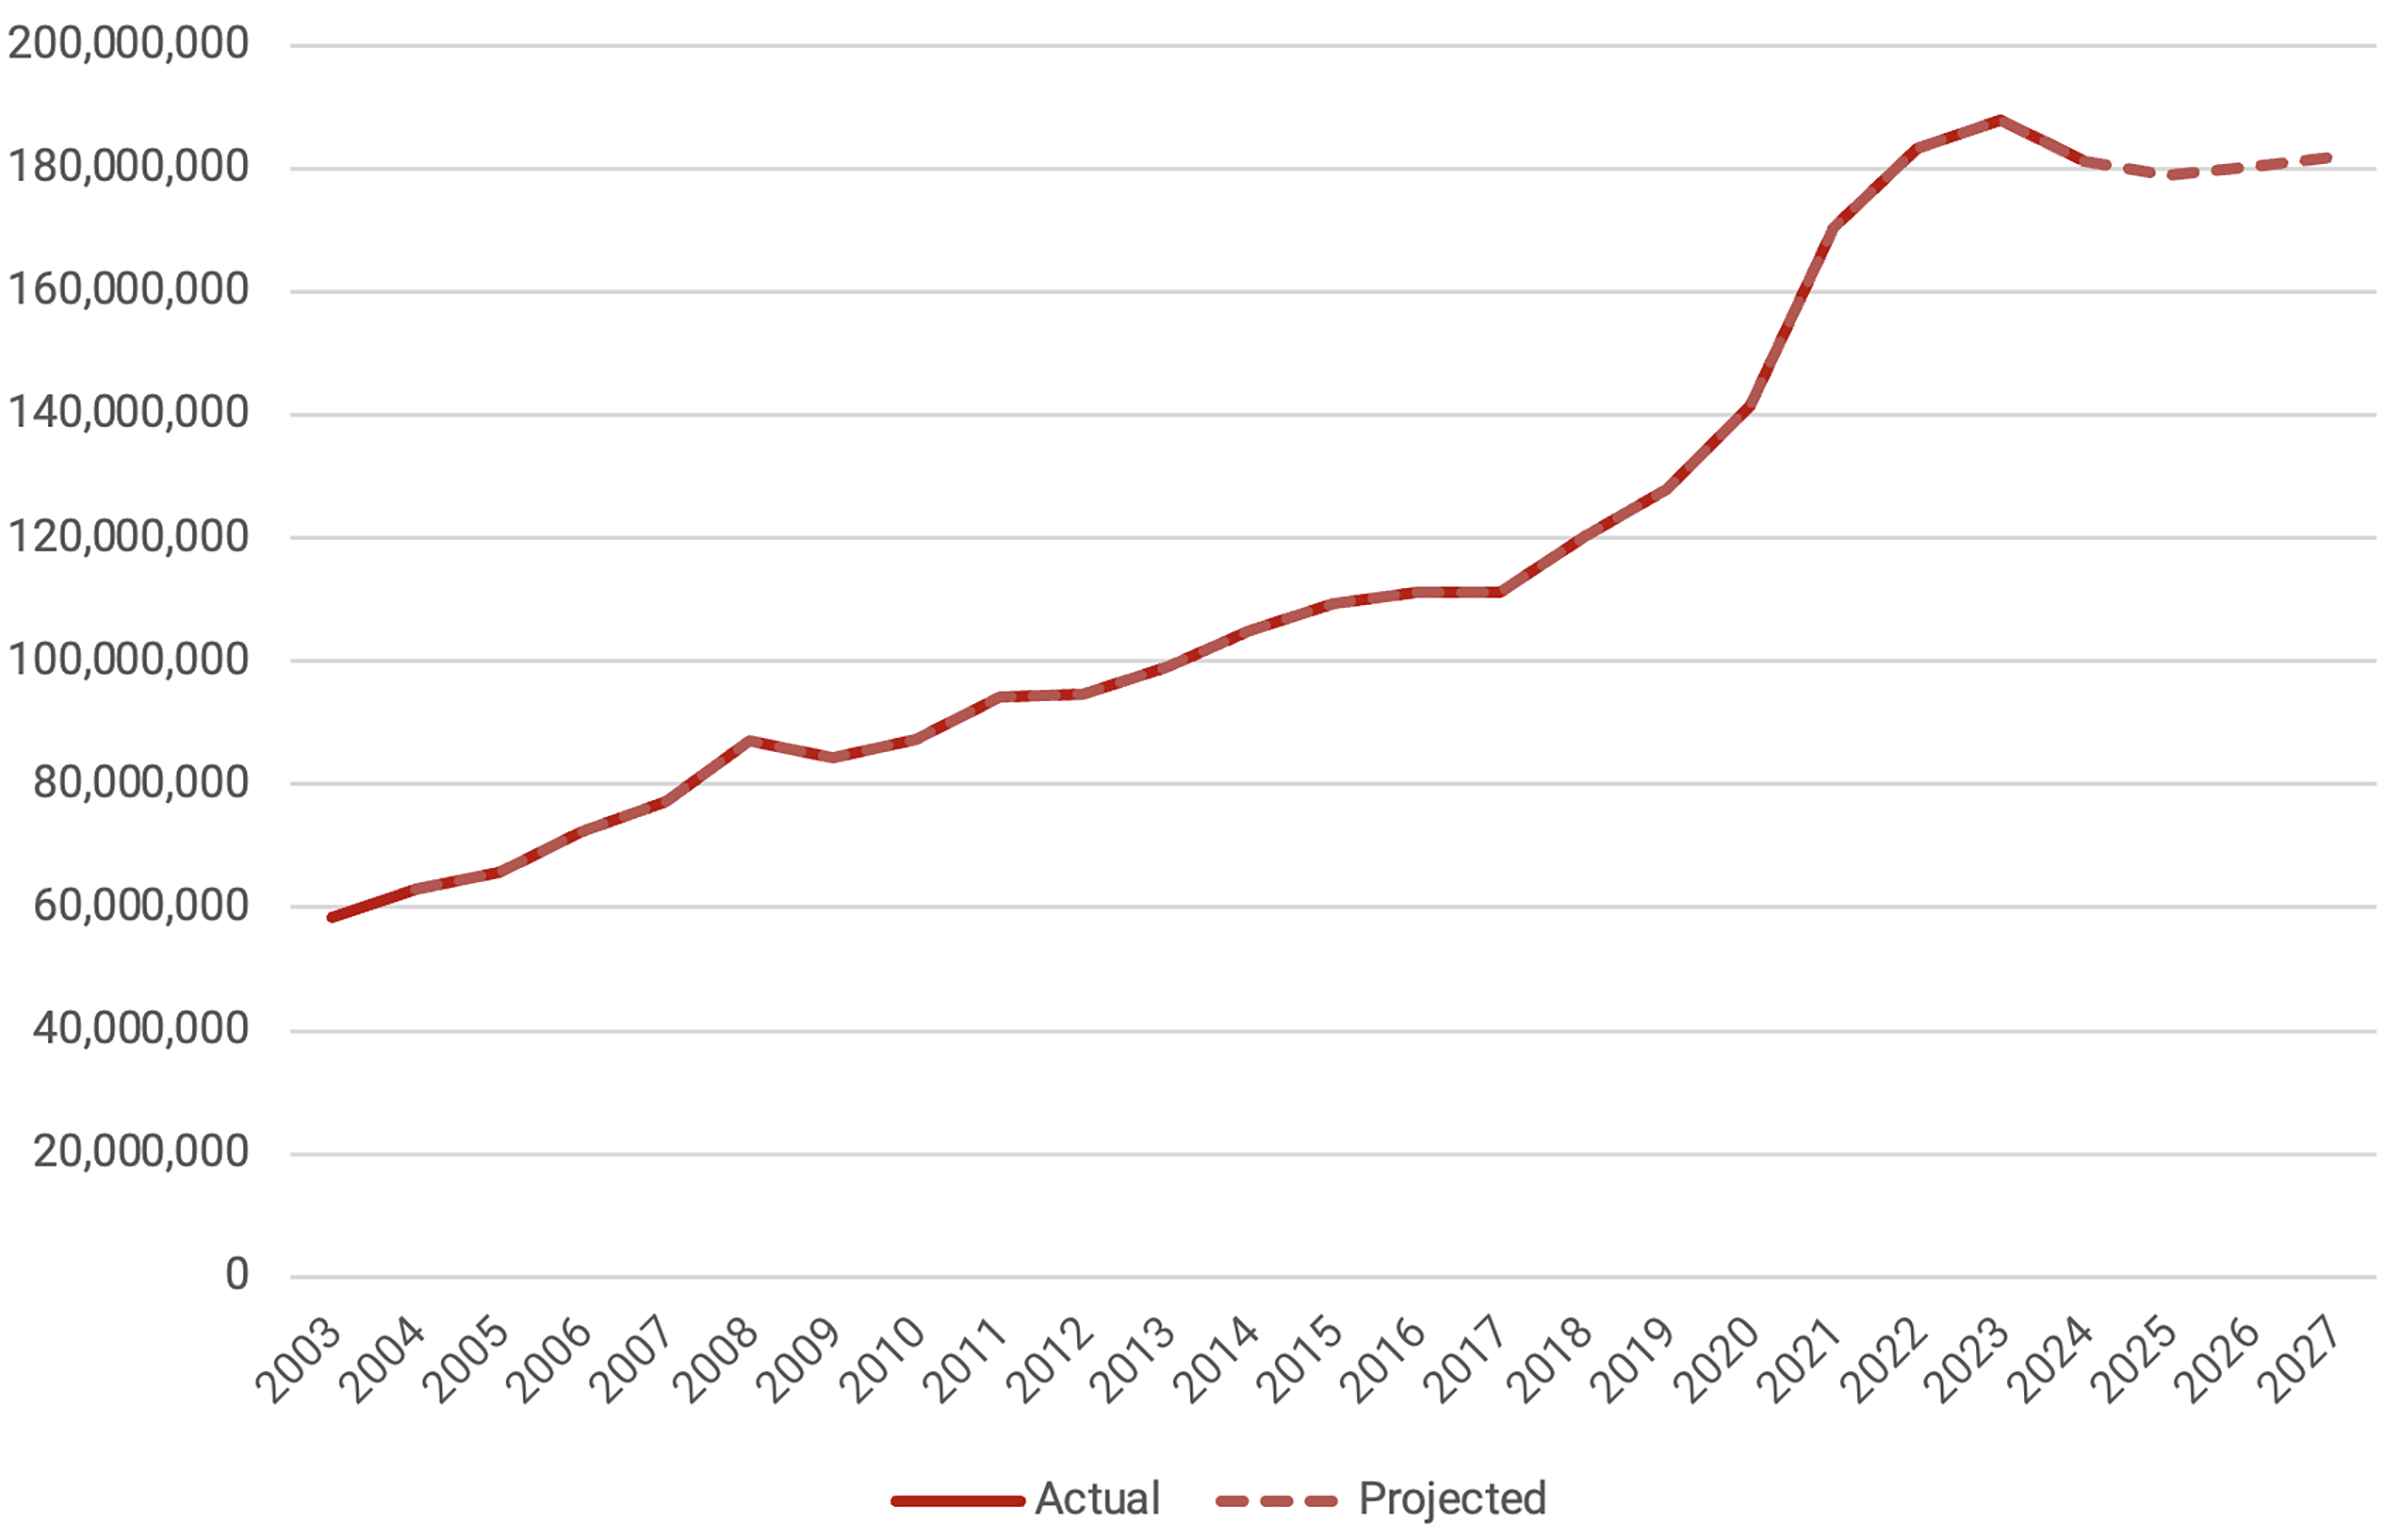
Over the last two decades, Texas has experienced robust revenue growth. From 2003 to 2022, revenue grew at an average annual rate of 6.1%. However, in 2023, that growth slowed to just 2% and then declined by 4% in 2024. This was the first decline in the state’s revenues since 2009, on the heels of the Great Recession. Through the first nine months of FY 2025, revenues have grown by just 2.56%, and the Texas Comptroller of Public Accounts’ forecasts project minimal growth through 2027 (Figure 1).
Figure 1 — Texas Total Revenue, 2003–27 ($000)
Federal Transfer Payments
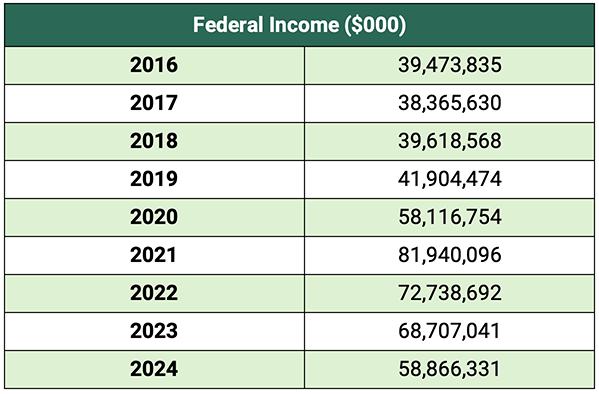
Transfer payments from the federal government represent the state’s largest source of income, historically accounting for 30–40% of the state’s total revenue (Table 1). These payments are allocated to a myriad of programs, the largest of which are dedicated to supporting Medicaid and highway construction.
During the COVID-19 pandemic, the federal government significantly increased payments to state and local governments. The Texas Legislative Budget Board estimated that, through February 2025, Texas had received $85 billion in COVID-related funds. As a result, federal transfer payments accounted for 48% of the state’s revenue in 2021.
Since the 2021 peak, federal payments have decline by 27%, sharply affecting state revenue trends. In 2024 alone, federal payments dropped by nearly $10 billion. Without that decline, total revenue would have increased by 1.6%. The sharp increases in Texas’ revenue growth rates during 2020 and 2021, followed by subsequent declines, are directly related to the fluctuations in federal transfer payments.
Table 1 — Federal Transfer Payments to Texas, 2016–24
The comptroller’s current estimate — see Biennial Revenue Estimate (BRE), 2026–27, Table A-5 — is that federal payments will decline by 1–2% over the next biennium (FY 2026–27). That would still be well above pre-pandemic levels. Year-to-date receipts from the federal government are down by 3%. Given the current political climate and the federal government’s burgeoning debt, a continuation of federal transfer payments at the level estimated by the comptroller could prove optimistic.
Sales Taxes
Sales taxes are Texas’ second-largest source of revenue, historically accounting for approximately one-quarter of the state’s income (Figure 2). From 2003 to 2019, sales tax receipts grew steadily, by an average of 5.7%. From 2020–2022, however, they varied widely due to the pandemic, initially showing no growth in 2020, followed by a recovery in 2021 with a 5.6% increase from the previous year, and then surging by 19.3% in 2022.
In 2023, the growth in sales tax receipts returned to slightly above the historical norm, registering a 8.4% increase. However, they remained essentially flat in 2024 (+1.2%). Through the first nine months of the current fiscal year, sales tax receipts are up 3.68%, below the historical average.
Sales taxes fluctuate in response to national and regional economic conditions, as well as occasional exogenous events, such as a pandemic. Another significant shift occurred with the U.S. Supreme Court’s 2018 decision requiring online merchants to collect state and local sales taxes on remote sales and remit them to the jurisdictions where their customers reside.
Because this legal ruling came shortly before the onset of the pandemic — and the significant fluctuations in sales tax revenues that followed — it is difficult to quantify the extent to which this change may have contributed to increased receipts. It is possible that the collections immediately following the decision may include a one-time increase in the level of sales taxes collected.
Inflation, income growth, and population changes are key drivers of sales tax revenue growth. Adjusted for inflation, Texas’ sales tax growth over the past two decades appears more modest. While nominal revenues grew at an average annual rate of 6.0%, real growth was only 3.5%. In other words, although the dollar value of sales tax revenues more than tripled, their actual purchasing power only doubled.
Figure 2 — Texas Sales Tax Collections, 2003–24 ($000): Nominal vs. Inflation Adjusted
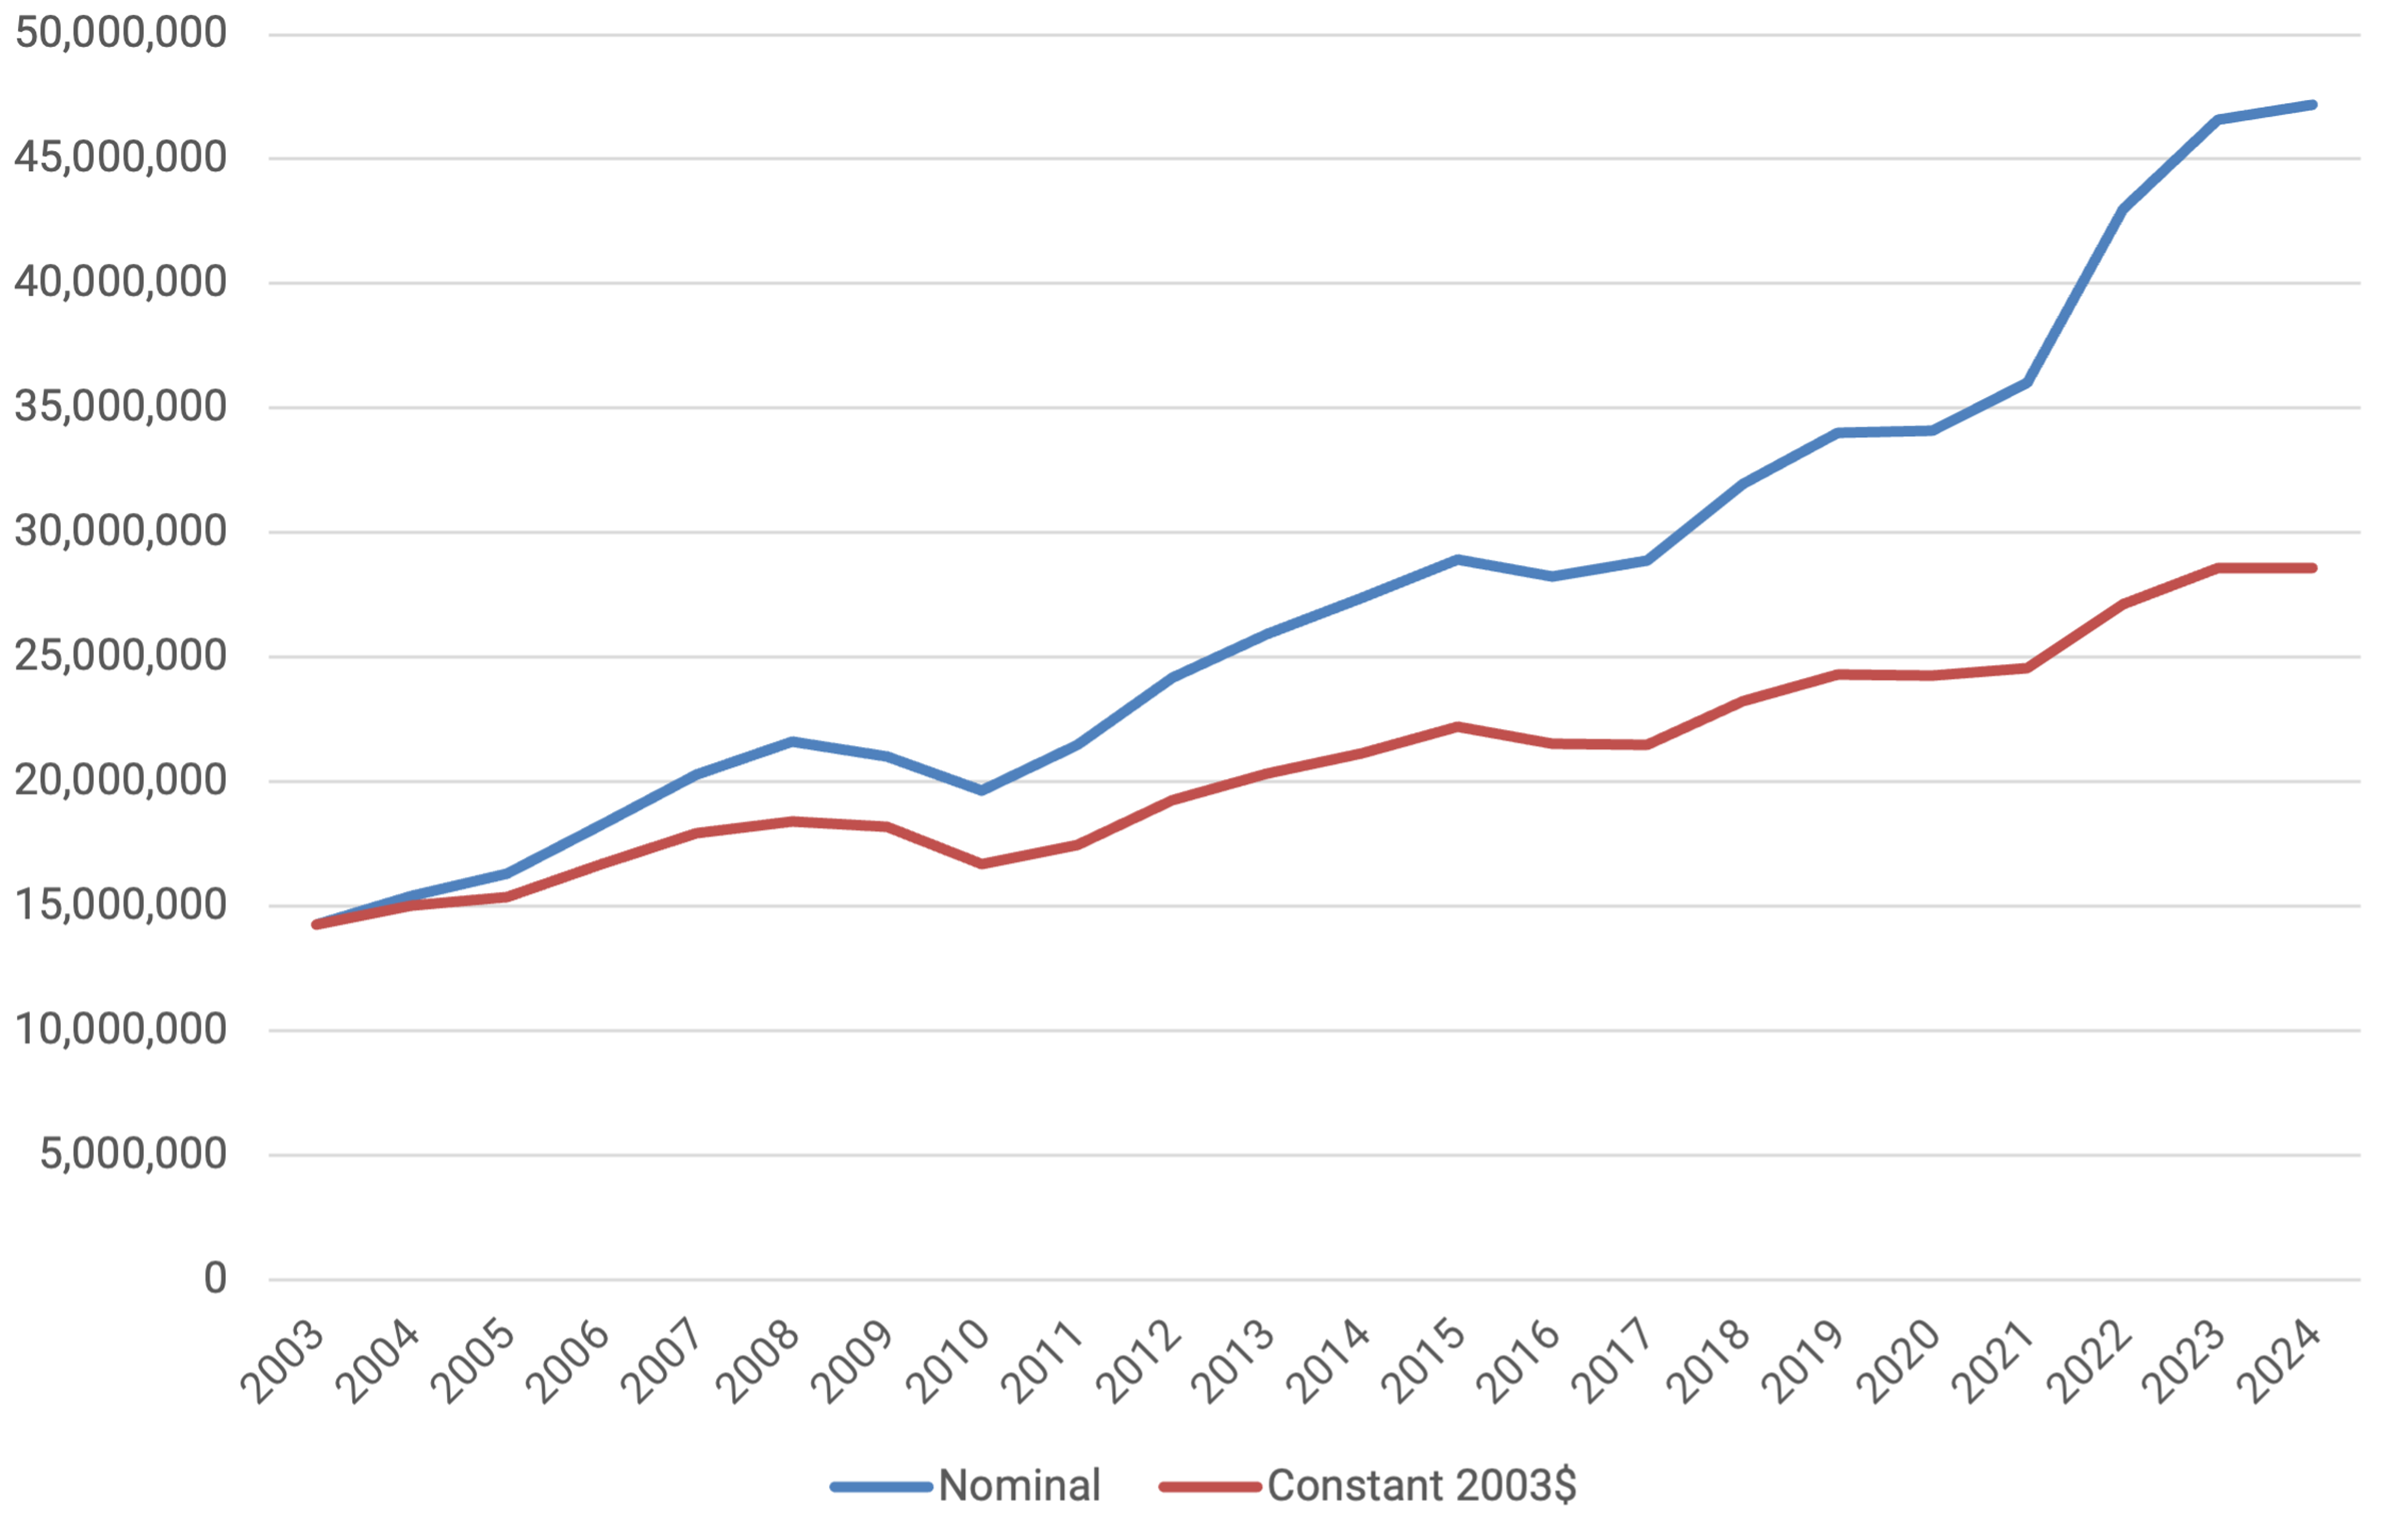
Typically, changes in sales tax revenues and population are expected to be closely correlated. Between 2003 and 2024 in Texas, there was a positive correlation of approximately 2:1, meaning that sales tax revenue grew twice as fast as the population growth. Specifically, inflation-adjusted sales tax receipts during this period averaged a growth rate of 3.5%, outpacing the 1.6% population growth.
Many factors impact this correlation: the growth in income, income concentration, changes in the consumption patterns of the population, and various demographic factors, such as age and the proportion of the population that is recent immigrants. Further research is warranted to establish comparable data on these factors, and the magnitude of their impacts on sales tax revenue.
The Texas Demographic Center issues population projections through 2060, the most recent release being projections for 2024. Like the U.S. Census, its projections include three immigration scenarios: high, mid, and low. The mid-case estimates predict that population growth in Texas will gradually slow over the next several decades, declining to 0.6% annually by the mid-2050s, with an average growth rate of 0.9% annually over the next 35 years. (Mid-case estimates typically refer to projections or forecasts that represent a moderate or central scenario among a range of possible outcomes, given a set of realistic assumptions and conditions.) If the state’s population growth slows as projected, that will exert downward pressure on sales tax collections. For FY 2026 and FY 2027, the comptroller is estimating increases of 4.8% and 3.7%, respectively (BRE Table A-3).
Health Service Fees and Rebates
After federal transfer payments and sales taxes, the next largest revenue source for the state was categorized as state health service fees and rebates. As explained by the comptroller, this category includes “revenue from the federally mandated and state supplemental Medicaid vendor drug programs,” which “consists of rebates the state collects from drug manufacturers for drugs covered by state Medicaid programs.”
Although a detailed review of this category is beyond the scope of this brief, it is worth noting that the rebate has more than doubled since 2019, rising from $7 billion to $14 billion. More importantly, the comptroller projects a 17% decline this year (BRE Table A-16), followed by a continued but more gradual decrease over the remainder of the biennium.
Oil and Natural Gas Production Taxes
The energy sector, especially oil and natural gas production, remains the backbone of the Texas economy. Texas imposes a 4.6% tax on the value of oil and a 7.5% tax on the value of natural gas produced in the state. Combined, these two taxes generated $8.5 billion in revenue for the state in 2024, just under 5% of total revenue.
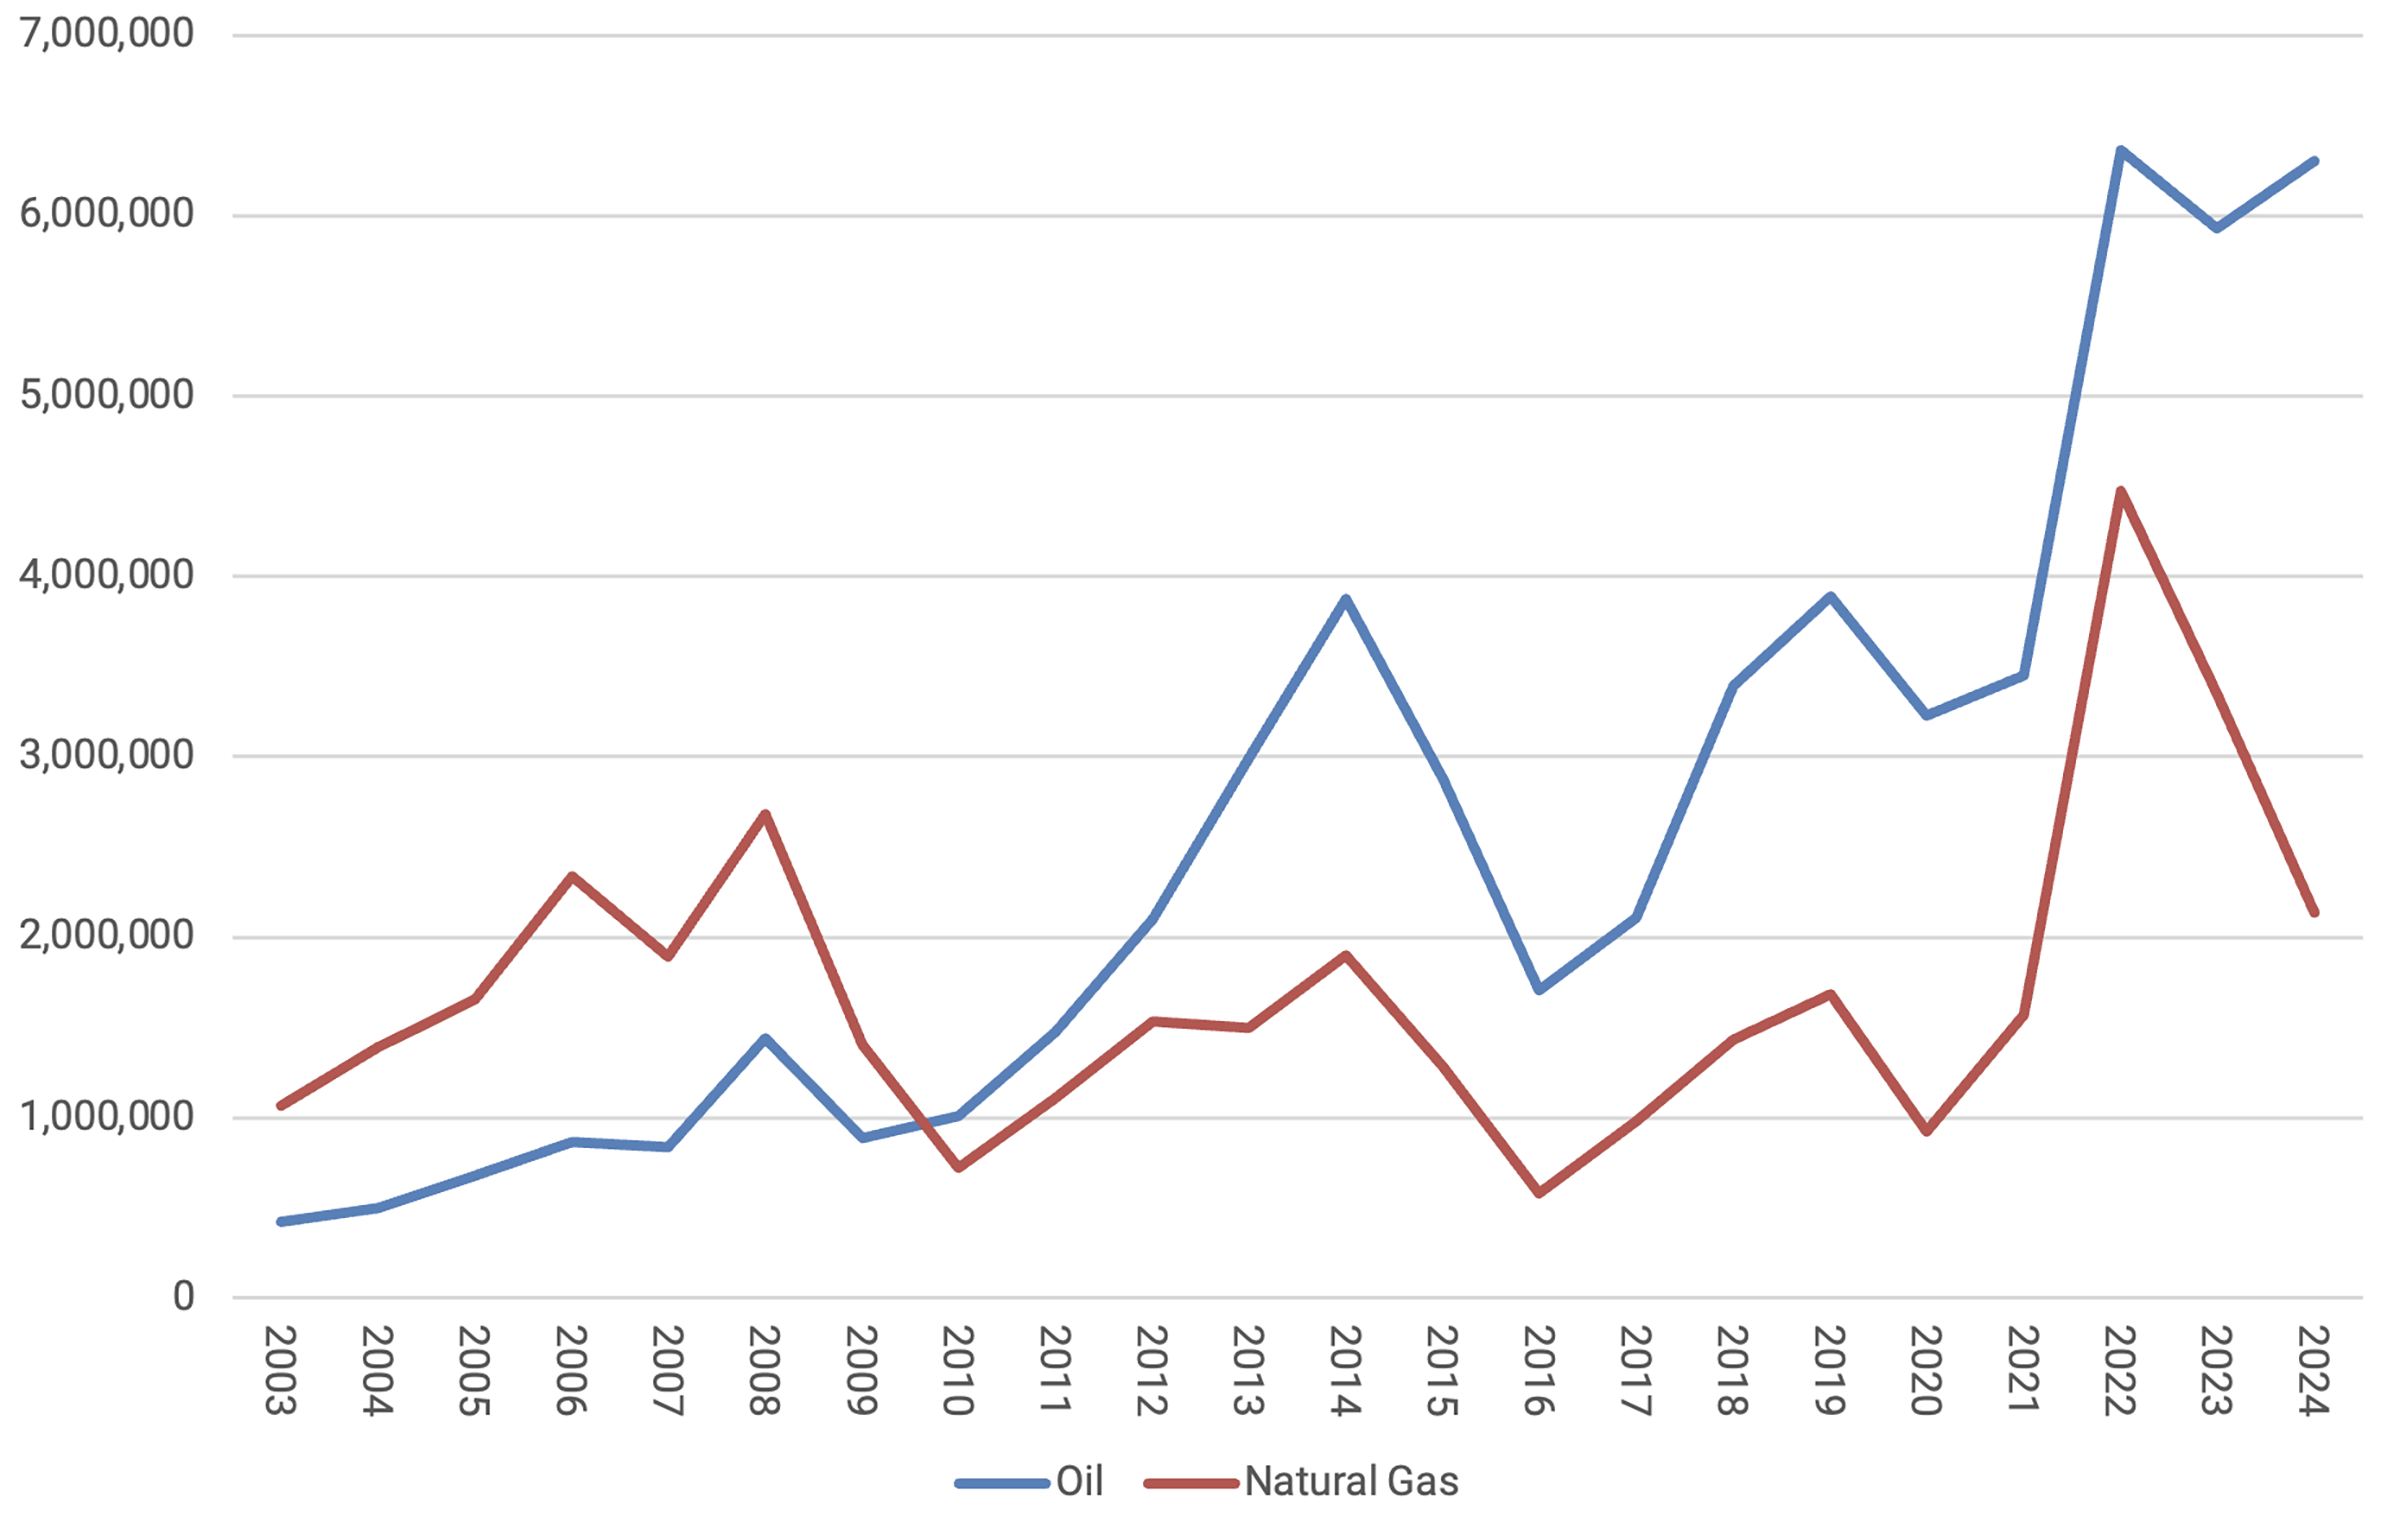
These production taxes, often referred to as severance taxes, have historically fluctuated significantly depending on the volume of oil and natural gas extracted and their respective market prices. Since the widespread adoption of fracking technology and the resulting increases in production, Texas’ oil production tax has increased sixfold since 2010.
Natural gas production in the U.S. has also increased steadily over the last two decades, driven by advances in hydraulic fracturing. In more recent years, though, its growth has been less dramatic than that of oil, due to market gluts, lower prices, and infrastructure constraints. As a result, Texas’ natural gas production has shown more volatility and less growth.
Figure 3 — Oil and Natural Gas Production Tax Collections ($000)
The future of the fossil fuel industry remains uncertain. According to the U.S. Energy Information Administration’s reference case, oil production is expected to peak in 2027 at around 14 million barrels per day, then gradually decline to 11 million barrels by 2050. Under this scenario, state production tax revenues would likely remain relatively stable over the next 25 years, though without the dramatic growth seen over the past two decades.
Conclusion
Historical data and recent projections from the comptroller suggest that the period of consistent budget surpluses may be drawing to a close. This shift will likely require future legislatures to take a more deliberate approach to budgeting and revenue allocation. Nonetheless, Texas remains better positioned than many other states, owing to its relatively stable and diversified revenue base.
Note
Unless otherwise indicated, statistics are based on authors’ analysis of publicly available revenue estimate data.
Updated on Nov. 14, 2023, at 12:10 pm CST.
This publication was produced on behalf of Rice University’s Baker Institute for Public Policy. Wherever feasible, the material was reviewed by external experts prior to its release. Any errors are the responsibility of the author(s) alone.
This material may be quoted or reproduced without prior permission, provided appropriate credit is given to the author(s) and Rice University’s Baker Institute for Public Policy. The views expressed herein are those of the individual author(s) and do not necessarily represent the views of Rice University’s Baker Institute for Public Policy.


