
Introduction
Between 1999 and 2024, the annual cost of family insurance coverage for a worker rose 342% at U.S. firms. The worker’s out-of-pocket contribution to these premiums increased by 308%, far outstripping mean worker earnings, which rose by only 119% during this period.[1]
The nonprofit organization KFF surveys employers annually on the health insurance they offer to their workers.[2] Differences in premiums are reported by industry, for large and small firms, and other binary categories based on worker age, wage levels, and union status. However, the KFF survey does not reveal the identity of any employers responding to its survey, nor does it provide more detailed information on premium variability than the categories just mentioned.
This report examines variation in annual health insurance premiums, workers’ contributions, and plan generosity across Texas universities in 2025. The cost of health insurance coverage for faculty and staff factors into college tuition costs and therefore represents an important expense for taxpayers and families with children attending both public and private colleges.
Methods
Study Sample
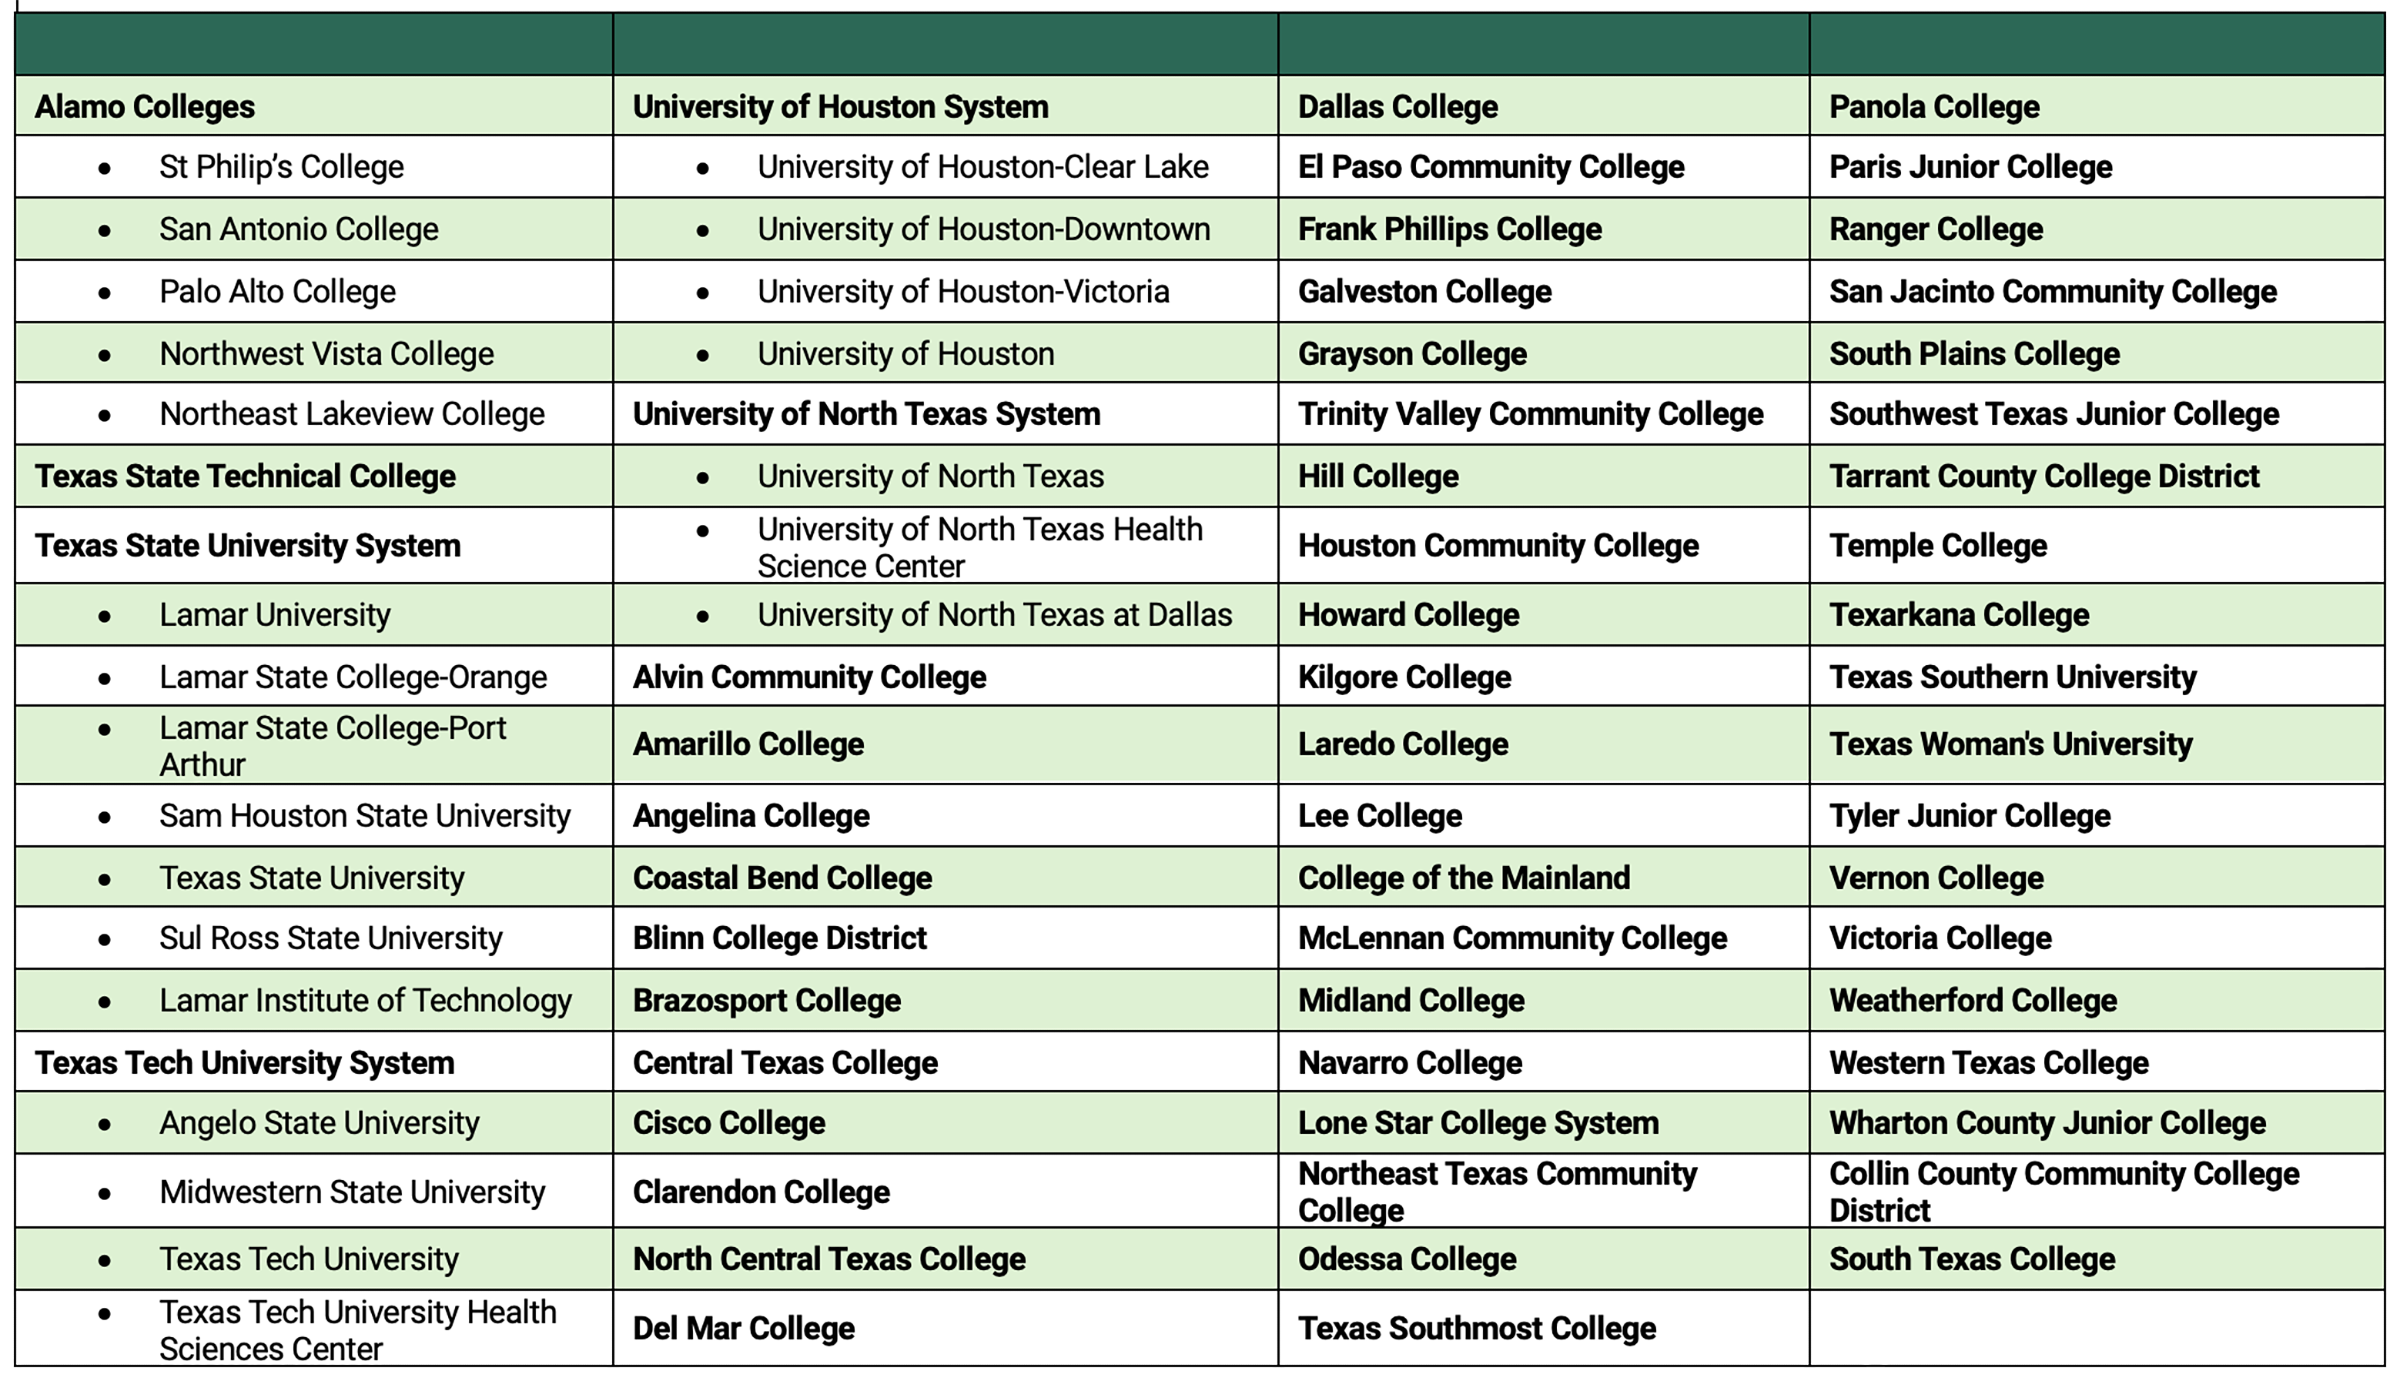
A list of Texas colleges and universities was obtained from the National Center for Education and Statistics (NCES) Integrated Post Secondary Education Data System (IPEDS) 2024 Survey of Institutional Characteristics.[3] The study sample was restricted to institutions with an enrollment of 1,000 or more students.
Health Insurance Information
The data collection process began with a systematic review of each institution’s website to collect information on the types of health coverage offered to employees (faculty and staff), the cost to the worker, the total cost to the university of each plan type (if available), and the accompanying cost sharing requirements for enrollees (e.g. deductibles, copayments, etc.)
Although it was possible to find the employees’ cost of health insurance online for most universities, there were many instances where the total cost to the employer of each plan was not reported. Where these gaps existed, Consolidated Omnibus Budget Reconciliation Act of 1985 (COBRA) rates were utilized as a primary proxy. Under federal law, COBRA gives workers and their families who lose their health benefits the right to choose to continue group health benefits for no more than 102% of the cost of the plan to the employer.[4] Where COBRA information could not be located online, each university’s Human Resources office was contacted to request the information directly. In most cases, but not all, a staff member of the HR office responded to the request for information.
Most universities create plan offerings that run from July 1 to June 30, to coincide with the hiring and departure of faculty. This report provides plan information for the 2025–26 academic year, except for Trinity University, where data is reported for 2024–25. Total premium costs and workers’ contributions were often reported per month or per pay period. In each case, data was aggregated to the annual level.
Actuarial Value
The actuarial value for each plan was computed using the Centers for Medicare and Medicaid Services (CMS) 2026 Final Actuarial Value Calculator (AV Calculator), the standardized tool that CMS requires insurers to use when certifying health insurance plans for sale on the Affordable Care Act (ACA) Marketplace.[5] The AV Calculator is publicly available and is updated by CMS on an annual basis. It was designed to provide a consistent, comparable measure of plan generosity across different plan designs by estimating the share of total allowed medical costs that a plan is expected to cover for a standard enrolled population.
The AV Calculator works by simulating how a plan’s cost-sharing parameters — including deductibles, copayments, coinsurance rates, and out-of-pocket maximums — interact with the expected healthcare utilization and expenditures of a nationally representative standard population. That standard population reflects the distribution of healthcare use and costs across a broad range of service categories, including inpatient hospital care, outpatient services, physician visits, and prescription drugs. By applying each plan’s specific cost-sharing structure to this standard population, the calculator produces a percentage representing the share of total allowed costs the plan would be expected to cover. The calculation process often involved several steps:
- The cost-sharing parameters for each plan were obtained directly from the benefits booklets published by each university. These booklets provided the specific deductible amounts, copayment levels, coinsurance rates, and out-of-pocket maximum values applicable to each plan.
- This information was entered into the CMS AV Calculator for each plan, and the resulting actuarial value was recorded.
- Where plans included multiple tiers of cost sharing — for example, different cost-sharing levels for in-network versus out-of-network services, or separate deductibles for specific service categories such as prescription drugs — each parameter was entered in accordance with the calculator’s structure.
It is important to note a limitation of this approach. The AV Calculator uses a single national standard population and does not adjust for geographic variation in the price of medical services. Because commercial healthcare prices in Texas tend to run above the national average — particularly in markets with high provider consolidation such as Houston and Dallas — the actuarial values produced by the calculator may modestly overstate the true share of costs covered by these plans for Texas enrollees. The AV estimates presented in this report are therefore best interpreted as a standardized measure of relative plan generosity across the universities studied, rather than as a precise prediction of out-of-pocket costs that any individual enrollee would experience.
Analysis
In general, universities offered at least two plans, with one being noticeably less expensive than the other in terms of both the amount of the employee contribution and total costs. Because a PPO (Preferred Provider Organization) plan was the most common plan type offered across universities, this analysis is focused on comparing the cost of employer-only PPO plans across institutions. For universities that do not offer a PPO plan, the costs of a POS (Point of Service) plan are substituted, as it is closest in features. See the “Key to Basic Health Insurance Terms” section — before the Appendix — for brief descriptions of common health insurance models, categorized by how they manage provider networks and costs.
The University of Texas (UT) system and the Texas A&M University system consist of multiple universities and other institutions, and they each rely on a central office to determine benefits and plan design, which are the same across all campuses. Most of the remaining state-supported colleges and universities receive health insurance coverage through the Employees Retirement System of Texas (ERS), which manages benefits for employees and retirees of State of Texas agencies. Because the core plan structure operates identically across all campuses in the same system, it is possible to report health insurance costs at the system level.
Results
PPO/POS Plans
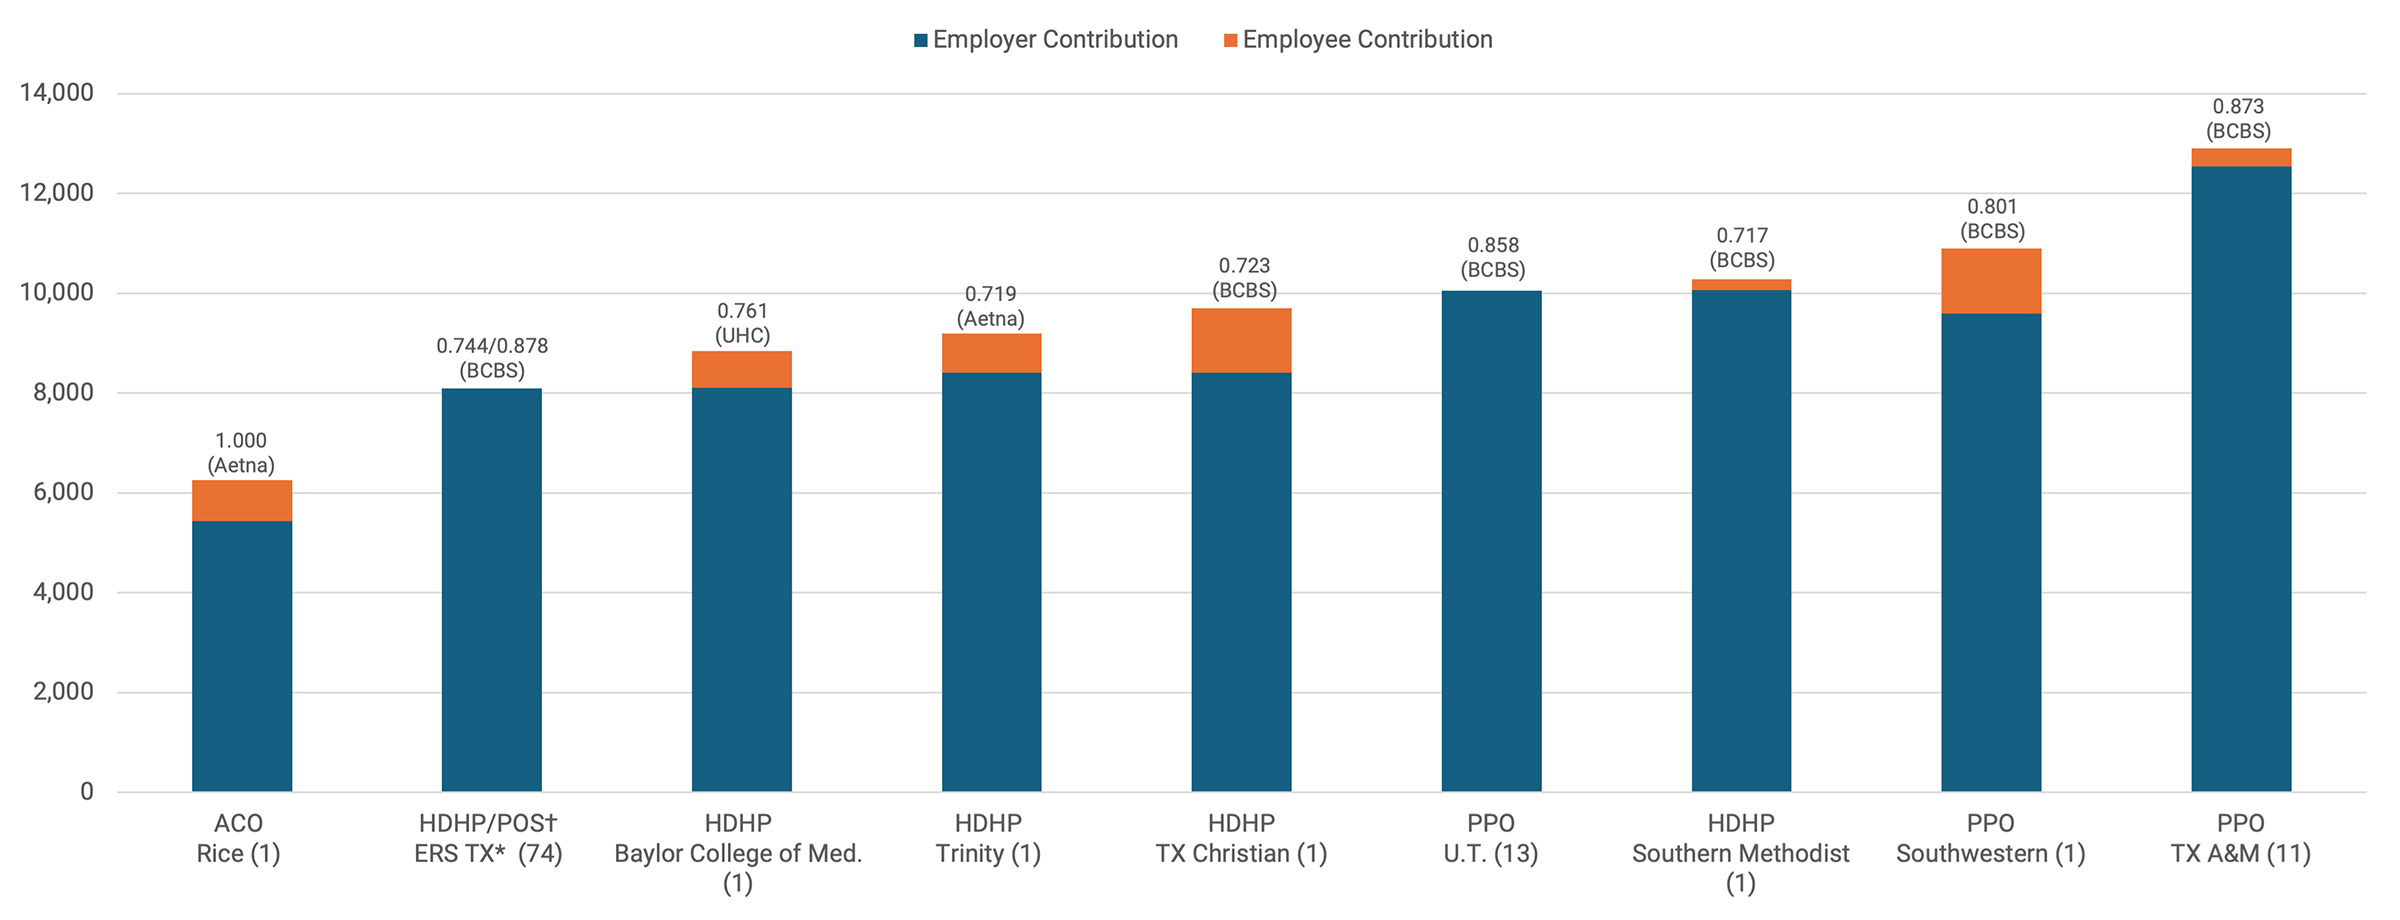
Figure 1 contains a graph of PPO/POS premiums for employee-only coverage by university for the 2025–26 plan year.
- Wide premium variation: The annual cost of individual coverage varied by more than $5,000 across Texas universities. Trinity University’s PPO plan has the highest premium ($15,742), while the ERS Texas POS plan — which covers 74 institutions of higher education — is lowest at $8,095.
- Full premium coverage: The ERS Texas POS and the UT PPO are the only plans studied that cover the entire premium cost for the employee. They are also the two lowest-priced premiums in the sample ($8,095 and $10,055 respectively).
- Insurer market power: Both the ERS and UT plans use Blue Cross and Blue Shield of Texas (BCBSTX) as their insurance carrier. BCBSTX has the largest market share for PPO coverage of any insurer in Texas (60%), and a larger insurer market share has been associated with the ability to negotiate lower prices for hospital care.[6]
- Structural cost drivers: Despite sharing the same insurer (BCBSTX), Texas A&M’s PPO plan is noticeably costlier at $12,901. Overall, the data suggests that multi-university pool plans tend to have lower PPO coverage costs than those managed by single universities.
The three universities with the highest employee premium contributions required for PPO coverage are Trinity University ($3,993), Texas Christian University ($3,956), and Baylor College of Medicine ($2,874). There appears to be minimal alignment between the total plan cost and the employee’s share. A comparison of two similar plans illustrates this gap:
- Texas A&M University — Total plan cost $12,901; employee contribution $360.
- Texas Christian University — Total plan cost $12,174; employee contribution $3,956.
Despite a total cost difference of less than $800, TCU employees pay over 10 times more out-of-pocket than their counterparts at Texas A&M University.
Figure 1 — Health Insurance Plan Characteristics for Texas Higher Education Institutions, 2025–26: Employee Coverage
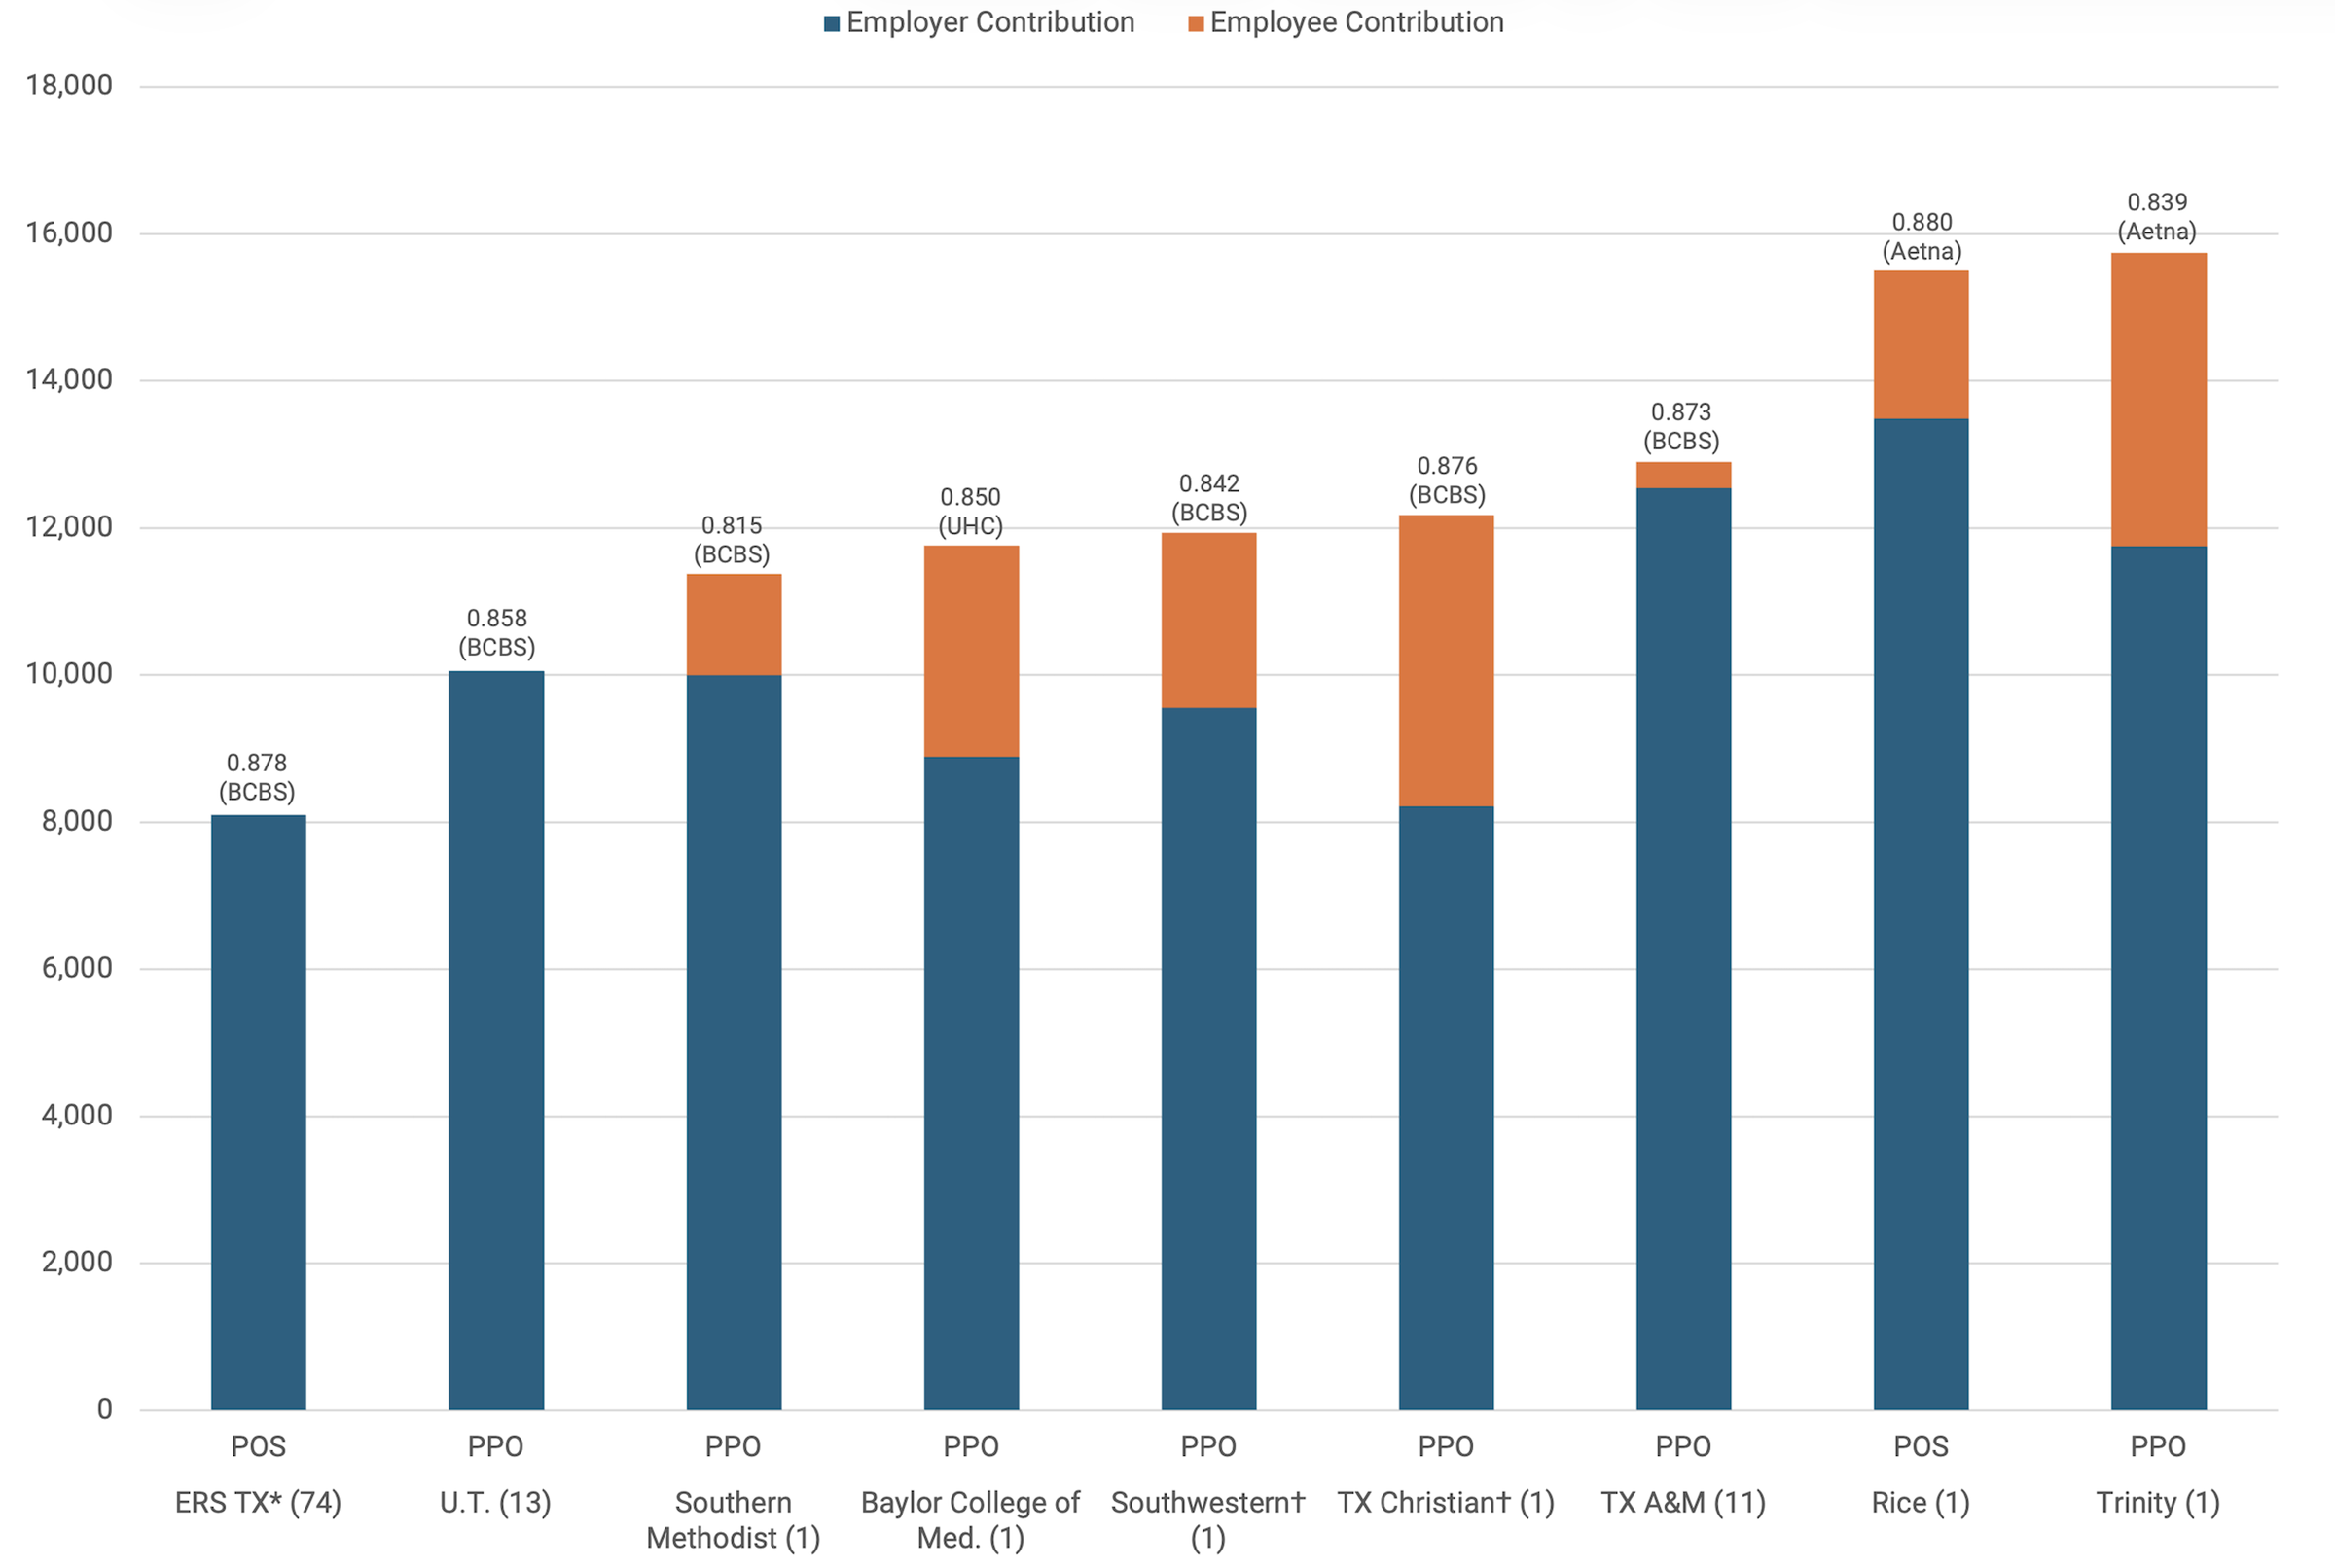
Notes: Relative actuarial value listed above each bar, followed by plan provider. Number in parenthesis by university name is the number of campuses.
The high-deductible health plans offered by Employees Retirement System of Texas (ERS), and Rice, Southern Methodist, Trinity, and Texas Christian universities are not featured in this graph. Due to space constraints, University of the Incarnate Word was excluded from Figure 1, but data on this plan is included in Appendix Table B.
* ERS campuses are listed in Appendix Table A.
† The university has at least two PPO plans and this reflects the costliest plan.
PPO/POS Family Coverage
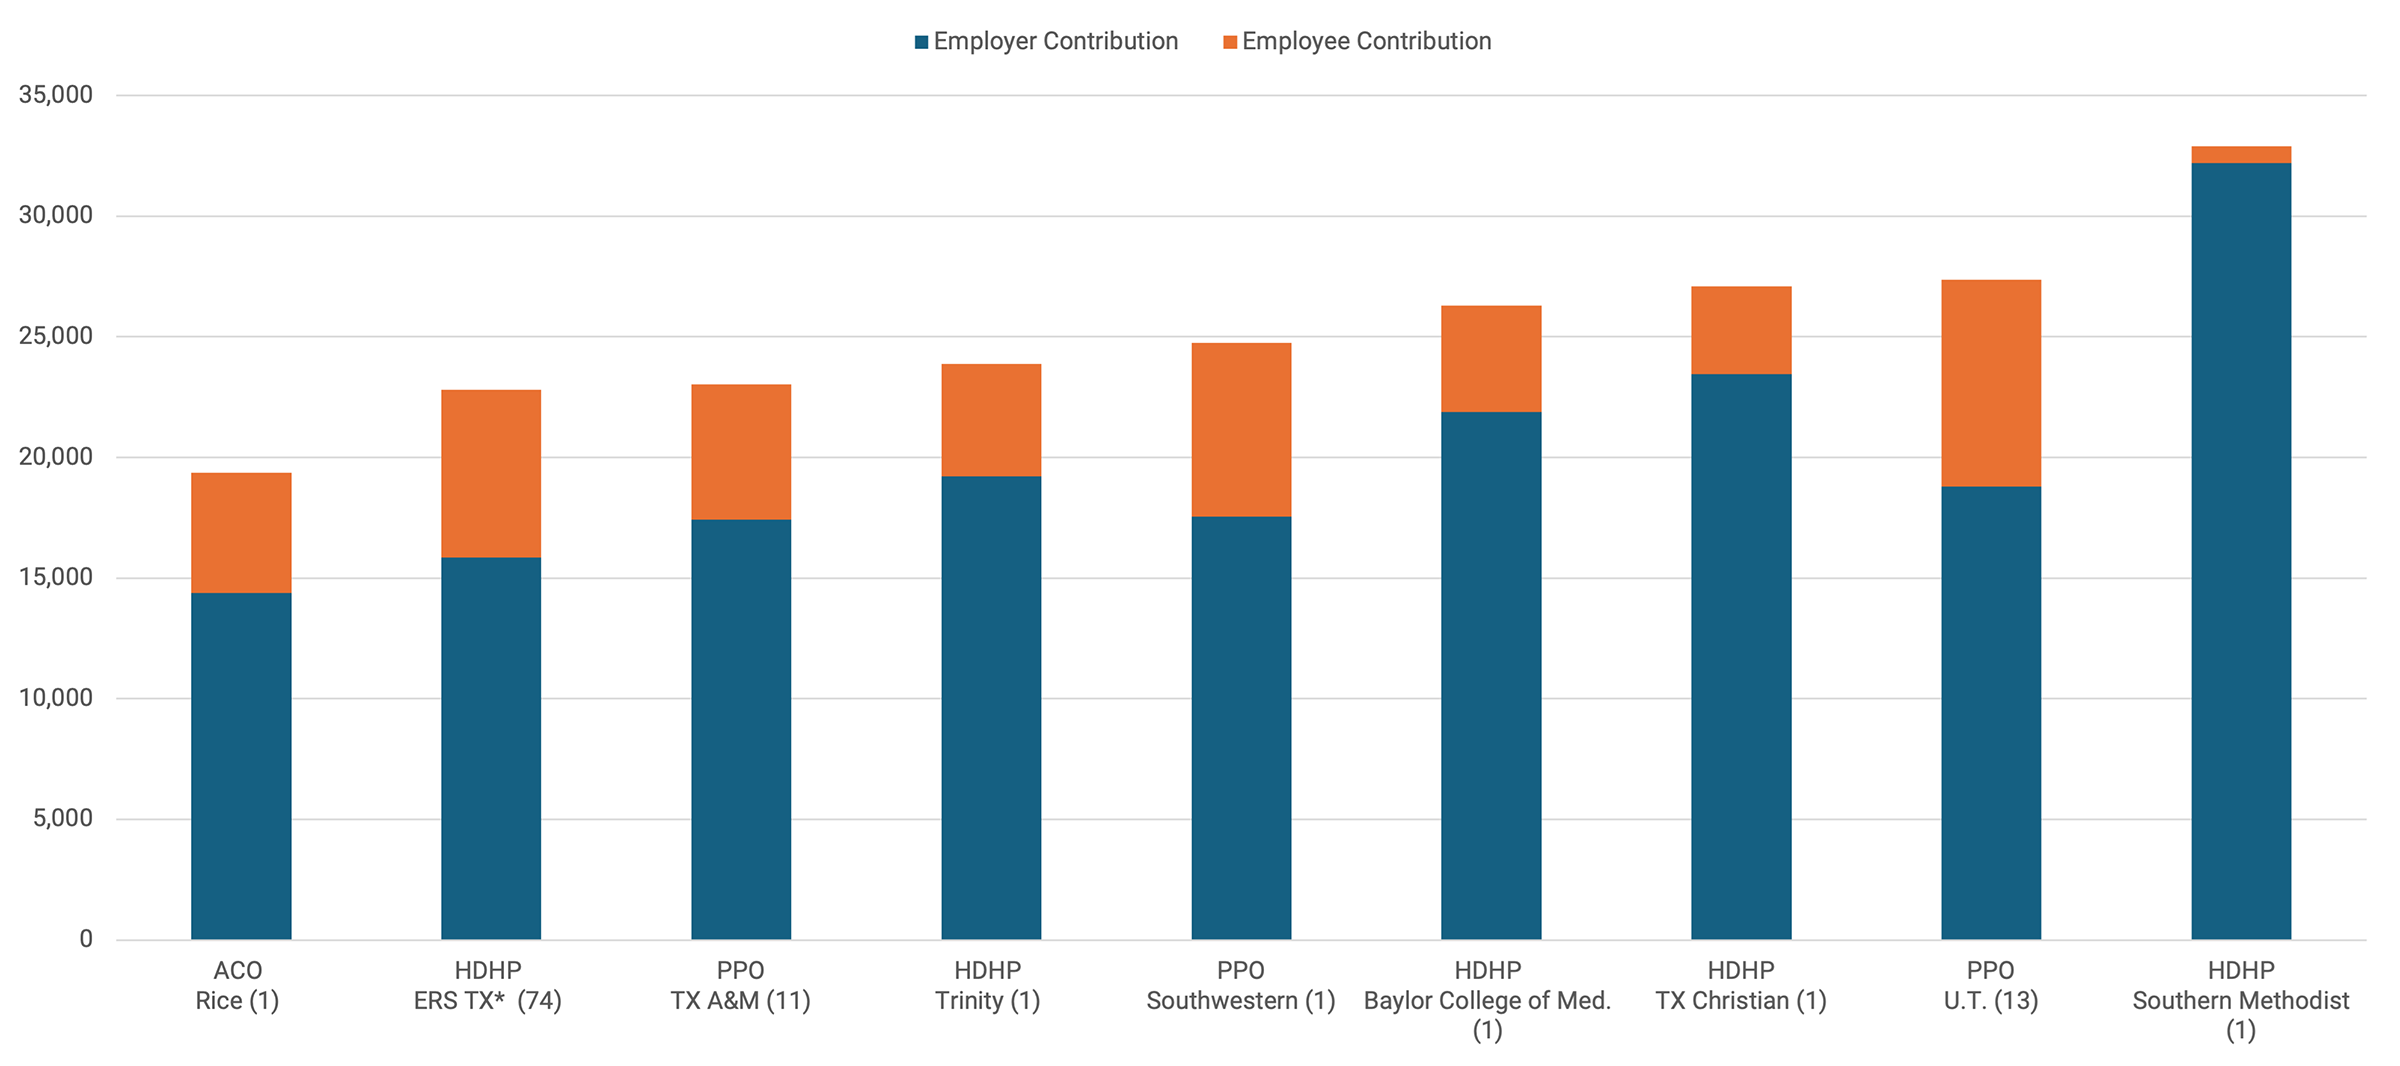
Figure 2 contains a graph of PPO/POS premiums for family coverage by university for the 2025–26 plan year.
- Substantial cost disparity: Annual family coverage costs vary by more than $25,000 across the sample. Premiums range from a low of $23,037 for the Texas A&M University PPO plan to a high of $48,636 for the Rice University POS plan.
- Consistency in rankings: The rank order of total premium costs for family coverage closely aligns with the ranks observed for employee-only coverage. Most universities maintain a similar cost position regardless of the people covered.
- The outlier: Texas A&M University exhibits the largest change in rank, shifting from the third most costly premium for employee-only coverage, to the lowest cost for family coverage.
- High employee burden: Slightly over half of the analyzed plans require employees to contribute more than $10,000 annually to the cost of family PPO/POS coverage. In contrast, Southern Methodist University requires the lowest contribution from workers for family PPO/POS coverage ($4,289).
Figure 2 — Health Insurance Plan Characteristics for Texas Higher Education Institutions, 2025–26: Family Coverage
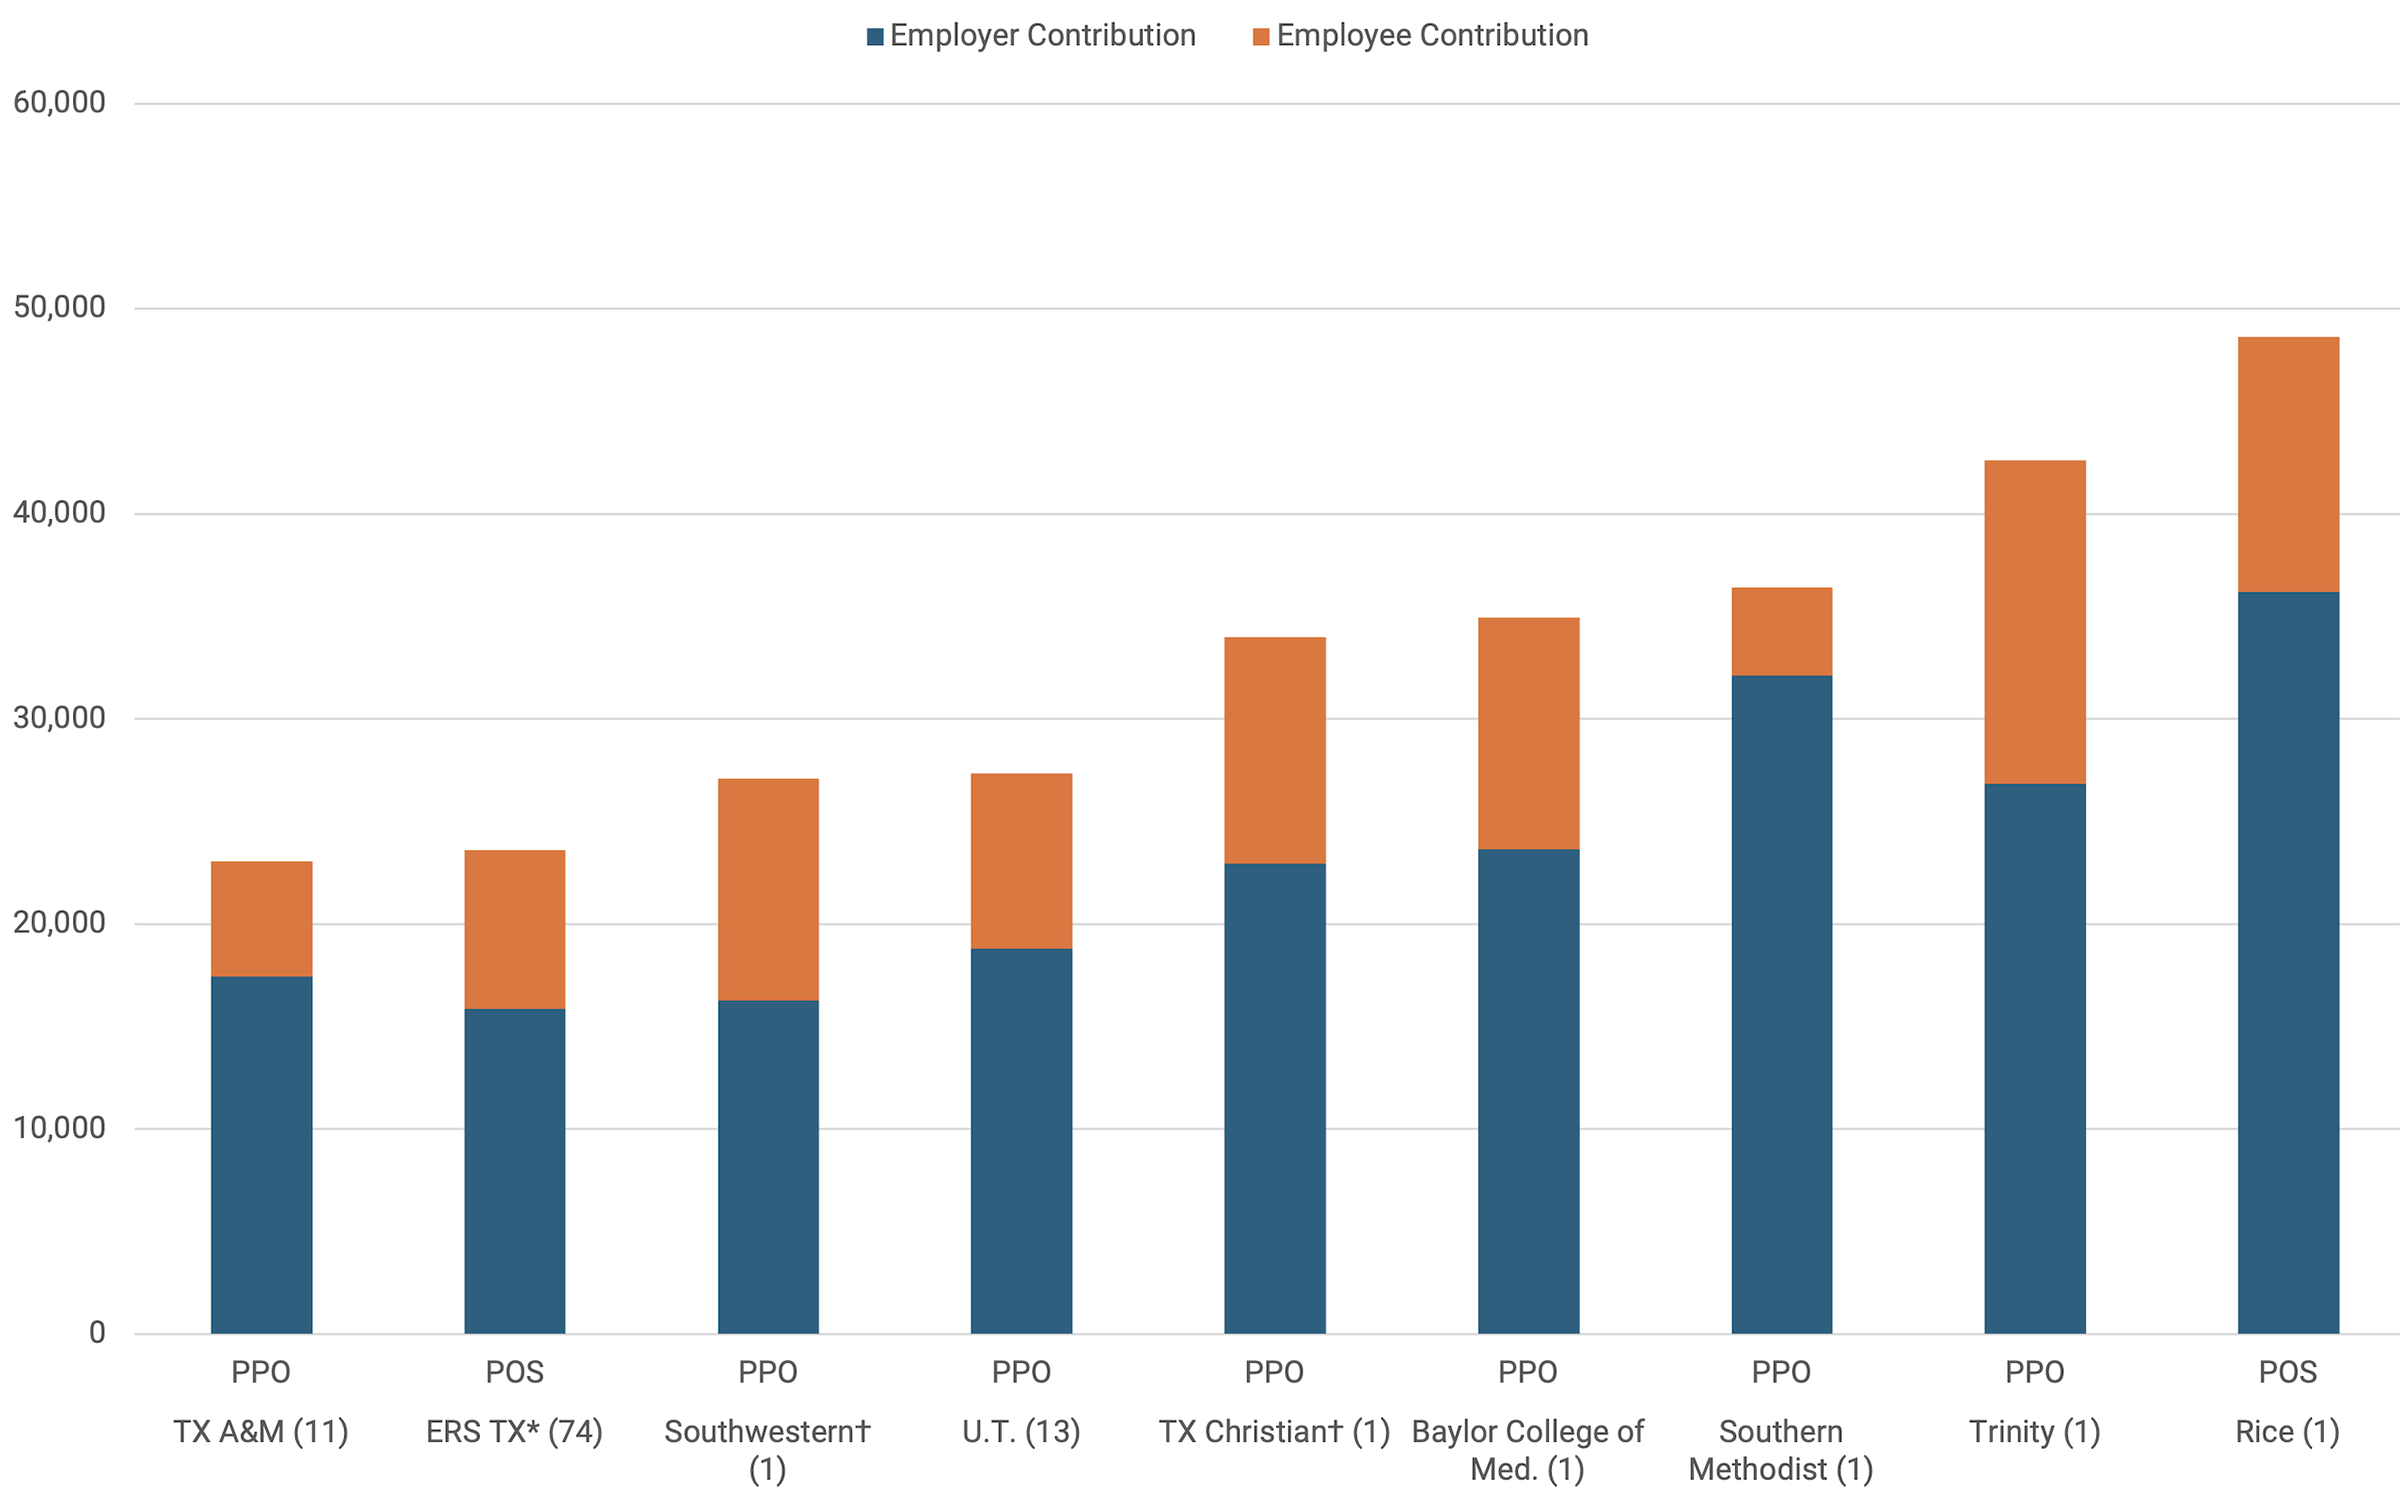
Notes: Number in parenthesis by university name is the number of campuses.
The high-deductible health plans offered by Employees Retirement System of Texas (ERS), and Rice, Southern Methodist, Trinity, and Texas Christian universities are not featured in this graph. Relative actuarial values and plan provider are the same as in Figure 1.
* ERS campuses are listed in Appendix Table A.
† The university has at least two PPO plans and this reflects the costliest plan.
Actuarial Value of PPO/POS Coverage
The actuarial value of coverage varies across universities as well, from a low of 0.815 for Southern Methodist University to a high of 0.88 for the Rice University POS plan. That is, the AV Calculator estimates that the insurance plans are predicted to cover 81.5% and 88% respectively of medical spending, with the individual expected to pay out-of-pocket for the remainder over the course of the year, a difference of 6.5 percentage points. One source estimates that medical claims per person covered by employer sponsored insurance amounted to $6,144 in 2024.[7] Applying 6.5% to $6,144 implies that employees with this level of expenditures and the lower actuarial value plan would be required to pay $400 more out-of-pocket for their medical expenses each year relative to an employee with identical expenses but a plan with higher actuarial value.
Discussion
This report launches a series of studies that the Baker Institute Center for Health Policy is undertaking to examine variability in health insurance costs and explore underlying causes. This small-scale comparison suggests multiple factors that could explain variation in insurance premiums across universities: the number of employees covered in a plan, the market share of the insurer, and the consolidation of providers in a local market.
Number of Employees
The ERS Texas PPO and the UT PPO multi-institution plans have the two lowest-priced premiums in the sample ($8,095 and $10,055 respectively), which can largely be attributed to their massive scale. Employers that pool large numbers of individuals together exert significant buying power and may be able to demand that their insurer negotiate lower prices with healthcare provider networks.
Market Share
BCBSTX controls 60% of the market share for PPO plans in Texas, which may also partially explain why ERS Texas and UT have the lowest premiums in the sample. In contrast, Aetna has only 19% of PPO market share in Texas, and accounts for the two highest-cost PPO plans in the sample, Rice University and Trinity University ($15,504 and $15,742 respectively). Two exceptions to this pattern:
- Texas A&M University, which also covers workers using BCBSTX, but has relatively high PPO premiums ($12,901).
- Baylor College of Medicine covers workers through UnitedHealthcare, which has an even smaller market share than Aetna, but still manages to offer a PPO plan in the lower half of costs for universities in the sample ($11,763). Baylor University in Waco, TX uses UMR, a subsidiary of UnitedHealthcare, to cover its employees. It was not possible to determine Baylor Waco’s premium costs for 2025–26, although one unofficial communication indicated that the annual cost of their employee-only PPO plan was $8,183.
There is a public perception that UnitedHealthcare controls healthcare spending by denying physician referrals for specialist care and diagnostic tests at a higher rate than other insurers. This perception is fueled by research finding that UnitedHealth Group has the highest rates of denial or prior authorization requests among Medicare Advantage plans.[8]
Substantial economic research has concluded that hospital consolidation enables hospitals to charge higher prices, suggesting that some of the variation observed in this sample may be directly influenced by regional market consolidation.[9]
Measuring market power: The Health Care Cost Institute reports hospital market concentration using the Herfindahl-Hirschman Index (HHI), which ranges from 0 (representing a perfectly competitive, unconcentrated hospital market) to 10,000 (representing a monopoly).[10]
- College Station has a relatively high HHI (5,429) compared to Dallas (1,704), which may explain why the PPO premium for Texas A&M University ($12,901) is higher than Southern Methodist University ($11,373).
- San Antonio’s HHI of 3,151 is also considerably higher than Dallas’, which may partially explain Trinity University’s higher premium.
Caveats
Several caveats apply to these findings.
- Limited focus: The analysis was focused on PPO/POS plans, because this plan type was offered across all major universities in Texas. However, multiple universities offered alternative plan types that were substantially cheaper for both the university and its employees. For example, Trinity University had the most expensive PPO plan ($15,742) in the sample, but it also offered a high-deductible health plan that cost $9,192, with only $779 contributed by the employee. Similarly, Rice University had the second highest cost PPO/POS plan ($15,504), but also offered an ACO plan, which is among the lowest options in the entire sample ($6,252). Appendix Figures 1 and 2 contain graphs showing the lowest priced premiums for employee and family coverage by university for the 2025–26 plan year.
- ERS restrictions: Although the ERS POS plan costs less than the University of Texas PPO plan ($8,095 versus $10,055), the ERS plan is more restrictive. ERS plan members must select a primary care physician and obtain referrals from that PCP for specialist care.[11] In addition, the networks of hospitals, physicians, and other providers vary across, and within, insurers in ways that could not be accounted for in this analysis.
- Broker involvement: No consideration was given to the brokers hired by universities to assist in choosing insurance carriers or negotiating contracts. Brokers’ effectiveness in negotiating the lower premiums may vary, just as universities may differ in the preferences they convey regarding tradeoffs between affordability and comprehensiveness of health insurance benefits.
Conclusion
Designing benefits that are attractive yet cost-effective requires several strategic decisions. Employers must choose between offering a single plan type, such as a PPO, or a mix of high-cost and low-cost options, such as HMOs or HDHPs. Then setting premium prices involves balancing multiple factors, including provider network breadth, employee utilization patterns, and plan features — copays, coinsurance, and deductibles. Closely linked to plan design is the determination of the premium share to be paid by the worker. To attract top-tier talent, employers may offer more comprehensive benefits than they can fully subsidize, requiring a strategic balance between plan richness and employee contributions.
A range of potential economic factors explain the variability in health insurance premiums across Texas universities. The observed variation aligns with established models regarding employer versus provider market power in price negotiations. While this case study identifies these drivers, it does not quantify the relative impact of factors such as employer size and hospital consolidation in determining premiums. Data collection is underway for a large nationwide sample of universities, which will enable statistical analyses to quantify the relative importance of specific economic factors in influencing health insurance costs.
The substantial premium variation across Texas universities may prompt employee demand for new options to lower their healthcare costs. While most workers see that their insurance contributions are outpacing wage growth, many remain unaware that comparable coverage is often available at significantly lower costs within the same industry and occupation. Significant cost variations — up to $5,000 for individuals and $25,000 for families — suggest that some employers have substantial room to lower healthcare costs for their institution and workers alike. Public reporting on insurance cost variations remains scarce; however, the disparities identified among Texas universities likely exist nationwide, spanning both public and private sectors.
Higher cost universities may be able to take steps to reduce premium spending without sacrificing benefit quality. Because most universities self-insure, any savings on healthcare services would accrue directly to the employer. Potential strategies include:
- Pooling members to increase negotiating leverage in obtaining coverage for their workers, modeled on the way the Texas Health Benefits Pool operates for public entities.[12]
- Implementing tiered copayments for higher priced hospitals; research indicates this can reduce costs per hospital stay by 8.5%, with no evidence of a decline in the quality of patient care.[13]
- Using federal price transparency data to compare provider and insurer networks and help determine the selection of the most cost-effective, high-quality healthcare options.[14]
Federal and state policy makers are best equipped to address many of the issues that are driving high healthcare costs, such as hospital consolidation. However, employers that fail to consider strategic alternatives — such as steering workers toward lower cost, high quality providers or pooling their bargaining power with other institutions — are behaving as if their demand for healthcare is inelastic. By acting as if they must accept any price increase regardless of cost, they forfeit their leverage, which drives up expenses for both the employer and its employees. The premium variations identified in this report can be used as a starting point for efforts to find more cost-effective coverage for workers and improve healthcare affordability in this country.
Key to Basic Health Insurance Terms
These brief descriptions of common health insurance models are categorized by how they manage provider networks and costs.
- PPO (Preferred Provider Organization)/POS (Point of Service): A PPO offers maximum flexibility, allowing members to see any healthcare provider, though costs are lower when using “in-network” doctors. POS plans are a hybrid, typically requiring a primary care physician (PCP) and referrals like an HMO, while still permitting out-of-network care at a higher cost.[15]
- HMO (Health Maintenance Organization): This model restricts coverage to care from providers who contract with the HMO. It generally does not cover out-of-network care except in emergencies and requires a referral from a PCP to see a specialist.[16]
- HDHP (High-Deductible Health Plan): A plan characterized by a higher deductible than traditional insurance, often paired with a Health Savings Account (HSA). This allows for lower monthly premiums and the use of untaxed dollars for medical expenses.[17]
- RBP (Reference-Based Pricing): An employer-driven cost-control strategy that pays a set “reference price” for services — often a percentage above Medicare rates — rather than using a traditional provider network.[18]
- ACO (Accountable Care Organization): A group of healthcare providers who coordinate high-quality care for a specific patient population. The goal is to reduce service duplication and medical errors while controlling costs.[19]
Appendix
Appendix Table A — Employees Retirement System of Texas (ERS) Universities
Appendix Table B — Health Insurance Premium Contributions and Actuarial Values by University and Plan Type 2025–26
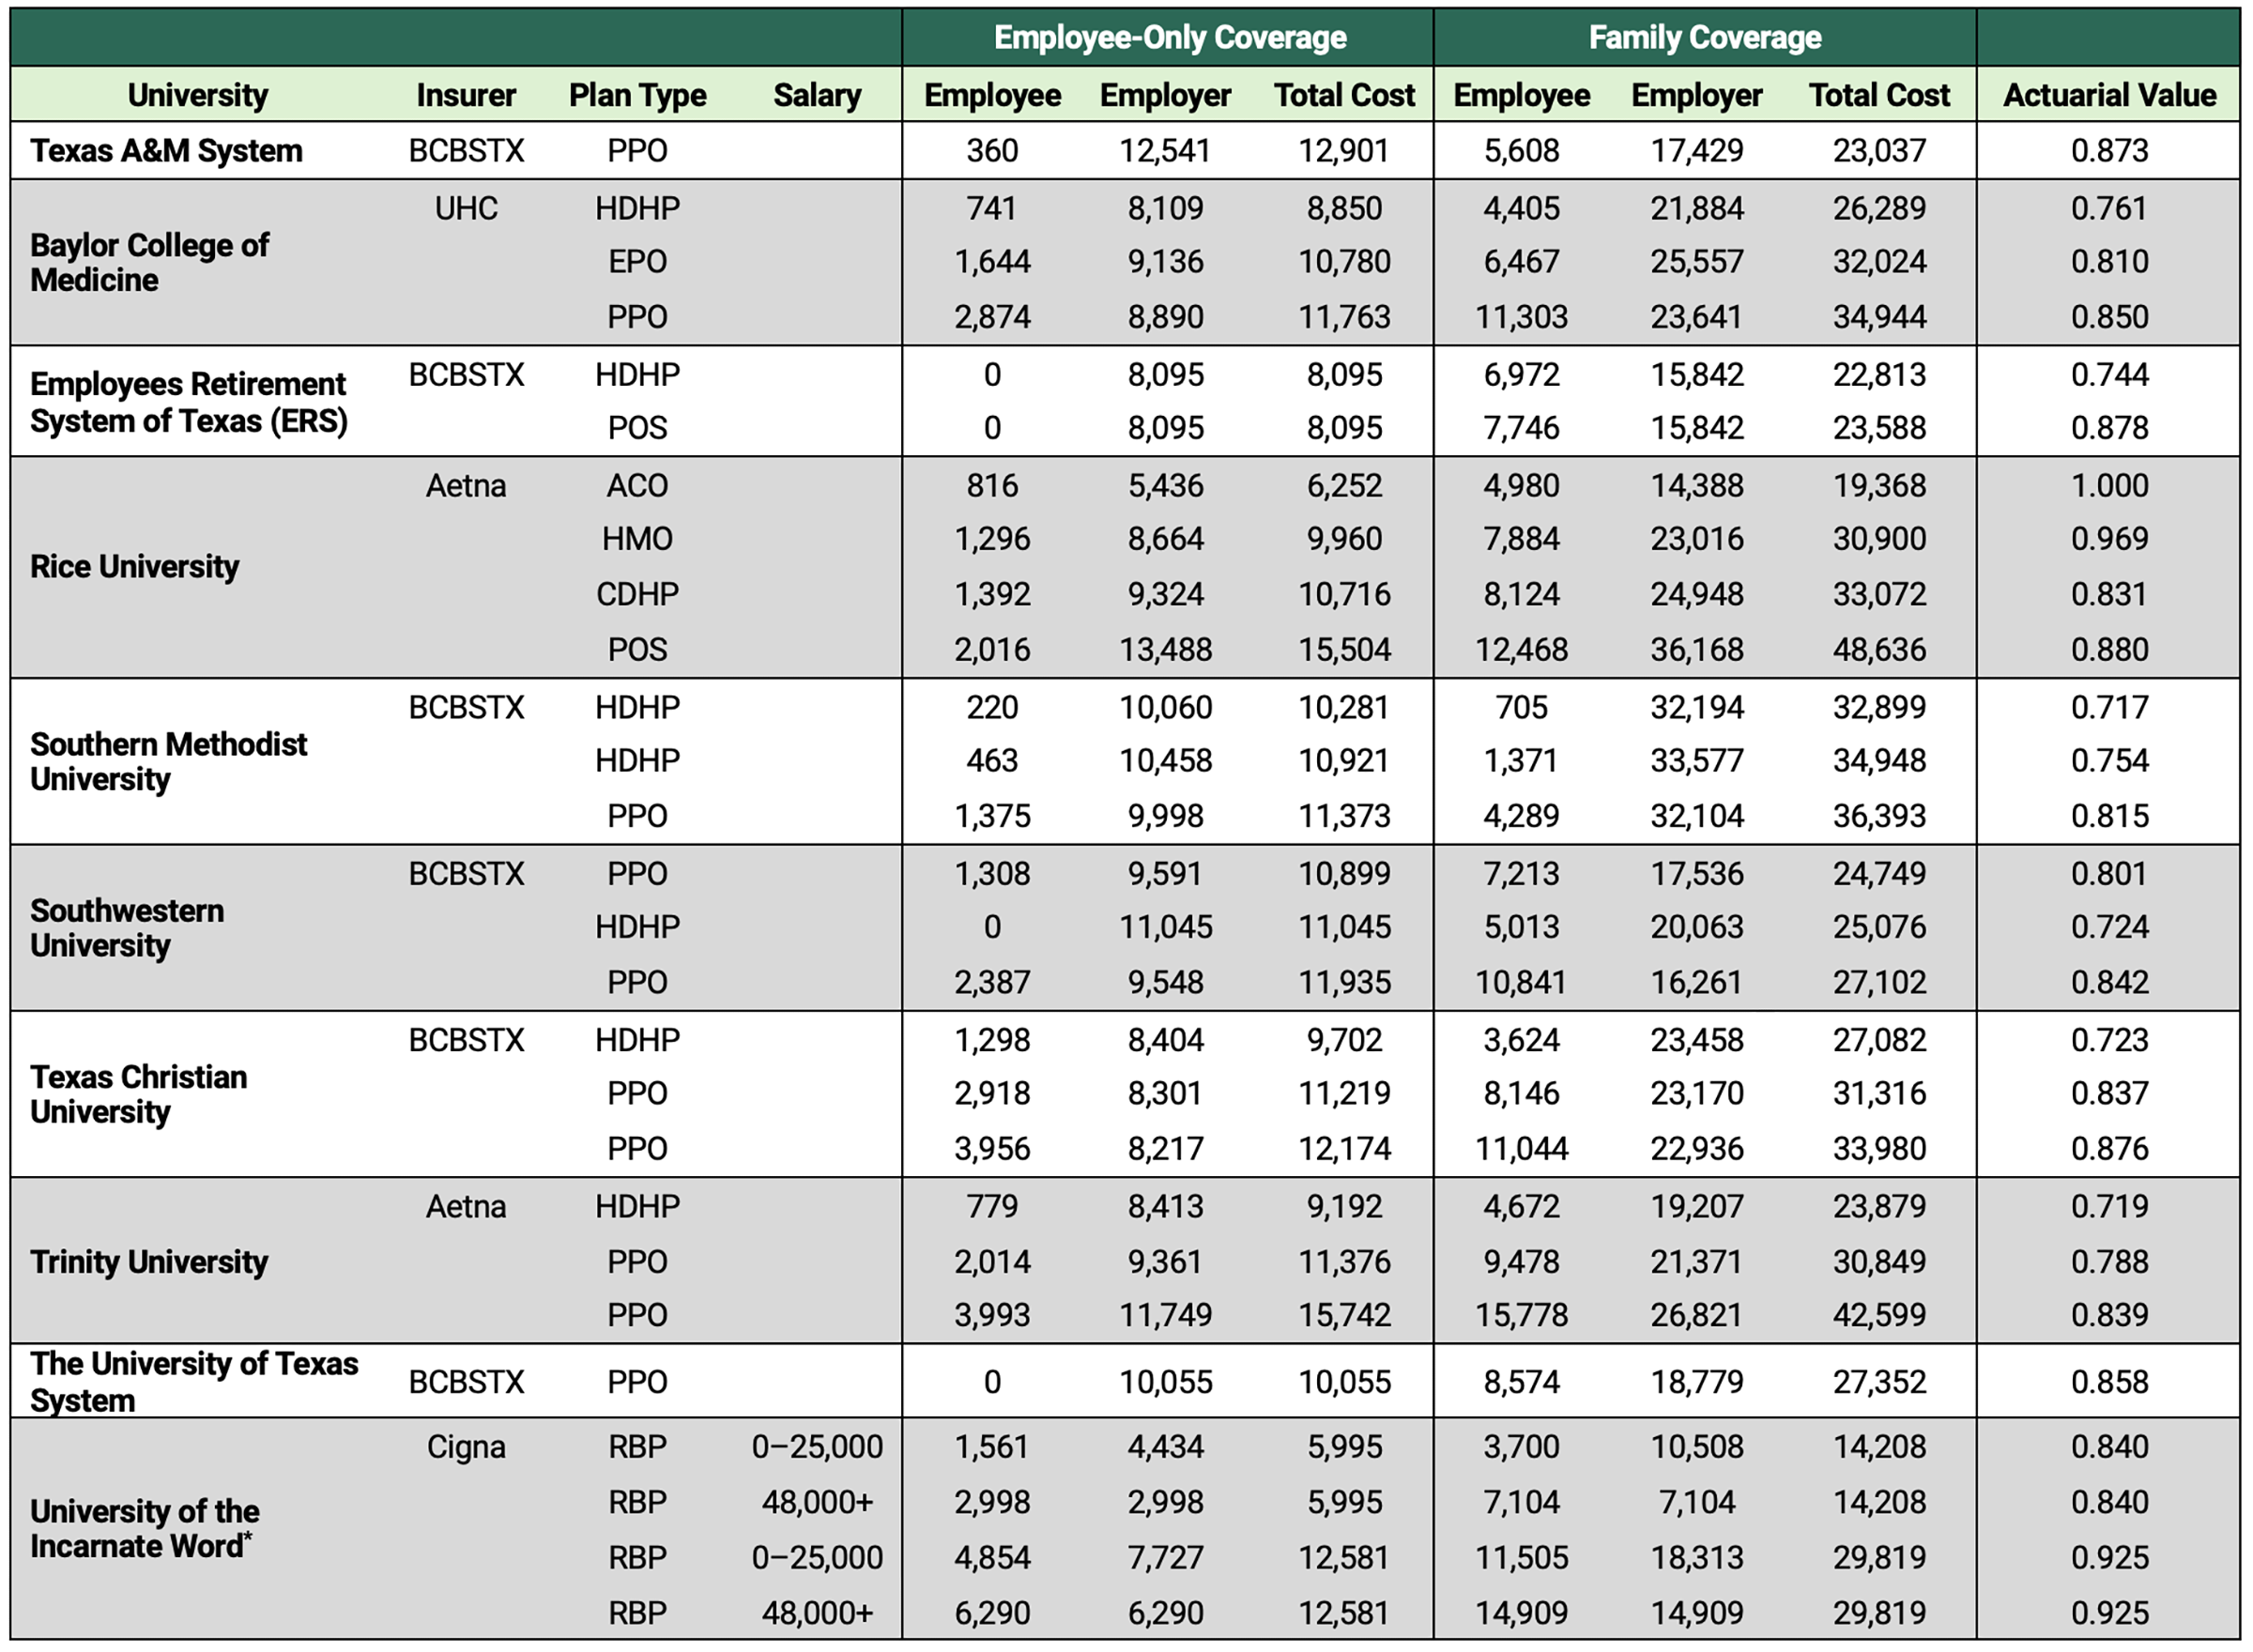
Note: When a university had more than one PPO plan, the costliest plan was used in the figures.
* UIW provides a subsidy for employees making less than $48,000. The lowest and highest salary brackets are provided to illustrate the largest potential difference in employee contributions that may result from these subsidies.
Appendix Figure 1 — Health Insurance Plan Characteristics for Texas Higher Education Institutions, 2025–26: Lowest-Price Employee Coverage
Notes: Relative actuarial value listed above each bar, followed by plan provider. Number in parenthesis by university name is the number of campuses.
* ERS campuses are listed in Appendix Table A.
† HDHP and PPO plans have the same premiums.
Appendix Figure 2 — Health Insurance Plan Characteristics for Texas Higher Education Institutions, 2025–26: Lowest-Price Family Coverage
Note: Number in parenthesis by university name is the number of campuses. Relative actuarial values and plan provider are the same as in Appendix Figure 1.
* ERS campuses listed in Appendix Table A.
Acknowledgements
This project was supported by the Sid Richardson Endowment Fund at the Baker Institute. The authors are grateful to Meaghan Bludau, Sandee Cheynet, Katrina Daniel, Hank Steen, and Dan Stewart for helpful discussions on the employer-sponsored insurance market in Texas.
Notes
[1] Salpy Kanimian and Vivian Ho, “US Medical Prices and Health Insurance Premiums, 1999–2024,” JAMA Network Open 8, no. 12 (2025): e2547462, https://doi.org/10.1001/jamanetworkopen.2025.47462.
[2] Kaiser Family Foundation, “2025 Employer Health Benefits Survey,” October 22, 2025, https://www.kff.org/health-costs/2025-employer-health-benefits-survey/.
[3] “IPEDS Data Center,” Integrated Postsecondary Education Data System, accessed April 23, 2026, https://nces.ed.gov/ipeds/datacenter/InstitutionList.aspx?goToReportId=1&sid=b3f7eb0d-042c-4939-af9c-1b4596bc541e&rtid=1.
[4] COBRA — the Consolidated Omnibus Budget Reconciliation Act of 1985 allows individuals to continue their former employer’s coverage, but they must pay the full premium, making it prohibitively expensive for many (Rishi Pasumarthi and Elena M. Marks, “Lessons From Past Recessions for Health Coverage Today,” Rice University’s Baker Institute for Public Policy, May 29, 2025, https://doi.org/10.25613/M4Y1-WN17); U.S. Department of Labor, “Continuation of Health Coverage (COBRA),” accessed April 23, 2026, https://www.dol.gov/general/topic/health-plans/cobra.
[5] Centers for Medicare and Medicaid Services, Revised Final 2026 Actuarial Value Calculator Methodology, March 26, 2025, https://www.cms.gov/files/document/revised-final-2026-av-calculator-methodology-002pdf.pdf.
[6] José R. Guardado and Carol K. Kane, Competition in Health Insurance 2025 Update, American Medical Association, 2025, https://www.ama-assn.org/system/files/competition-health-insurance-us-markets.pdf; Anthony T. LoSasso et al., “Insurer Market Power And Hospital Prices in The US,” Health Affairs 42, no. 5 (2023): 615–21, https://doi.org/10.1377/hlthaff.2022.01184.
[7] Lynne Cotter et al., “How ACA Marketplace Costs Compare to Employer-Sponsored Health Insurance,” Peterson-KFF Health System Tracker, November 3, 2025, https://www.healthsystemtracker.org/brief/how-aca-marketplace-costs-compare-to-employer-sponsored-health-insurance/.
[8] Jeannie Fuglesten Biniek et al., Medicare Advantage Insurers Made Nearly 53 Million Prior Authorization Determinations in 2024, Kaiser Family Foundation, January 28, 2026, https://www.kff.org/medicare/medicare-advantage-insurers-made-nearly-53-million-prior-authorization-determinations-in-2024/.
[9] Zack Cooper et al., “The Price Ain’t Right? Hospital Prices and Health Spending on the Privately Insured,” The Quarterly Journal of Economics 134, no. 1 (2019): 51–107. https://doi.org/10.1093/qje/qjy020; Martin Gaynor et al., “The Industrial Organization of Health-Care Markets,” Journal of Economic Literature 53, no. 2 (2015): 235–84, https://dx.doi.org/10.1257/jel.53.2.235.
[10] Health Care Cost Institute, “Summary Report Current Spending,” accessed April 24, 2026, https://hmi.healthcostinstitute.org/#HMI-Summary-Report-Current-Spending.
[11] Employees Retirement System of Texas (ERS), “HealthSelect of Texas for Active Employees,” accessed April 23, 2026, https://www.ers.texas.gov/Active-Employees/Health-Benefits/HealthSelect-of-Texas.
[12] Texas Health Benefits Pool, “About Texas Health Benefits Pool,” accessed April 23, 2026. https://www.txhb.gov/About.
[13] Elena Prager, “Healthcare Demand under Simple Prices: Evidence from Tiered Hospital Networks,” American Economic Journal: Applied Economics 12, no. 4 (2020): 196–223, https://doi.org/10.1257/app.20180422.
[14] Ho et al., “What Houston Employers Gain From Transparent Hospital Pricing,” Rice University’s Baker Institute for Public Policy, July 30, 2025, https://doi.org/10.25613/PBR5-X547.
[15] HealthCare.gov, “Glossary,” accessed May 6, 2026, https://www.healthcare.gov/glossary/.
[16] “Glossary.”
[17] “Glossary.”
[18] American Hospital Association, “Fact Sheet: Reference-based Pricing,” June 8, 2021, https://www.aha.org/fact-sheets/2021-06-08-fact-sheet-reference-based-pricing.
[19] Centers for Medicare & Medicaid Services, “Accountable Care Organizations (ACOs),” accessed May 6, 2026, https://www.cms.gov/Medicare/Medicare-Fee-for-Service-Payment/ACO; Stephen M. Shortell et al., “Accountable Care Organizations: The National Landscape,” Journal of Health Politics, Policy and Law 40, no. 4 (2015): 647–68, https://doi.org/10.1215/03616878-3149976.
This publication was produced by Rice University’s Baker Institute for Public Policy. Wherever feasible, the material was reviewed by outside experts prior to release. Any errors or omissions are solely the responsibility of the author(s).
This material may be quoted or reproduced without prior permission, provided appropriate credit is given to the author(s) and Rice University’s Baker Institute for Public Policy. The views expressed herein are those of the individual author(s) and do not necessarily represent the views of Rice University’s Baker Institute for Public Policy.

