
By Shao-Chee Sim, Elena Marks, Vivian Ho and Philomene Balihe
In September 2015, just before the third open enrollment period of the Affordable Care Act’s (ACA) Health Insurance Marketplace was about to open, we surveyed Texans ages 18 to 64 to see whether they had trouble paying health care bills or skipped various types of care due to cost. We compared their responses to data from September 2013 to learn whether affordability had changed based on insurance status or income level. We also compared the Texas data to similar national data regarding affordability.
About the Survey
The Health Reform Monitoring Survey (HRMS) is a quarterly survey of adults ages 18-64 that began in 2013. It is designed to provide timely information on implementation issues under the ACA and to document changes in health insurance coverage and related health outcomes. HRMS provides quarterly data on health insurance coverage, access, use of health care, health care affordability, and self-reported health status. The HRMS was developed by the Urban Institute, conducted by GfK, and jointly funded by the Robert Wood Johnson Foundation, the Ford Foundation, and the Urban Institute. Rice University’s Baker Institute and The Episcopal Health Foundation are partnering to fund and report on key factors about Texans obtained from an expanded, representative sample of Texas residents (HRMS-Texas). The analyses and conclusions based on HRMS-Texas are those of the authors and do not represent the view of the Urban Institute, the Robert Wood Johnson Foundation or the Ford Foundation. Information about the sample demographics of the cohort is available in Issue Brief #1. This Issue Brief is a summary of data extracted from the HRMS Surveys in Texas administered between September 2013 and September 2015. We will continue to report on survey data through additional Issue Briefs and future surveys.
Affordability of Health Services
The HRMS survey gathers information about affordability of health services by asking whether respondents had problems paying bills for health services they obtained and by asking whether respondents did not obtain particular kinds of services due to cost. In this brief, we report on responses to both inquiries and stratify the data by insurance status and income level.
Problems Paying Medical Bills
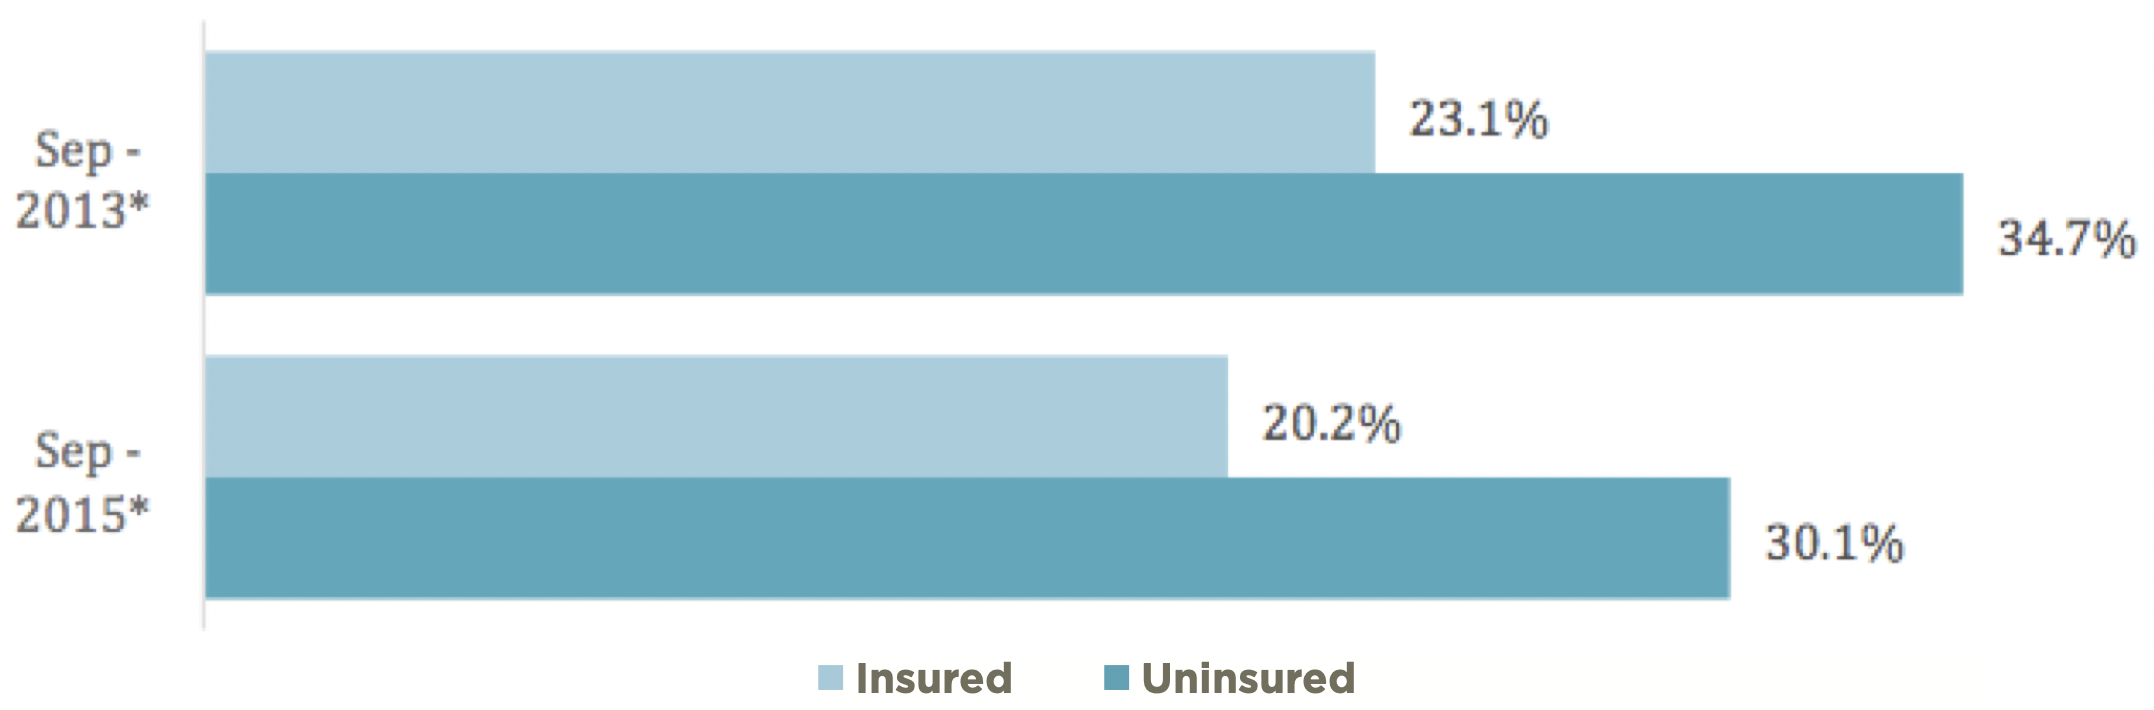
Chart 1 below shows that as a whole, fewer Texans experienced problems paying bills in 2015 as compared to 2013 (a 14.7% decrease). And when we stratify by insurance status, we see that the percentage of both insured and uninsured Texans who experienced trouble paying bills decreased at approximately the same rate (a 12.5% decrease for insured and 13.2% decrease for uninsured). Not surprisingly, in 2013 and 2015, the uninsured respondents reported significantly more problems paying medical bills than did their insured counterparts, as indicated in Chart 2.
Chart 1 — Problems Paying Medical Bills, Nonelderly Texas Adults, Sep 2013 and Sep 2015
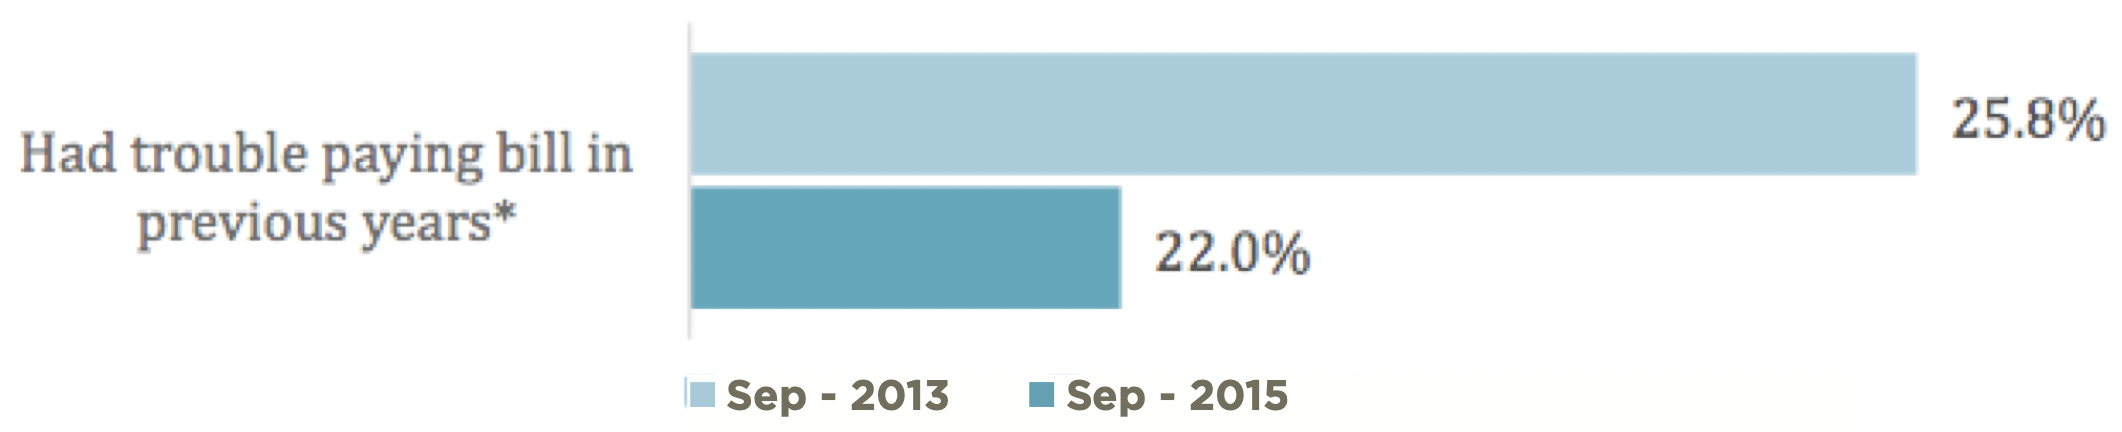
Chart 2 — Problems Paying Medical Bills, Nonelderly Texas Adults by Insurance Status, Sep 2013 and Sep 2015
The fact that all respondents reported fewer problems with medical bills in 2015 is good news. The Texas experience corresponds with data published by the National Center for Health Statistics recently that shows that from 2011 through June 2014, the percentage of adults reporting problems paying medical bills decreased for all adults and for all groups when stratified by gender, age, insurance status, income, and race/ethnicity.
Skipped Health Services
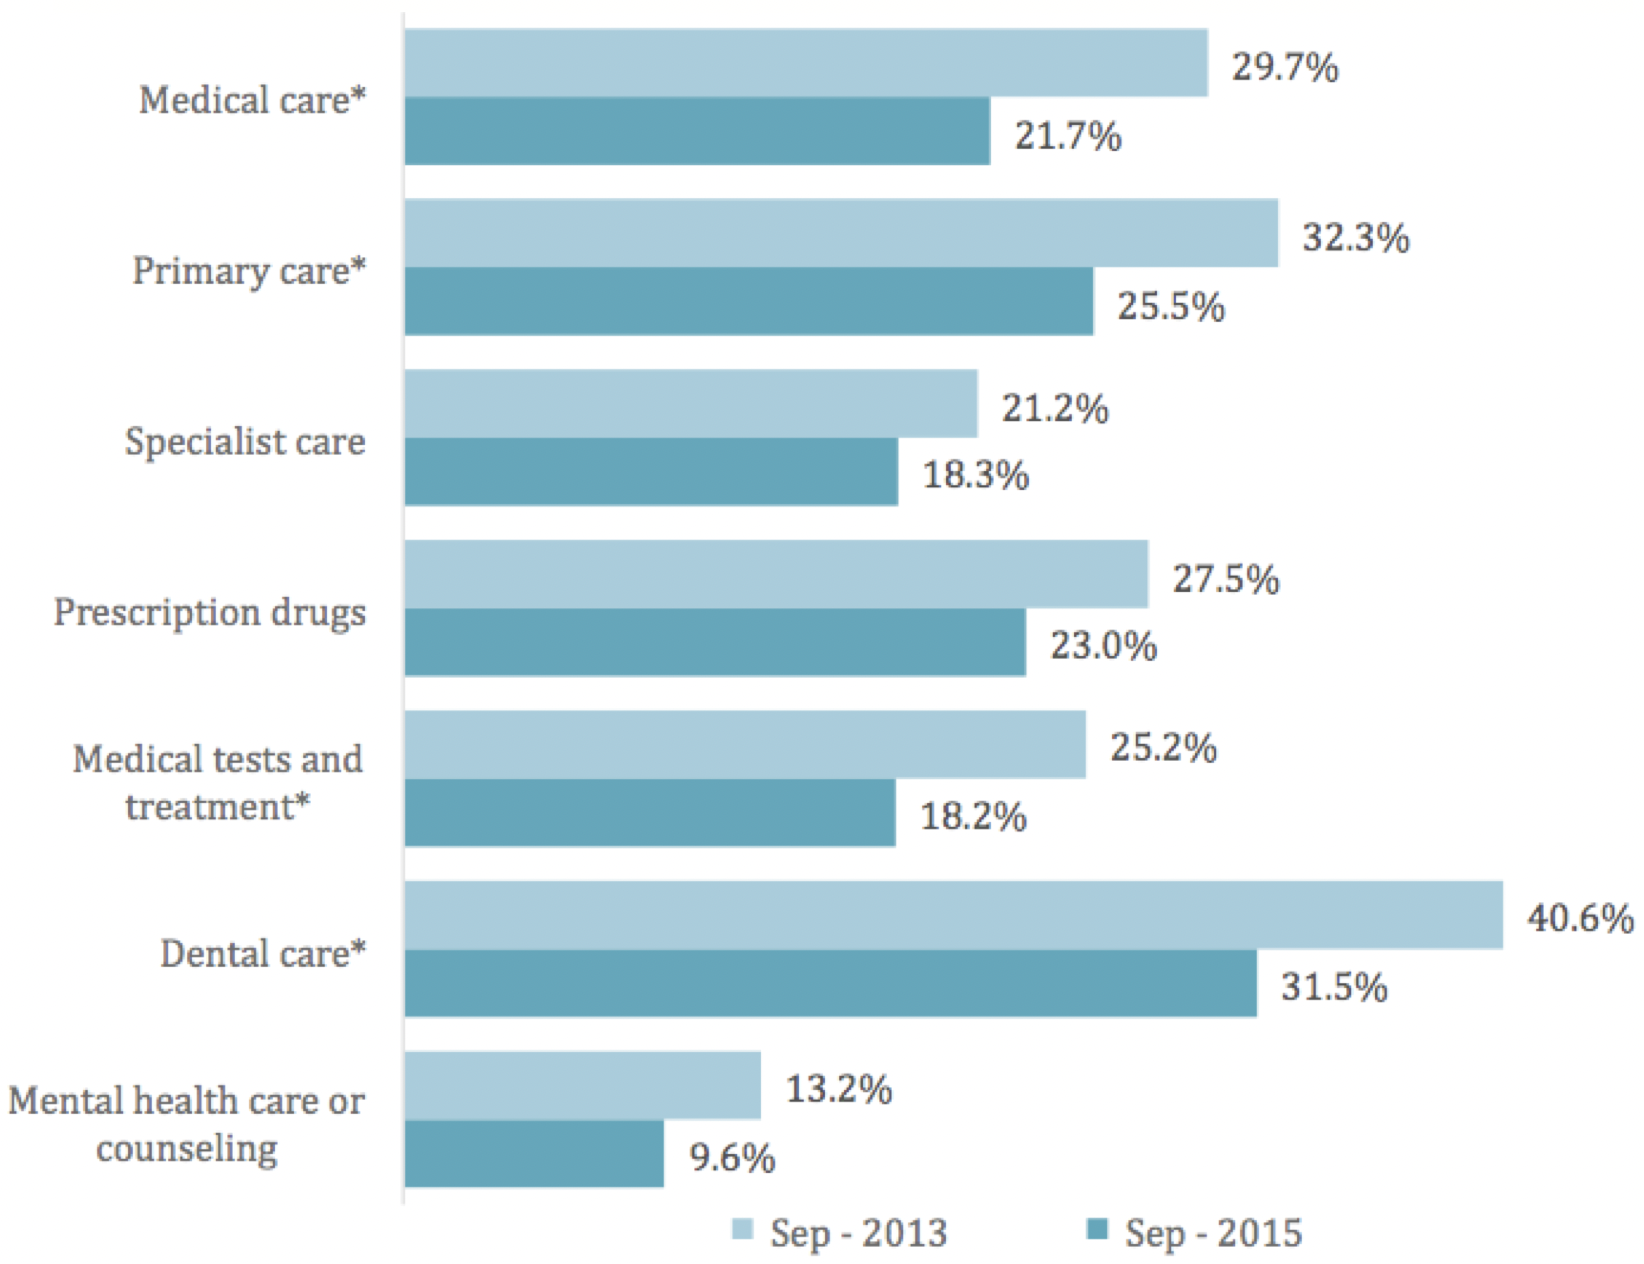
When respondents were asked about skipping particular services due to cost, the data differed by insurance status and service. As Charts 3 and 4 together show, insured respondents reported skipping care at rates below their uninsured counterparts for every single service in 2013 as well as 2015. When we look at the reported changes by insurance status, we see differences in their experiences over time. For the insured respondents, there is no statistically significant difference in the percentage of those who skipped care between the 2013 and 2015 data, with the exception of dental care. In the case of dental care, insured respondents reported a decrease of 4 percentage points (a 14.3% decrease), indicating that fewer insured Texans skipped dental care in 2015 as opposed to 2013. In the case of uninsured Texans, there were statistically significant decreases in the percentage of respondents who skipped medical care, primary care, tests and treatments, and dental care from 2013 to 2015.
Chart 3 — Skipped Health Services, Insured Adult Texans**, Sep 2013 and Sep 2015
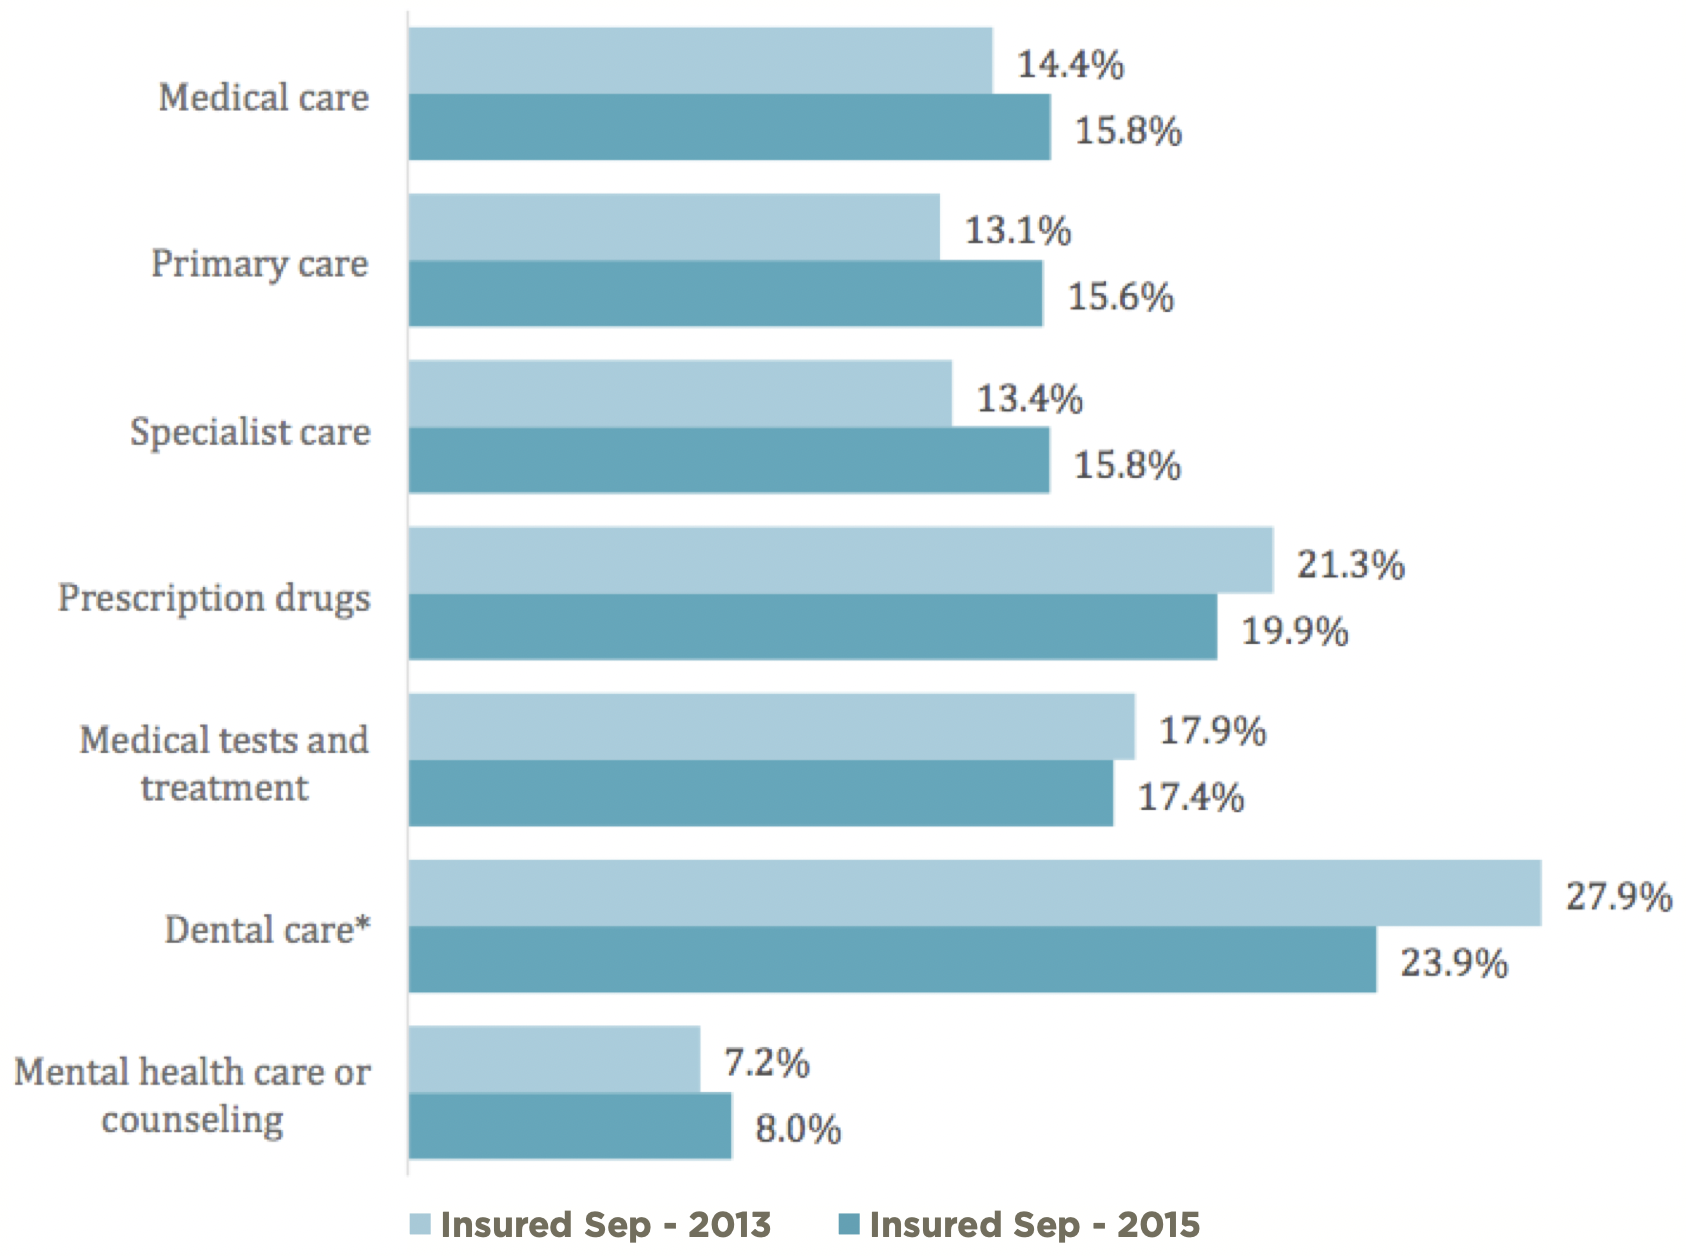
** The survey question was asked the following way: “Thinking about your health care experiences over the past 12 months, was there any time when you needed any of the following and didn’t get it because you couldn’t afford it?”
Chart 4 — Skipped Health Services, Uninsured Adult Texans, Sep 2013 and Sep 2015
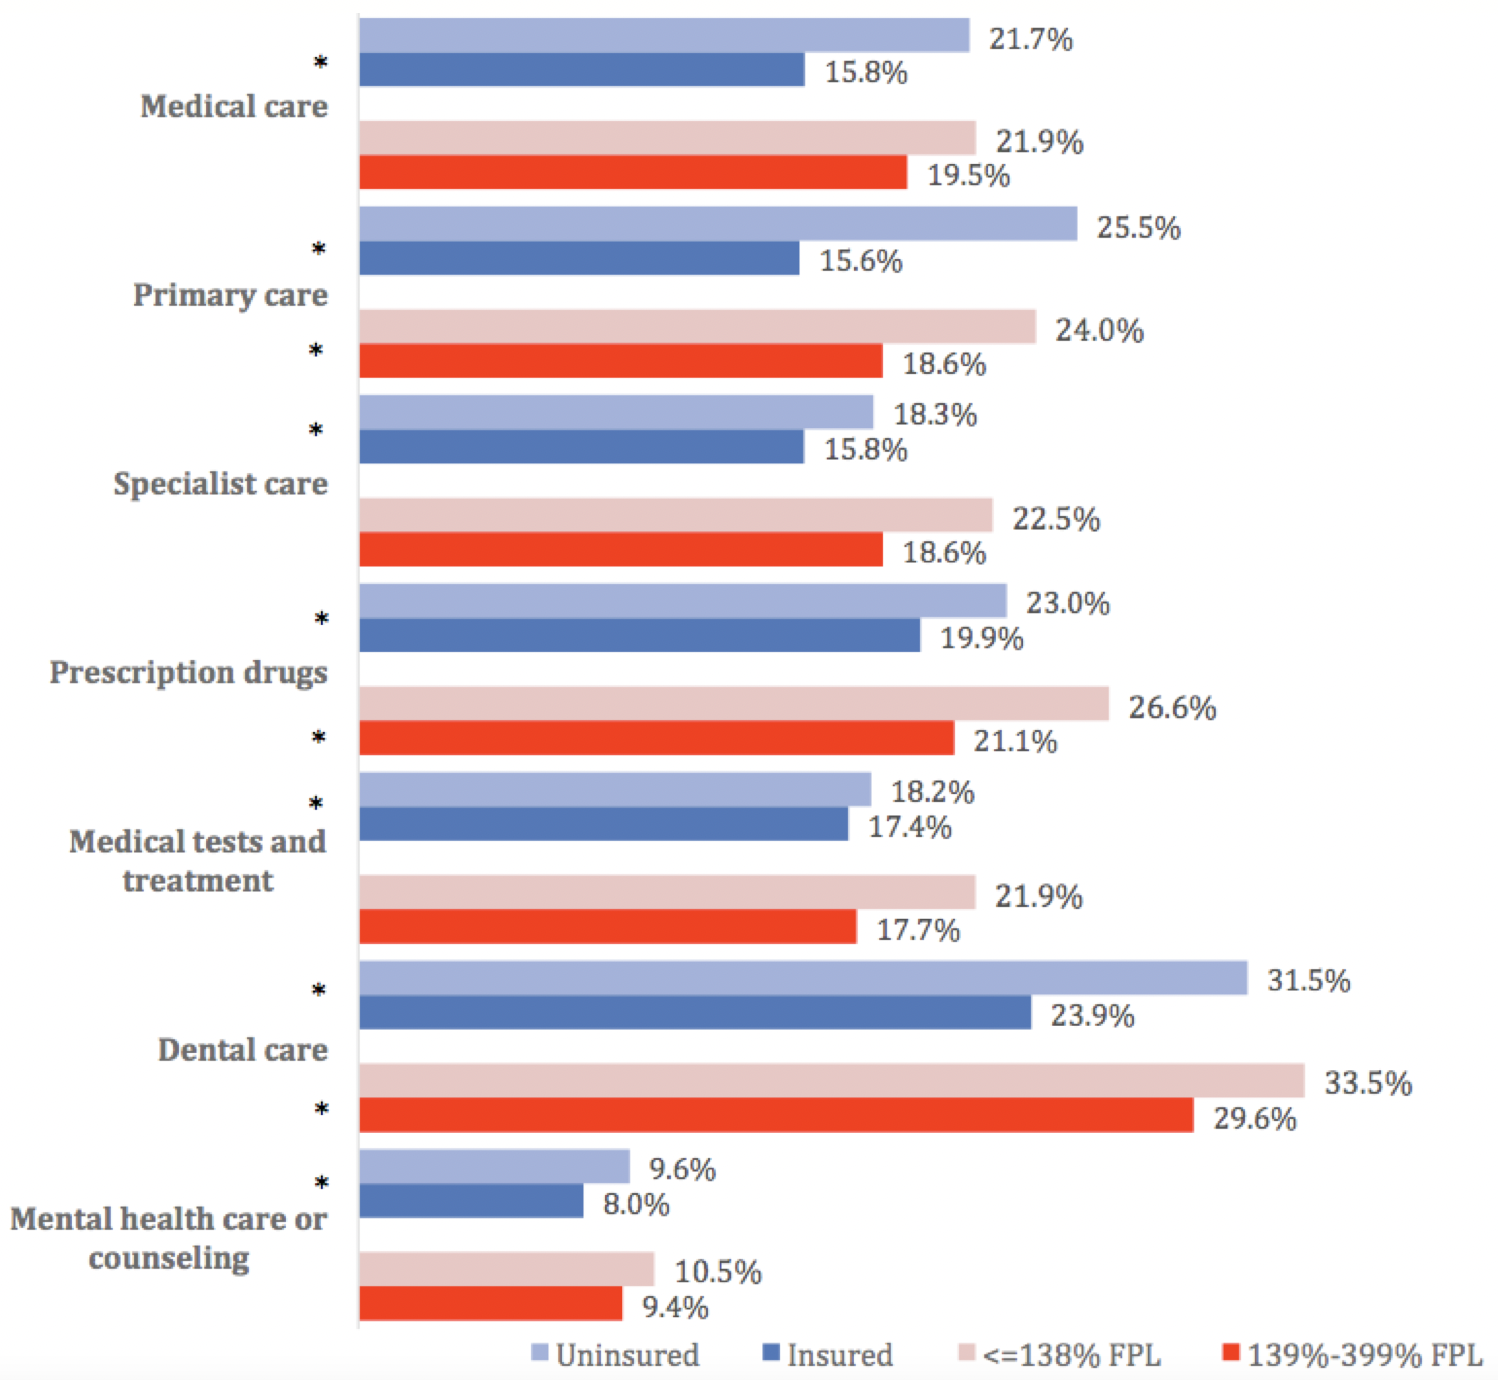
We wanted to get a current picture of the affordability of a variety of services for adult Texans who were insured and uninsured and for those with very low incomes (at or below 138% of the federal poverty level (FPL) or $33,465 for a family of 4) and those with low to moderate incomes (139- 400% FPL or $33,708 to $97,000 for a family of 4). The chart on page 6 contains this data.
With regard to insurance status, there is a significant difference in the percentage of uninsured respondents who skipped medical care, primary care, specialty care, and dental care compared to their insured counterparts. When income level is considered, the lowest income respondents reported significantly higher rates of skipping primary care, prescription drugs, and dental care than those with higher incomes.
Chart 5 — Skipped Health Services by Insurance Status and Income Level, September 2015
Conclusions
More Texans are able to afford health care: The data show that those who are uninsured and those with lower incomes struggle with affordability of health care more than their insured and higher income counterparts. This was true in both 2013 and 2015, and is not likely to change. Affordability of health care has always been correlated with insurance status and income. But, as we reported in Issue Brief #16, the uninsured rate among adult Texans dropped from 23.5% to 18.5% between September 2013 and September 2015. This 5 percentage point drop in the rate of uninsured means that a larger share of Texans are now among those with fewer affordability problems.
Uninsured Texans are experiencing fewer affordability problems in 2015 than in 2013: Whether measured by inability to pay bills or skipping services, on the whole, uninsured Texans reported fewer problems with affordability in 2015. This reduction in unaffordability occurred despite a steady increase in the price of medical services in the U.S. between 2013 and 2015. While our data does not explain why this is happening, there are a number of factors we should consider. First, the economy in Texas and the US improved between 2013 and 2015, which might have helped the uninsured pay for care. Second, the increased number of insured patients may be reducing the burden of uncompensated care for health care providers, enabling them to offer more charitable care to the remaining uninsured. Third, the billions of dollars invested across Texas in DSRIP projects through the 1115 Medicaid waiver may have enabled more uninsured and low income people to access affordable services.
Juxtaposing mental health and dental services: It is interesting that Texans reported the least problems with affordability of mental health care, regardless of insurance status or income level. There is ample data showing that Texas is under-resourced in terms of mental health services as measured by per capita expenditures and professionals. Perhaps the stigma associated with mental illness suppressed the response to the survey question related to mental health care or counseling, a phenomenon often labeled as “social desirability bias.” At the other extreme, we note that dental care is reported to be the service most likely to be skipped due to cost by all groups. The connection between oral health and overall health status is well documented, yet we often regard dental care as an “extra” rather than an essential health service. This is reflected in the fact that most health plans, including Marketplace plans, offer coverage for dental care only as an add-on. We would do well to consider whether basic dental care should be among the preventive care services included in a basic health plan (doing so would increase the cost of insurance).
Looking Ahead
We will continue to analyze and report on the 2015 data to understand the characteristics and experiences of newly insured Texans and those who remain uninsured. In 2016, we will survey again and gain knowledge about the impact of the third open enrollment period and the experiences of Texans with their Marketplace plans.
Methodology
Each quarter’s HRMS sample of nonelderly adults is drawn from active KnowledgePanel® members to be representative of the US population. In the first quarter of 2013, the HRMS provided an analysis sample of about 3,000 nonelderly (age 18–64) adults. After that, the HRMS sample was expanded to provide analysis samples of roughly 7,500 nonelderly adults, with oversamples added to better track low-income adults and adults in selected state groups based on (1) the potential for gains in insurance coverage in the state under the ACA (as estimated by the Urban Institute’s microsimulation model) and (2) states of specific interest to the HRMS funders.
Although fresh samples are drawn each quarter, the same individuals may be selected for different rounds of the survey. Because each panel member has a unique identifier, it is possible to control for the overlap in samples across quarters.
For surveys based on Internet panels, the overall response rate incorporates the survey completion rate as well as the rates of panel recruitment and panel participation over time. The American Association for Public Opinion Research (AAPOR) cumulative response rate for the HRMS is the product of the panel household recruitment rate, the panel household profile rate, and the HRMS completion rate—roughly 5 percent each quarter.
While low, this response rate does not necessarily imply inaccurate estimates; a survey with a low response rate can still be representative of the sample population, although the risk of nonresponse bias is, of course, higher.
All tabulations from the HRMS are based on weighted estimates. The HRMS weights reflect the probability of sample selection from the KnowledgePanel® and post-stratification to the characteristics of nonelderly adults and children in the United States based on benchmarks from the Current Population Survey and the Pew Hispanic Center Survey. Because the KnowledgePanel® collects in-depth information on panel members, the post-stratification weights can be based on a rich set of measures, including gender, age, race/ethnicity, education, household income, homeownership, Internet access, primary language (English/Spanish), residence in a metropolitan area, and region. Given the many potential sources of bias in survey data in general, and in data from Internet-based surveys in particular, the survey weights for the HRMS likely reduce, but do not eliminate, potential biases.
The design effect for the Texas data in March 2015 is 2.243 and the MOE is +/- 3.7. The survey fielded from September 1-25.

