
Download the full issue brief here.
In September 2013, as the nation prepared for the launch of the Affordable Care Act’s Health Insurance Marketplace, Texans were surveyed to learn about their recent experiences with health care and health insurance and their expectations going forward. This Issue Brief describes Texans’ experiences obtaining and paying for a variety of health services during the preceding year and the satisfaction levels of insured Texans with the quality and cost of their health plans. These data show that, on the eve of the launch of healthcare.gov, many Texans were struggling to pay for basic health services. Even those with health insurance reported dissatisfaction with the cost and availability of services. And most Texans expected 2014 to be more of the same.
About the Survey
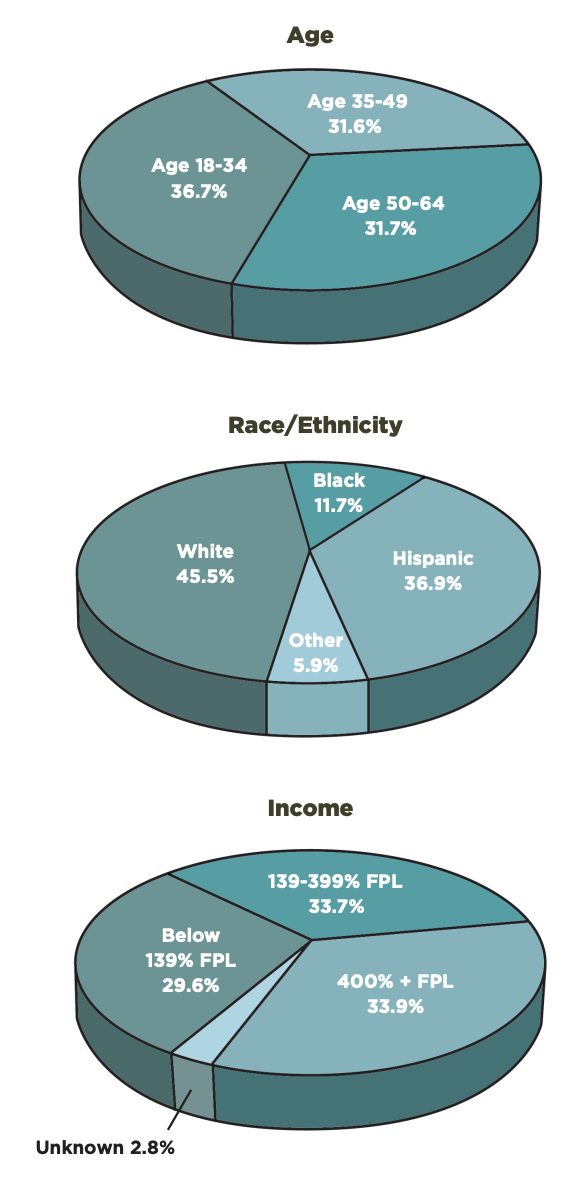
The Health Reform Monitoring Survey (HRMS) is a quarterly survey of adults ages 18-64 that began in 2013. It is designed to provide timely information on implementation issues under the Affordable Care Act (ACA) and changes in health insurance coverage and related health outcomes. HRMS provides quarterly data on health insurance coverage, access and use of health care, health care affordability, and self-reported health status. The HRMS was developed by the Urban Institute, conducted by GfK and jointly funded by the Robert Wood Johnson Foundation, the Ford Foundation, and the Urban Institute. Rice University’s Baker Institute and the newly formed Episcopal Health Foundation are partnering to fund and report on key factors about Texans obtained from an expanded representative sample of 1,595 Texas residents (HRMS-Texas). Additional information about the demographics of the Texas sample can be found on page 9.
This Issue Brief is a summary of data extracted from the HRMS Survey in Texas administered in September 2013. We will continue to report on survey data through additional Issue Briefs and future surveys.
Affordability of Health Services Pre-ACA
A primary goal of the ACA is to increase access to health care by mandating changes in the health insurance industry aimed at enabling more people to buy comprehensive coverage at affordable prices. The HRMS-Texas data show prior to the opening of the Health Insurance Marketplace, Texans needed more affordable care. When insured and uninsured Texans were asked about their ability to pay for health services in the preceding year, both groups reported gaps in affordability. Although people without insurance were most often unable to afford services, the data show that those with health insurance also experienced difficulties.
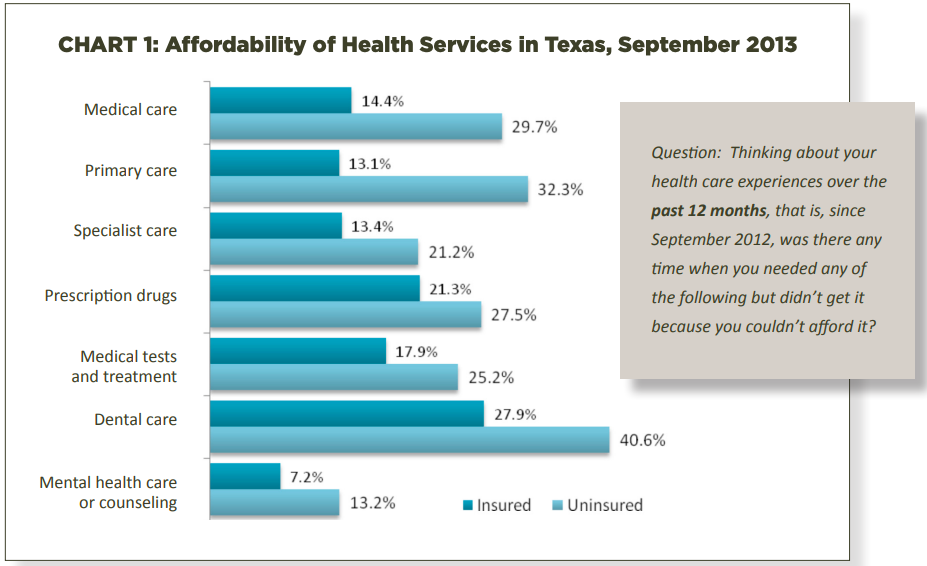
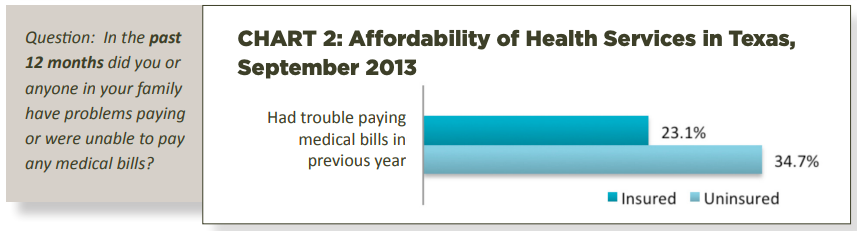
Over one-third of families without insurance experienced problems paying medical bills during the preceding year. Perhaps more surprising is that 23% of families with insurance had trouble paying medical bills, confirming that affordability was a concern for everyone before the opening of the Health Insurance Marketplace. While all respondents had more trouble paying for dental care than any other service, the Marketplace plans are not required to include coverage for dental care for adults.
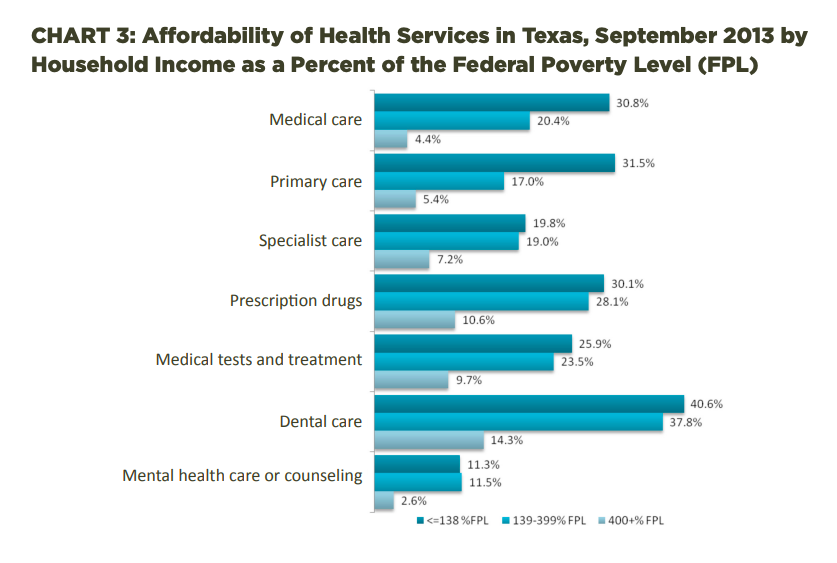
The ACA was intended to help families in different income categories obtain affordable comprehensive coverage through different mechanisms. For the lowest income families, those with earnings below 138% of the federal poverty level (family of three with annual income below $27,000), Medicaid expansion is the mechanism. For families with incomes between 139% and 399% of the federal poverty level (family of three with annual income between $27,000 and $79,000), subsidized coverage through the Marketplace is the mechanism. And for the highest income families, the insurance market reforms are the mechanism. The average Texas household has 2.8 people and a median annual income just under $52,000.
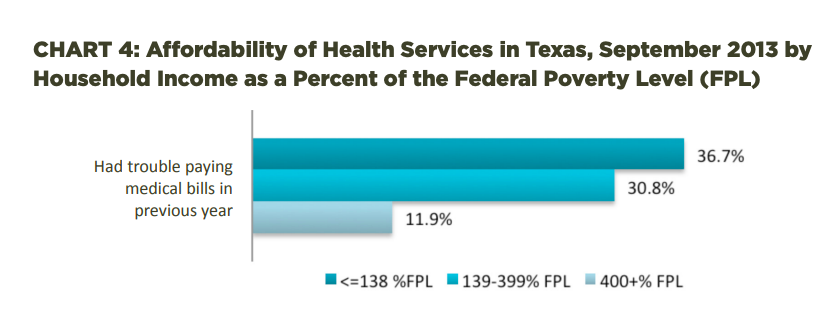
As shown in Charts 3 and 4, families in the low and middle income categories experienced significant problems paying for health care at rates three or more times higher than those in the highest income category. The lowest income Texans are unlikely to see significant changes in 2014 because Texas opted not to expand Medicaid. For the middle income families, there are more than 40 comprehensive plans available to Texans through the Marketplace, with subsidies based on family size and household income.
Insured Texans’ Satisfaction With Health Plans Pre-ACA
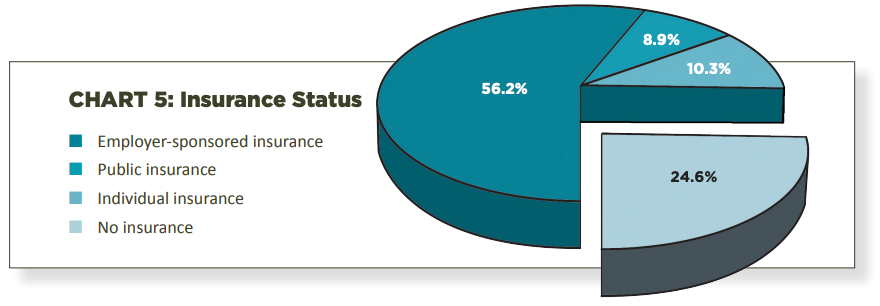
Although Texas has the highest rate of uninsured residents in the United States, three-quarters of those surveyed had health insurance in September 2013. Following national trends, the majority of respondents (56.2%) were covered by employer sponsored insurance, including public and private employers and the military and the VA. Almost 9% were covered by public insurance (primarily Medicaid or Medicare), and 10.3% had purchased health plans through the individual insurance market.
The Health Insurance Marketplace was created to provide affordable options for the uninsured and to improve the individual insurance market, which, as these numbers show, has failed to meet the needs of those without access to employer sponsored plans. We will learn over the next few years whether the Marketplace achieves this objective.
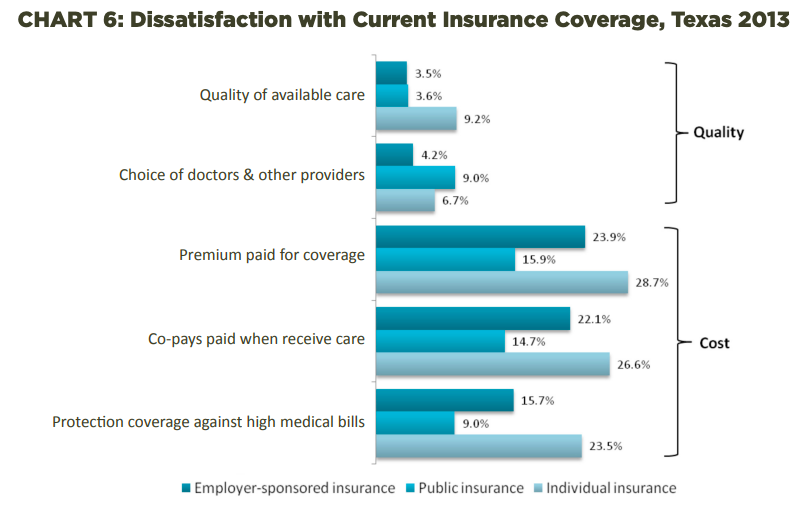
As Chart 6 shows, Texans were generally satisfied with the quality of their health plans, but were not satisfied with the cost. Respondents with all types of insurance felt that their plans offered high quality care and provider choice. Texans who purchased individual insurance plans reported the greatest dissatisfaction with their health plans, especially regarding the cost of premiums and co-pays. They also reported the most dissatisfaction of any group with the quality of available care and their protection against high medical bills. A goal of the Health Insurance Marketplace is to provide these people with access to the same quality plans as those offered by employers at more affordable prices than were available in the pre-ACA insurance market.
Those insured by public insurance plans, such as Medicare and Medicaid, recorded relatively low rates of dissatisfaction with their plans. Public insurance beneficiaries generally have the lowest out of pocket expenditures, so it is not surprising that this group reported the least dissatisfaction with costs. However, they reported the greatest dissatisfaction of all groups with provider choices. This may be a reflection of the fact that some providers will not accept patients with public plans due to lower reimbursement rates than they receive for treating privately insured patients.
Looking Ahead to 2014
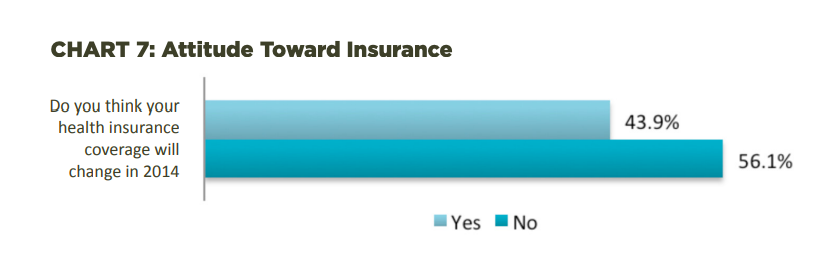
This survey asked Texas respondents about their expectations of the impact of the ACA on their own health care and health insurance going forward. Insured respondents were asked whether they expected changes in their own insurance in 2014. As Chart 7 indicates, almost half of insured Texans expected change in 2014. The expectation of change reported by Texans is consistent with the uncertainty and anxiety many Americans feel as we embark on a new health insurance system. Through subsequent HRMS-Texas surveys, we will measure and report on the changes as experienced by Texans and report the data in future Issue Briefs.
Characteristics of Survey Participants
Methodology
Each quarter’s HRMS sample of nonelderly adults is drawn from active KnowledgePanel® members to be representative of the US population. In the first quarter of 2013, the HRMS provides an analysis sample of about 3,000 nonelderly (age 18–64) adults. After that, the HRMS sample was expanded to provide analysis samples of roughly 7,500 nonelderly adults, with oversamples added to better track low-income adults and adults in selected state groups based on (1) the potential for gains in insurance coverage in the state under the ACA (as estimated by the Urban Institute’s microsimulation model) and (2) states of specific interest to the HRMS funders. This Issue Brief reports on findings from data from an oversample using the KnowledgePanel® for Texas, referred to as the HRMS-Texas.
Although fresh samples are drawn each quarter, the same individuals may be selected for different rounds of the survey. Because each panel member has a unique identifier, it is possible to control for the overlap in samples across quarters.
For surveys based on Internet panels, the overall response rate incorporates the survey completion rate as well as the rates of panel recruitment and panel participation over time. The American Association for Public Opinion Research (AAPOR) cumulative response rate for the HRMS is the product of the panel household recruitment rate, the panel household profile rate, and the HRMS completion rate—roughly 5 percent each quarter.
While low, this response rate does not necessarily imply inaccurate estimates; a survey with a low response rate can still be representative of the sample population, although the risk of nonresponse bias is, of course, higher.
All tabulations from the HRMS are based on weighted estimates. The HRMS weights reflect the probability of sample selection from the KnowledgePanel® and post-stratification to the characteristics of nonelderly adults and children in the United States based on benchmarks from the Current Population Survey and the Pew Hispanic Center Survey. Because the KnowledgePanel® collects in-depth information on panel members, the poststratification weights can be based on a rich set of measures, including gender, age, race/ ethnicity, education, household income, homeownership, Internet access, primary language (English/Spanish), residence in a metropolitan area, and region. Given the many potential sources of bias in survey data in general, and in data from Internet-based surveys in particular, the survey weights for the HRMS likely reduce, but do not eliminate, potential biases.
The September 2013 HRMS has a design effect of 1.47 for nonelderly adults and a sampling margin of error for a 50 percent statistic with 95 percent confidence of +/- 1.3 for the nonelderly adult sample.
The sample size for Texas was 1,595 respondents with a design effect of 2.54.

