
Thanks to the “shale revolution,” the US is well on its way to becoming the world’s top oil and gas producer and a major exporter of both products. As such, the country does and will continue to influence global energy markets by providing greater predictability and security of supply. Due to increased use of natural gas and renewables, the US has also been a leader in reducing CO2 emissions in its electricity sector. However, as important as these accomplishments are, the US will only play second fiddle to the developing world, especially Asia, which will shape energy demand for the foreseeable future.
This brief explores the challenges current energy demand trends pose for policymakers around the globe in trying to meet two—often contradictory—goals: 1) raising the economic prospects for billions in the less economically developed world, which implies an increase in demand for energy (the most affordable and accessible of which today comes from fossil fuels); and 2) decreasing the use of fossil fuels as part of a global climate change effort.
We examine the trends in energy demand patterns that have been highlighted by three 2018 energy outlooks prepared by the US Energy Information Administration (EIA), the International Energy Agency (IEA), and BP. Despite differences in assumptions,1 all outlooks see the developing world and its policies, economies, and energy consumption patterns as the leading driver affecting future global energy use.2 The outlooks also agree that fossil fuels—coal, oil, and natural gas—will play a significant role in driving economic growth in the developing world through 2040.3
We focus on general trends in fossil energy demand that can be derived from the “business as usual” scenarios in each outlook. As such, our analysis seeks to offer insights and uses these scenarios as a benchmark for assessments of any other scenario under consideration.
Main Trends and Changes to Current Patterns in Energy Demand
According to the U.N. Department of Economic and Social Affairs, the global population is currently at 7.6 billion and will reach 8.6 billion in 2030 and 9.8 billion in 2050. About 90% of this growth will come from Asia and Africa. At the same time, Europe’s population is set to decrease and North America will contribute only about 3% to the global population growth (Table 1).
As the developing world’s population burgeons, countries in Asia and Africa increasingly aspire to eradicate extreme poverty, including energy poverty. Providing additional, affordable energy sources will be at the center of those efforts. This push will first be particularly visible in Asia, as the region continues its fast pace of economic development. Steep growth in African energy demand initially will not contribute as much to overall global demand in absolute terms, given the small size of its current base.
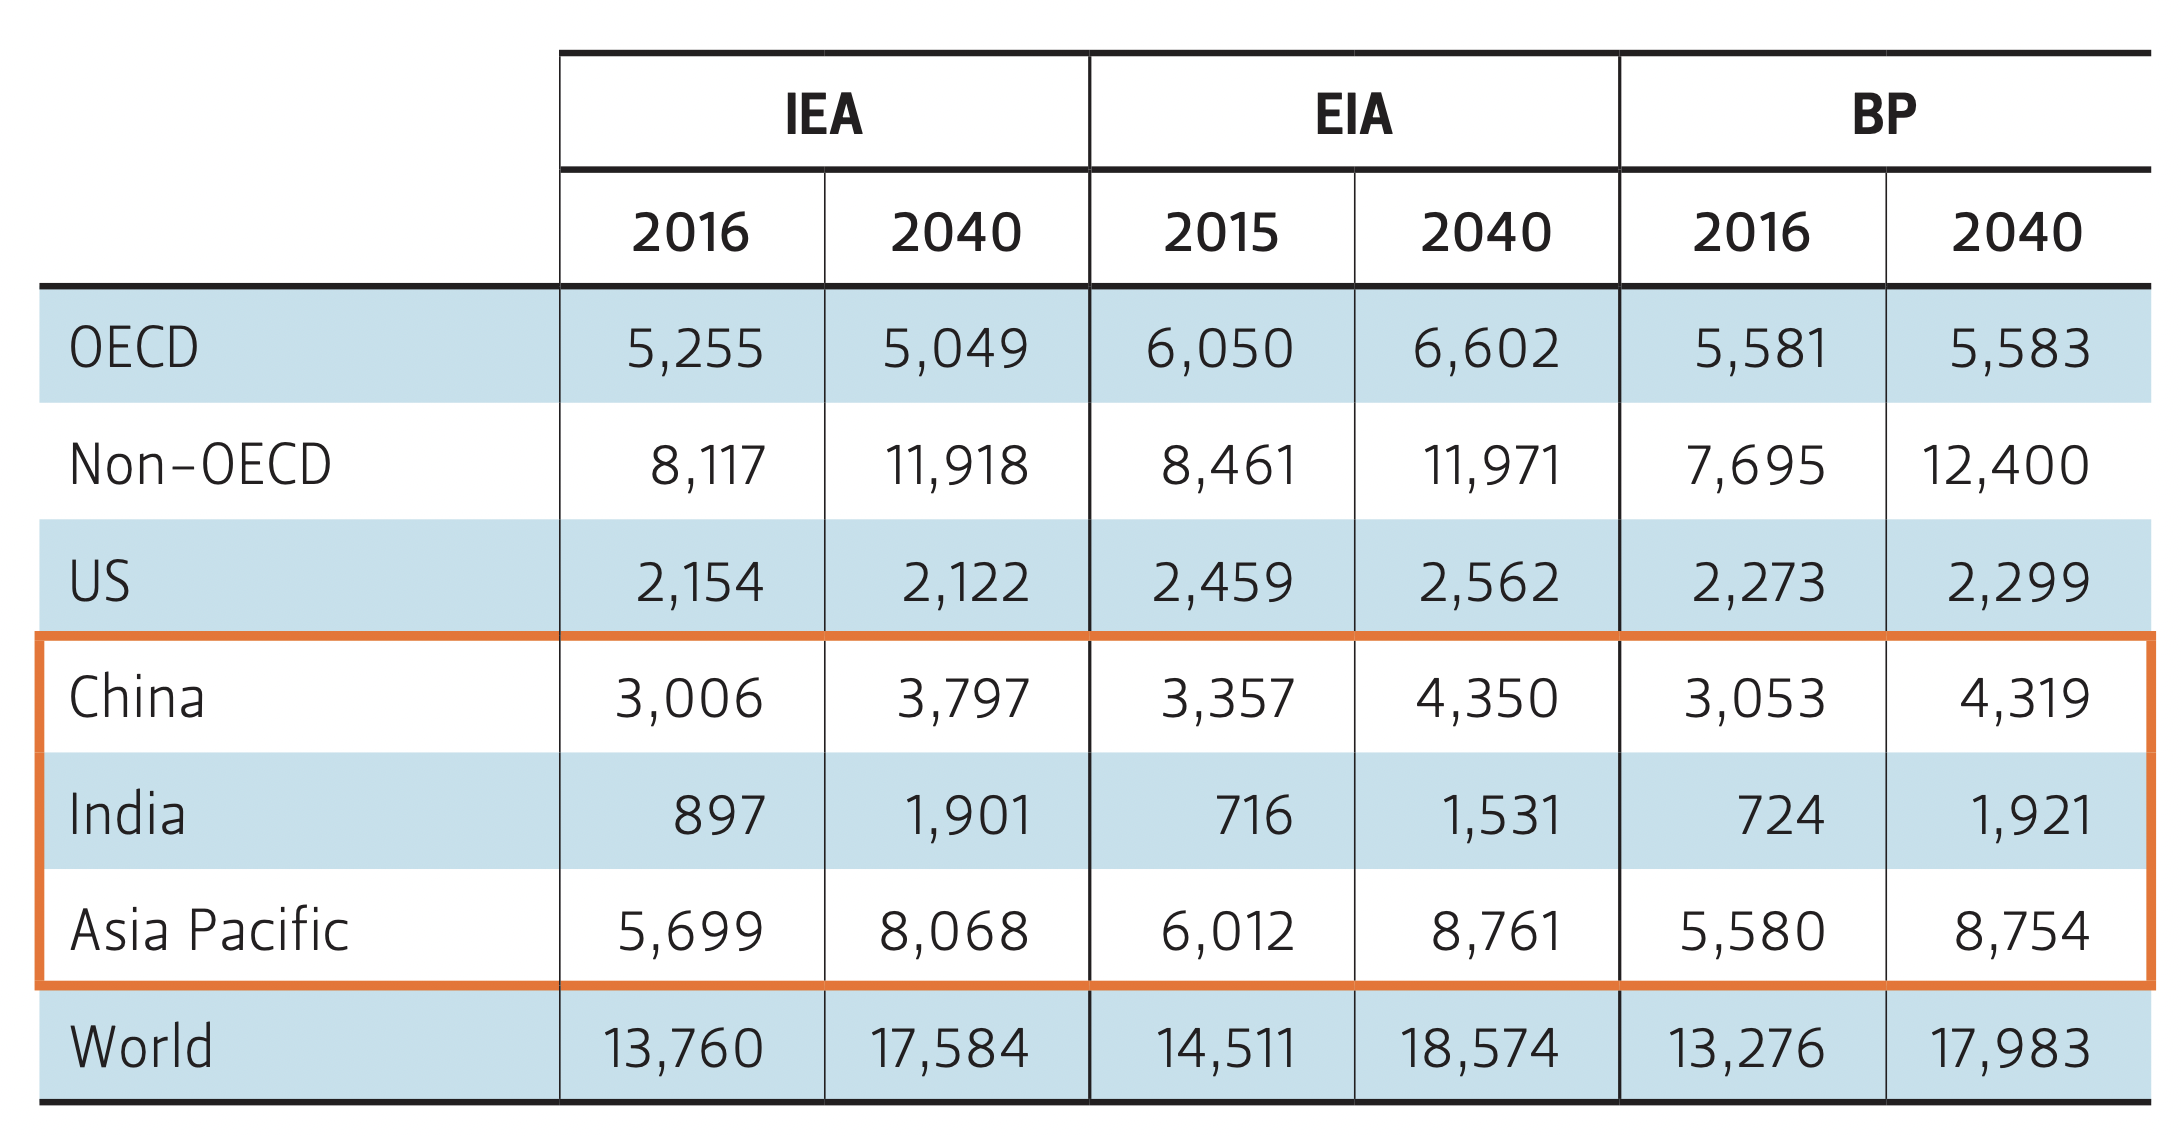
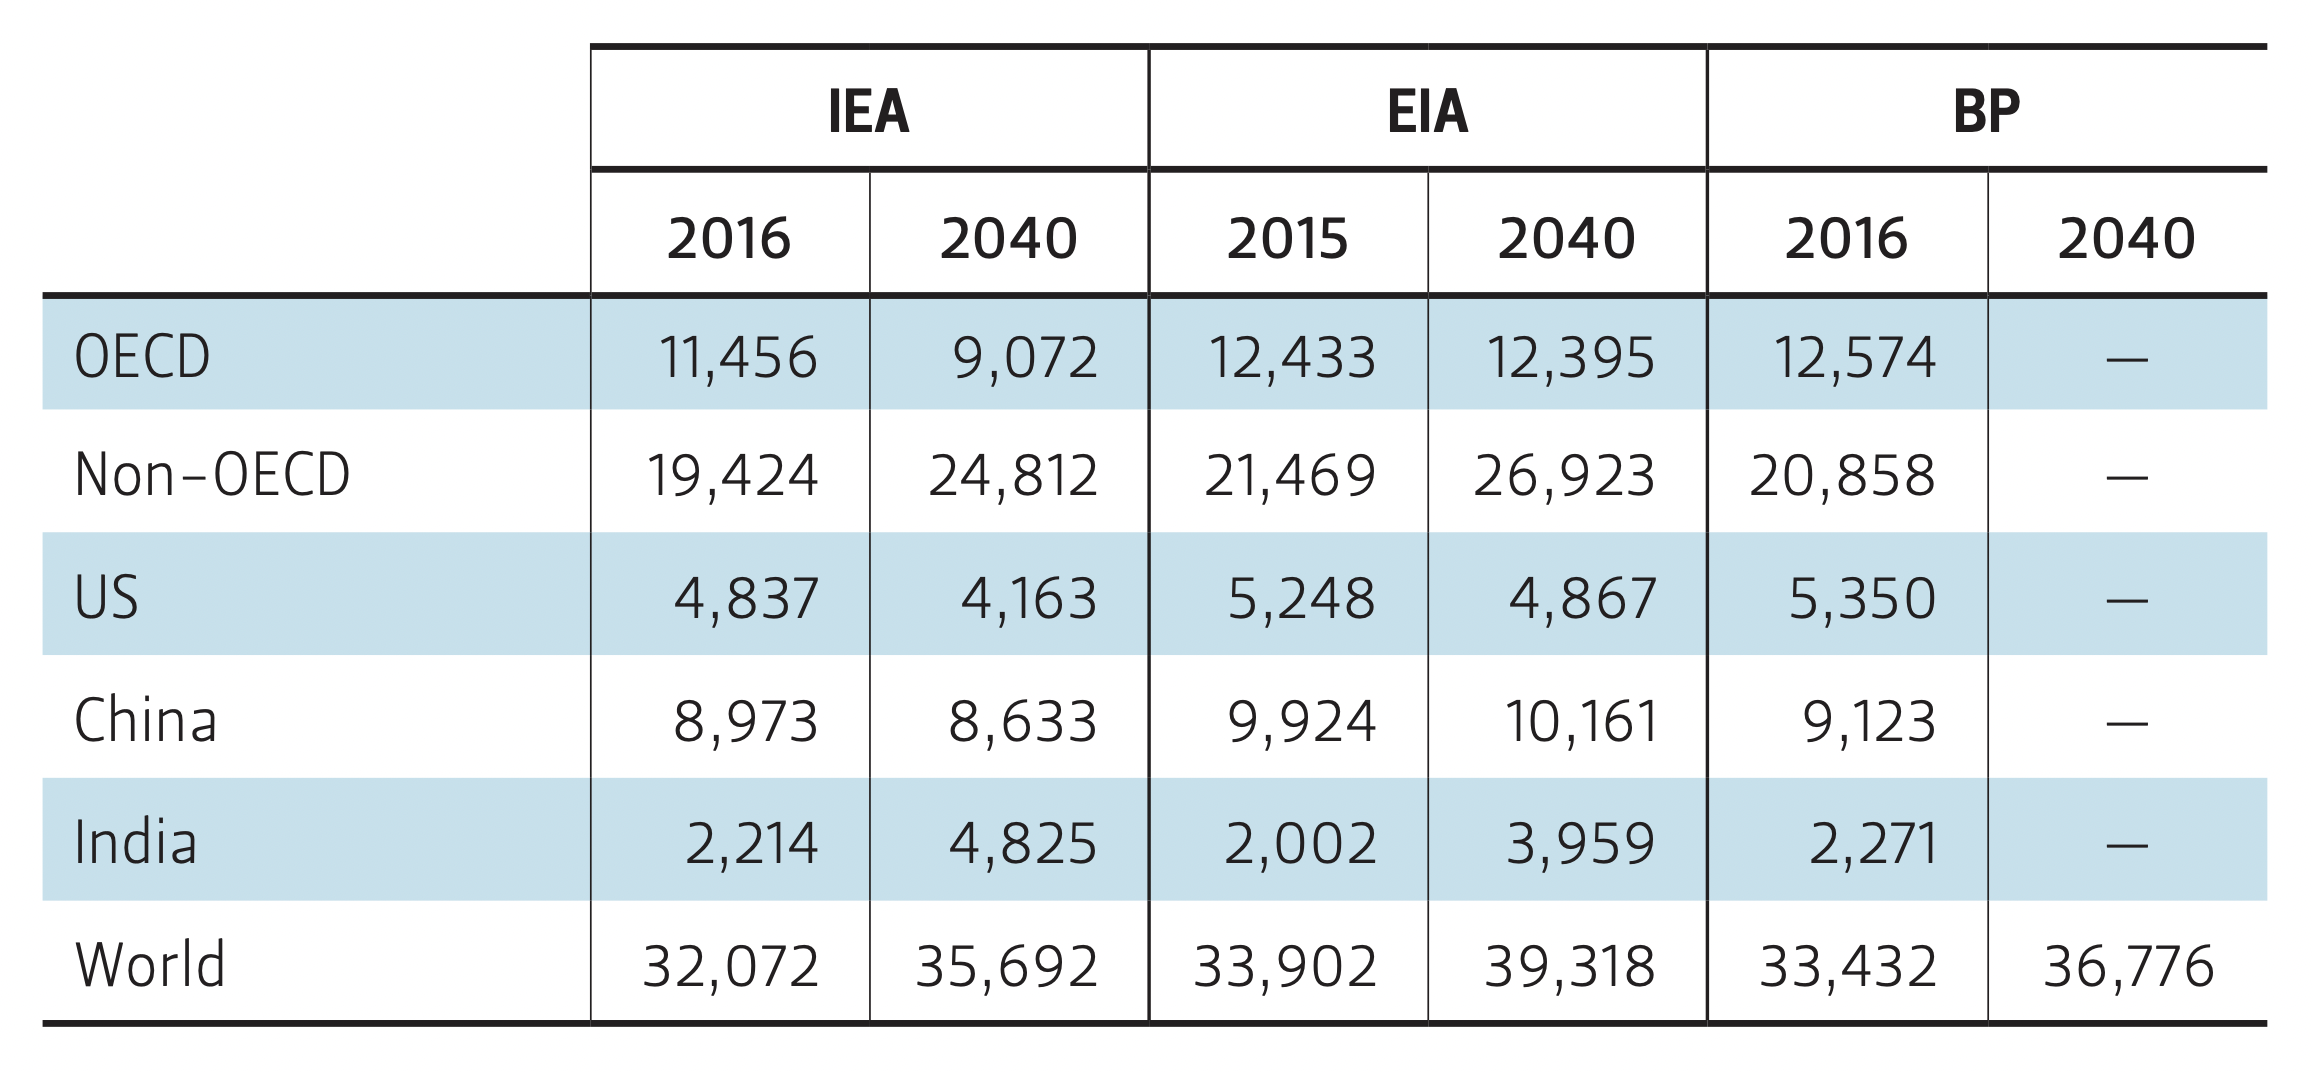
Indeed, all outlooks considered in this brief see Asia Pacific as the main source of demand growth. For example, China and India will account for between two-thirds (per EIA) and three-fourths (per IEA and BP) of the expected growth (Table 2).
Table 1 — Absolute Population Growth Since 2017, in Millions
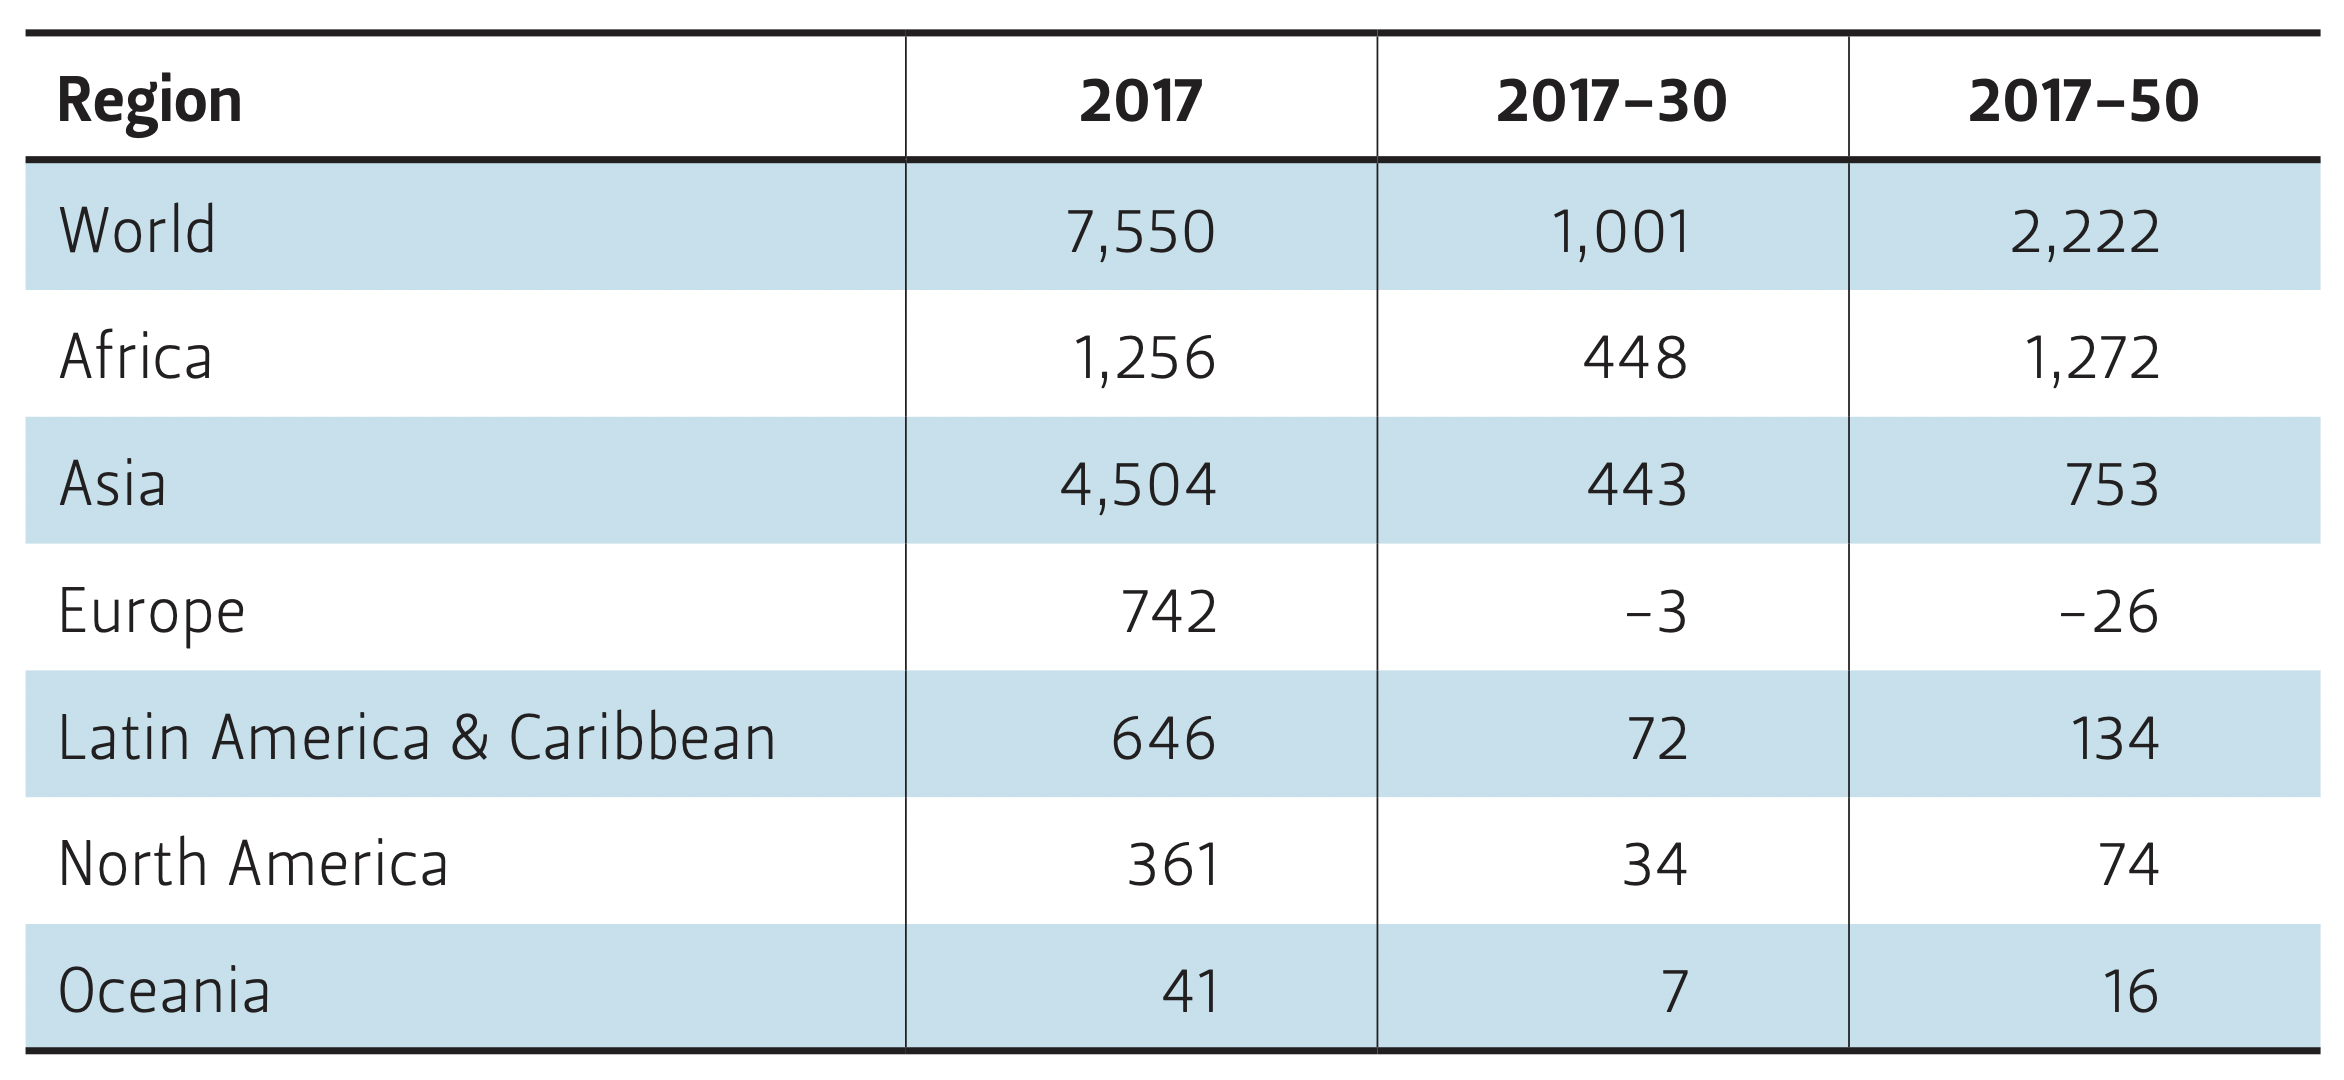
Source United Nations, World Population Prospects: The 2017 Revision (New York: United Nations, 2017).
Countries in Southeast Asia—treated as an aggregate—are the other main sources of growth in energy demand.6 Per IEA, the region will register more than 400 million tonnes of oil equivalent (Mtoe) in additional demand through 2040. This amounts to more than half of China’s (791 Mtoe) or 40% of India’s absolute energy demand growth (1,004 Mtoe).
Meanwhile, energy demand in Organisation for Economic Co-operation and Development (OECD) nations will change by between -4% and 10%, a delta that is swamped by a 40%—or more— climb in non-OECD energy use. The result is between 27% and 35% growth in global energy demand through 2040 (in the base case projections considered in this brief).
Table 2 — Total Energy Demand (MTOE)5
All three outlooks also point to two significant changes in the energy demand growth patterns exhibited by Asia over the past two decades or so.
First, in China, the predicted growth would be significantly smaller than the staggering 300% demand growth the country registered between the 1990s and the current decade (per EIA). The growth will taper off mostly due to efficiency improvements and the changing nature of the growing Chinese economy that increasingly gravitates toward less energy-intensive industrial and service sectors. EIA predicts that annual Chinese demand will grow by 1% per annum through 2040. This is a significant downturn compared to the country’s average 8% annual growth between 2000 and 2012. BP reports a similar trend in China’s projected growth through 2040 (approximately 1.5% per annum), which would be less than one-fourth of the growth experienced in the past two decades.
Second, India stands to emerge as a leading demand growth center, accounting for 20-25% of global demand growth by 2040 (Figure 1). The growth will occur despite some decline in the energy intensity of the country’s economy and is consistent with UN population growth predictions that forecast India surpassing China’s population post-2024.
Demand Growth by Fuel
Despite impressive growth rates in renewables, all three outlooks agree that fossil fuels will continue to be an important, if not predominant, source of energy consumption globally.
Figure 1 — Total Energy Demand by Fuel, OECD vs. Non-OECD Countries
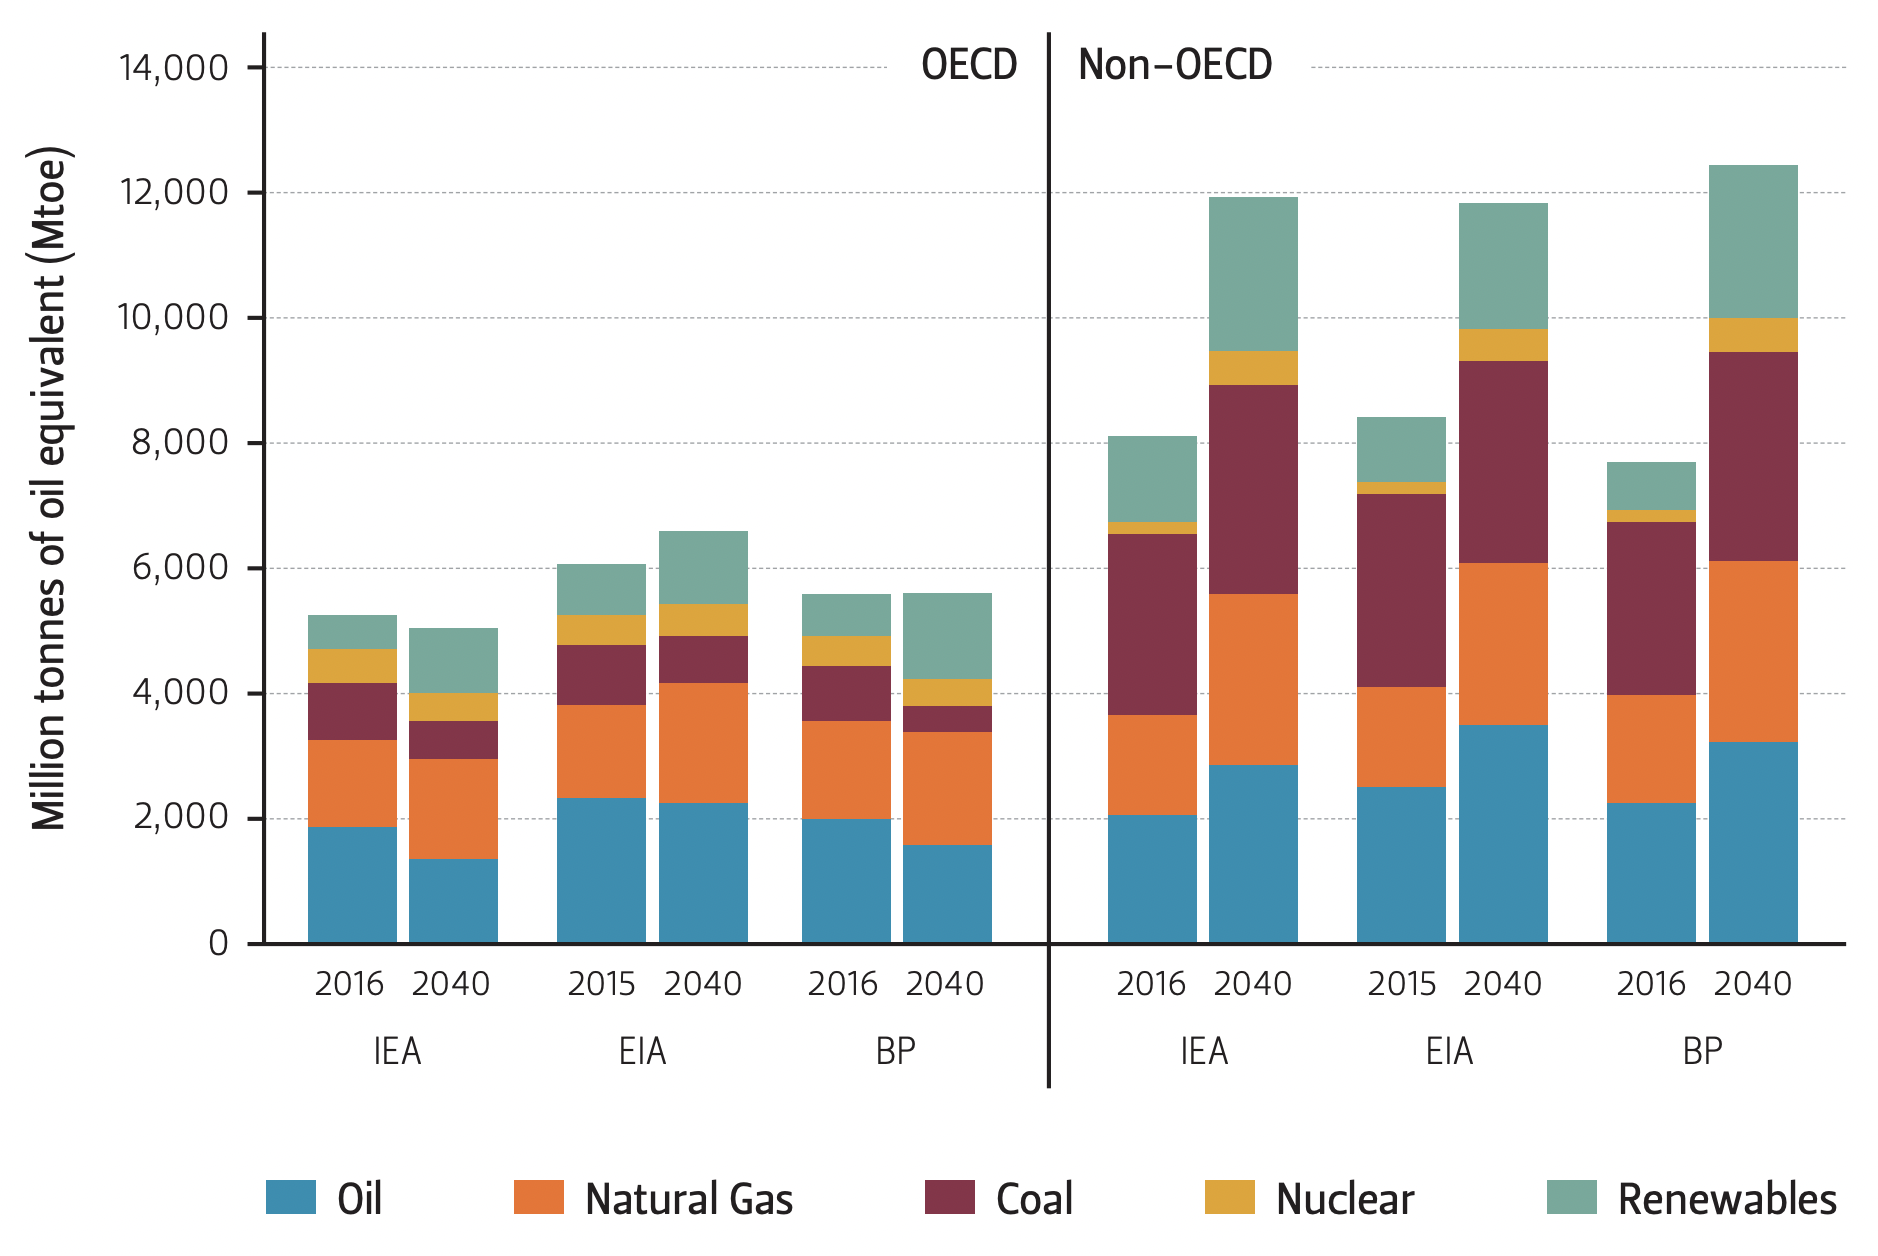
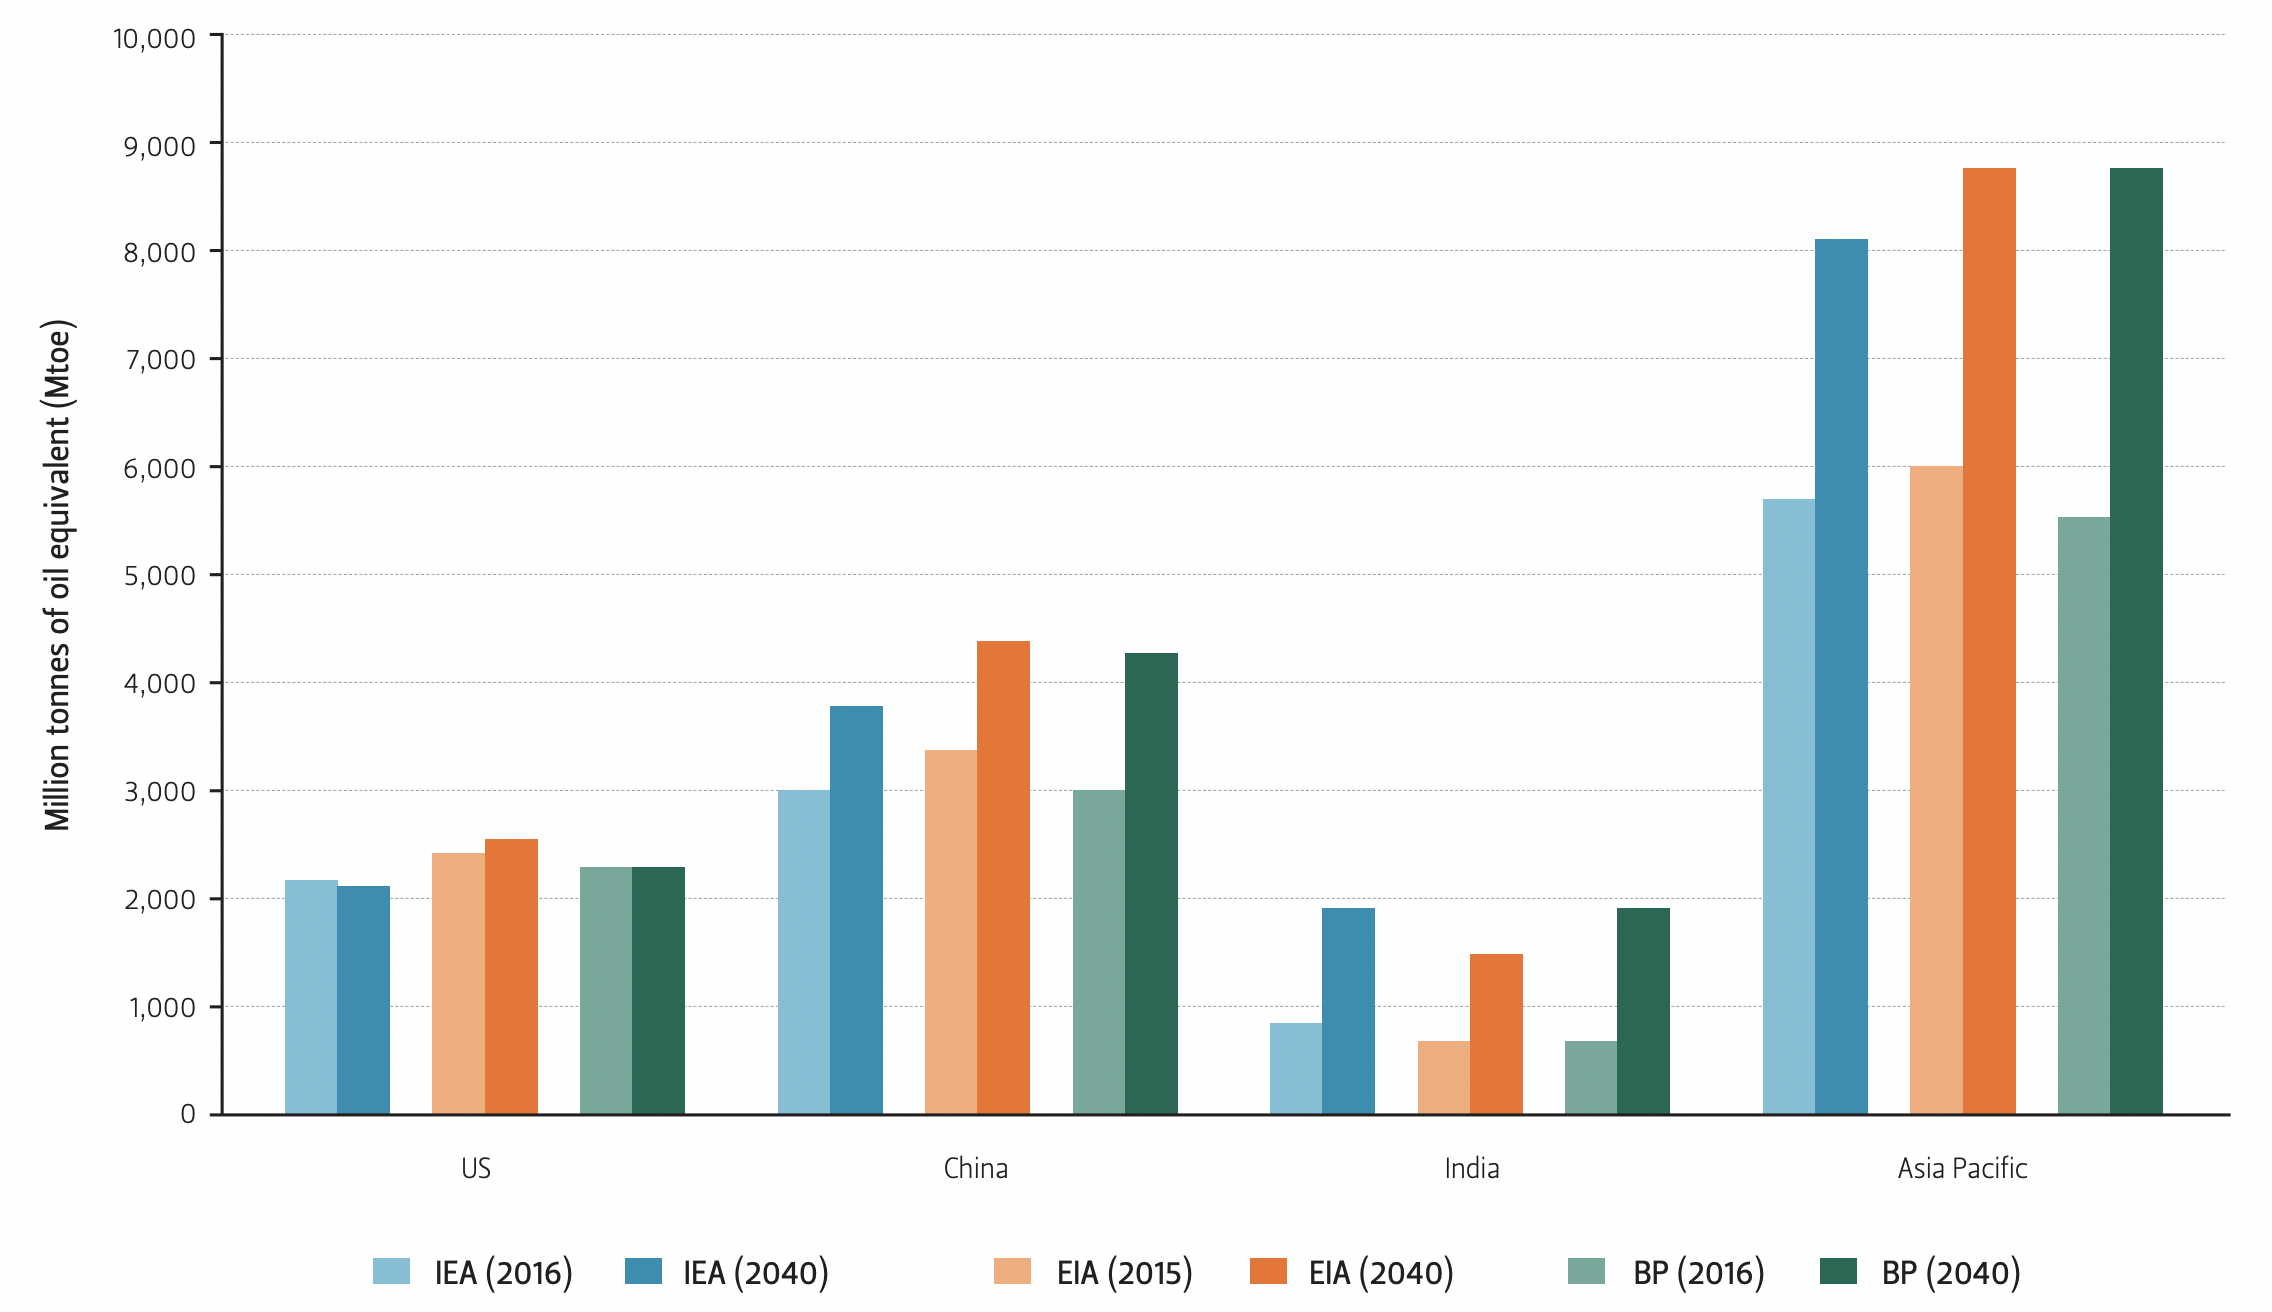
Figure 2 — Total Energy Demand in Selected Regions
Coal
Coal consumption will decline in the developed world as well as in China (Table 3). The fall is attributed to the nature of coal’s use (mostly to fuel electricity generation) and numerous substitutes that are becoming increasingly affordable, characterized by lower carbon footprints, and associated with fewer (if any) air quality concerns. As such, the outlooks see additional electric power demand propelled by economic growth increasingly coming from natural gas and renewable generation (Figure 1).
Even so, this decrease in coal consumption will be matched by an increase in coal use in India (per EIA, a 90% increase in coal demand between 2015 and 2040) and other countries in non-OECD Asia (per EIA, nearly 80% of projected demand growth between 2015 and 2040). Outside of Asia, Africa, the Middle East, and South America are also expected to expand coal capacity, though their absolute demand increases will not be as significant given the low starting base in those regions. Consequently, all outlooks expect global coal consumption to remain at close to current levels. However, as overall global energy demand increases, coal’s share in the primary energy mix is expected to fall (from 27-28% in the base year to 21-22% in 2040, depending on the outlook).
Table 3 — Coal Demand (MTOE)
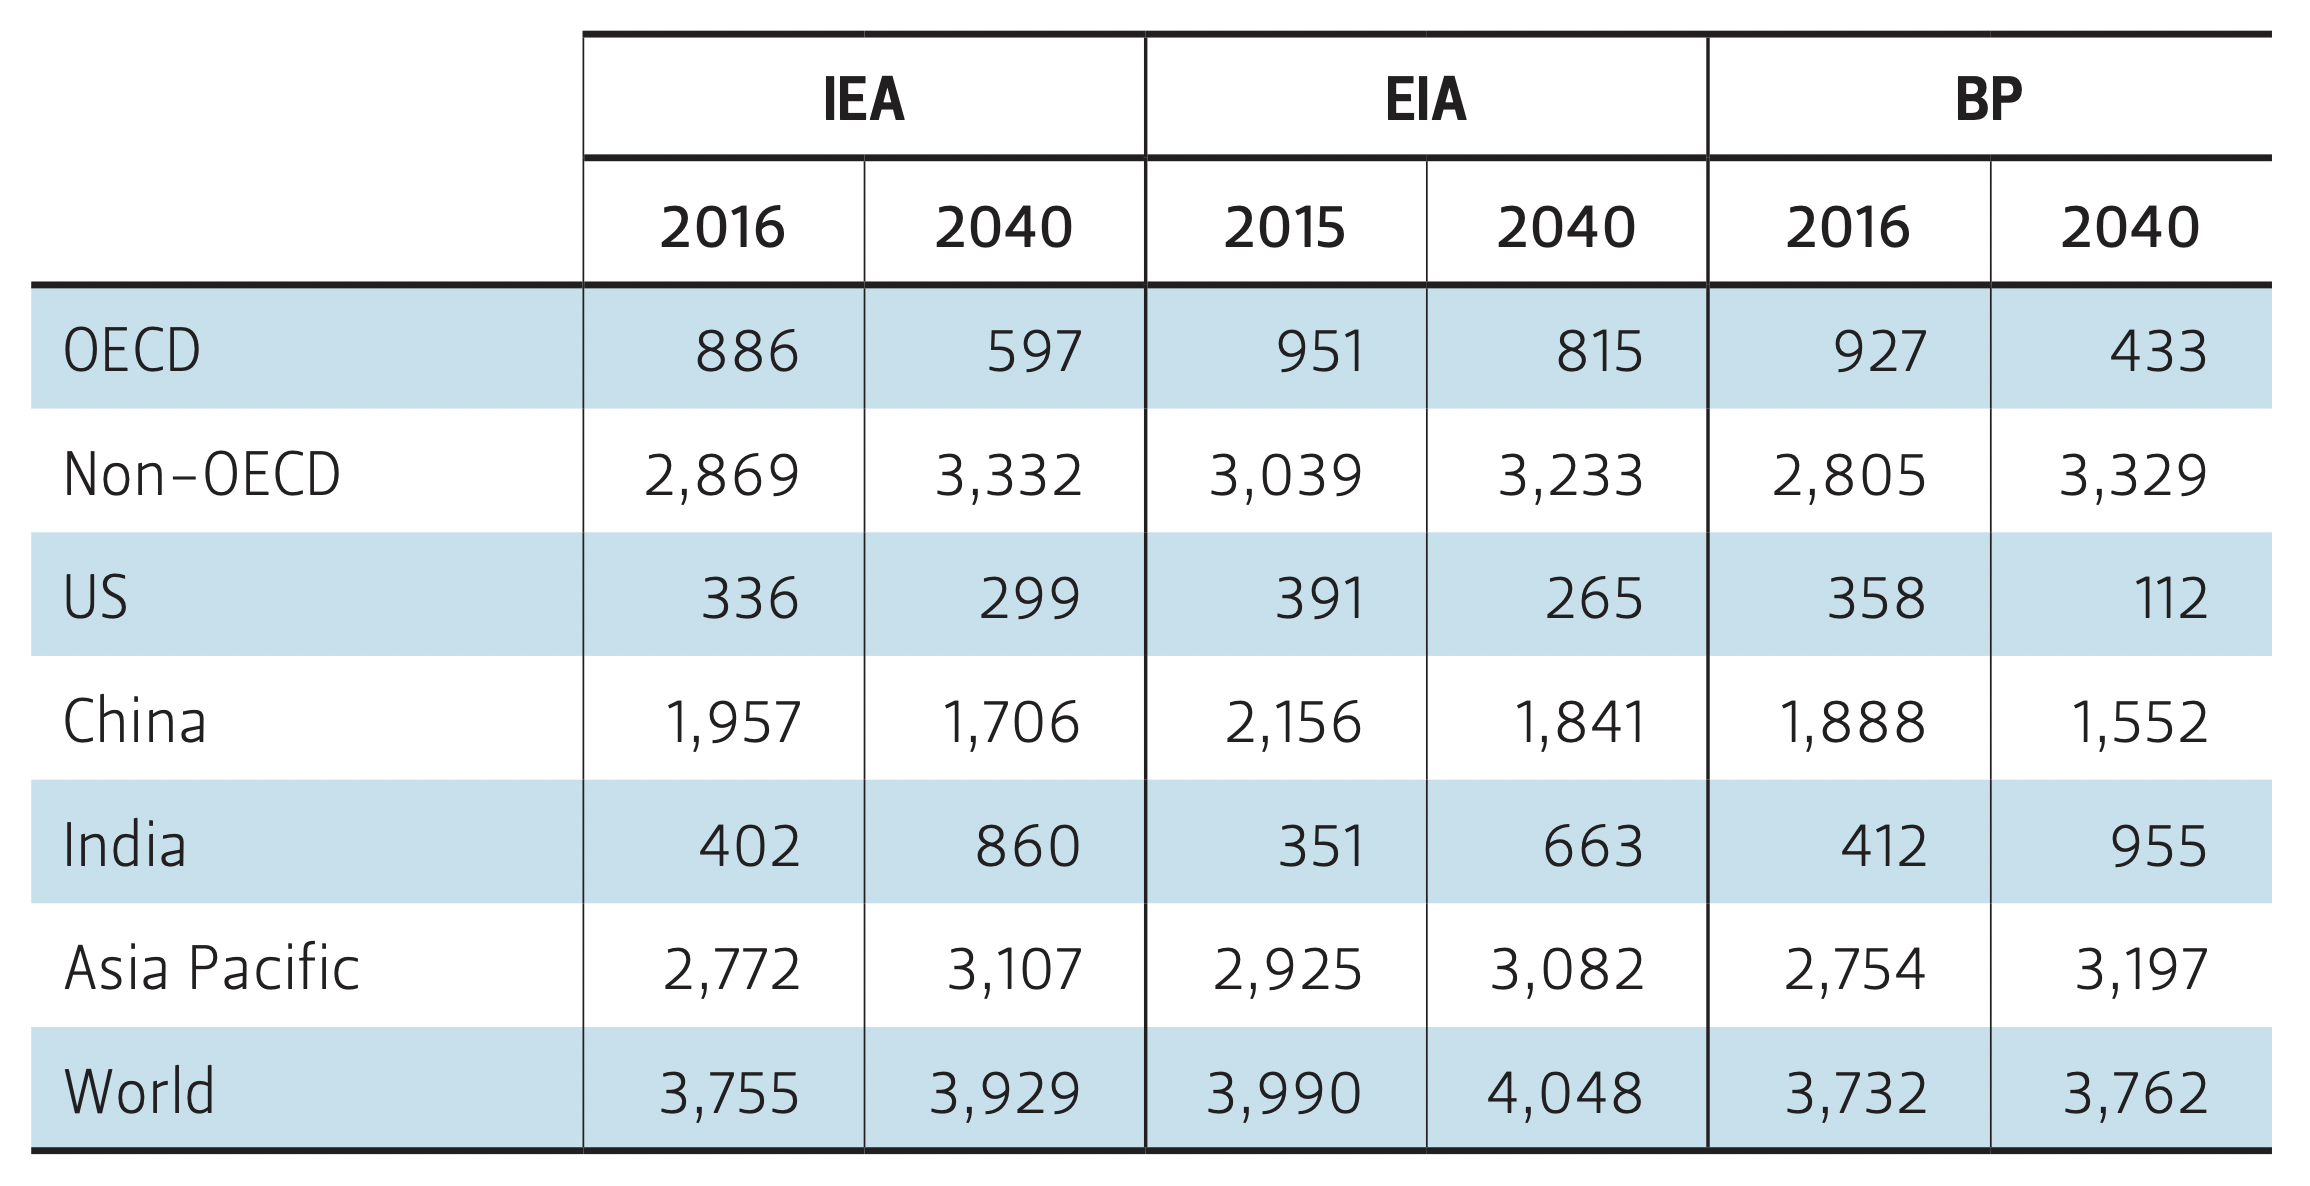
Oil
Oil demand will remain robust until the mid-2020s according to IEA, but growth will be slower afterward due to efficiency and competition from alternative-powered vehicles. Still, oil demand growth is projected to persist given the difficulty in decarbonizing some of the ways in which crude is being used on a large scale, such as air travel, petrochemicals, and shipping. Consistent with the above, outlooks expect overall oil demand to increase by approximately 9 to 17 million barrels daily (mbd) through 2040 (Table 4).
Table 4 — Oil Demand (MBD)
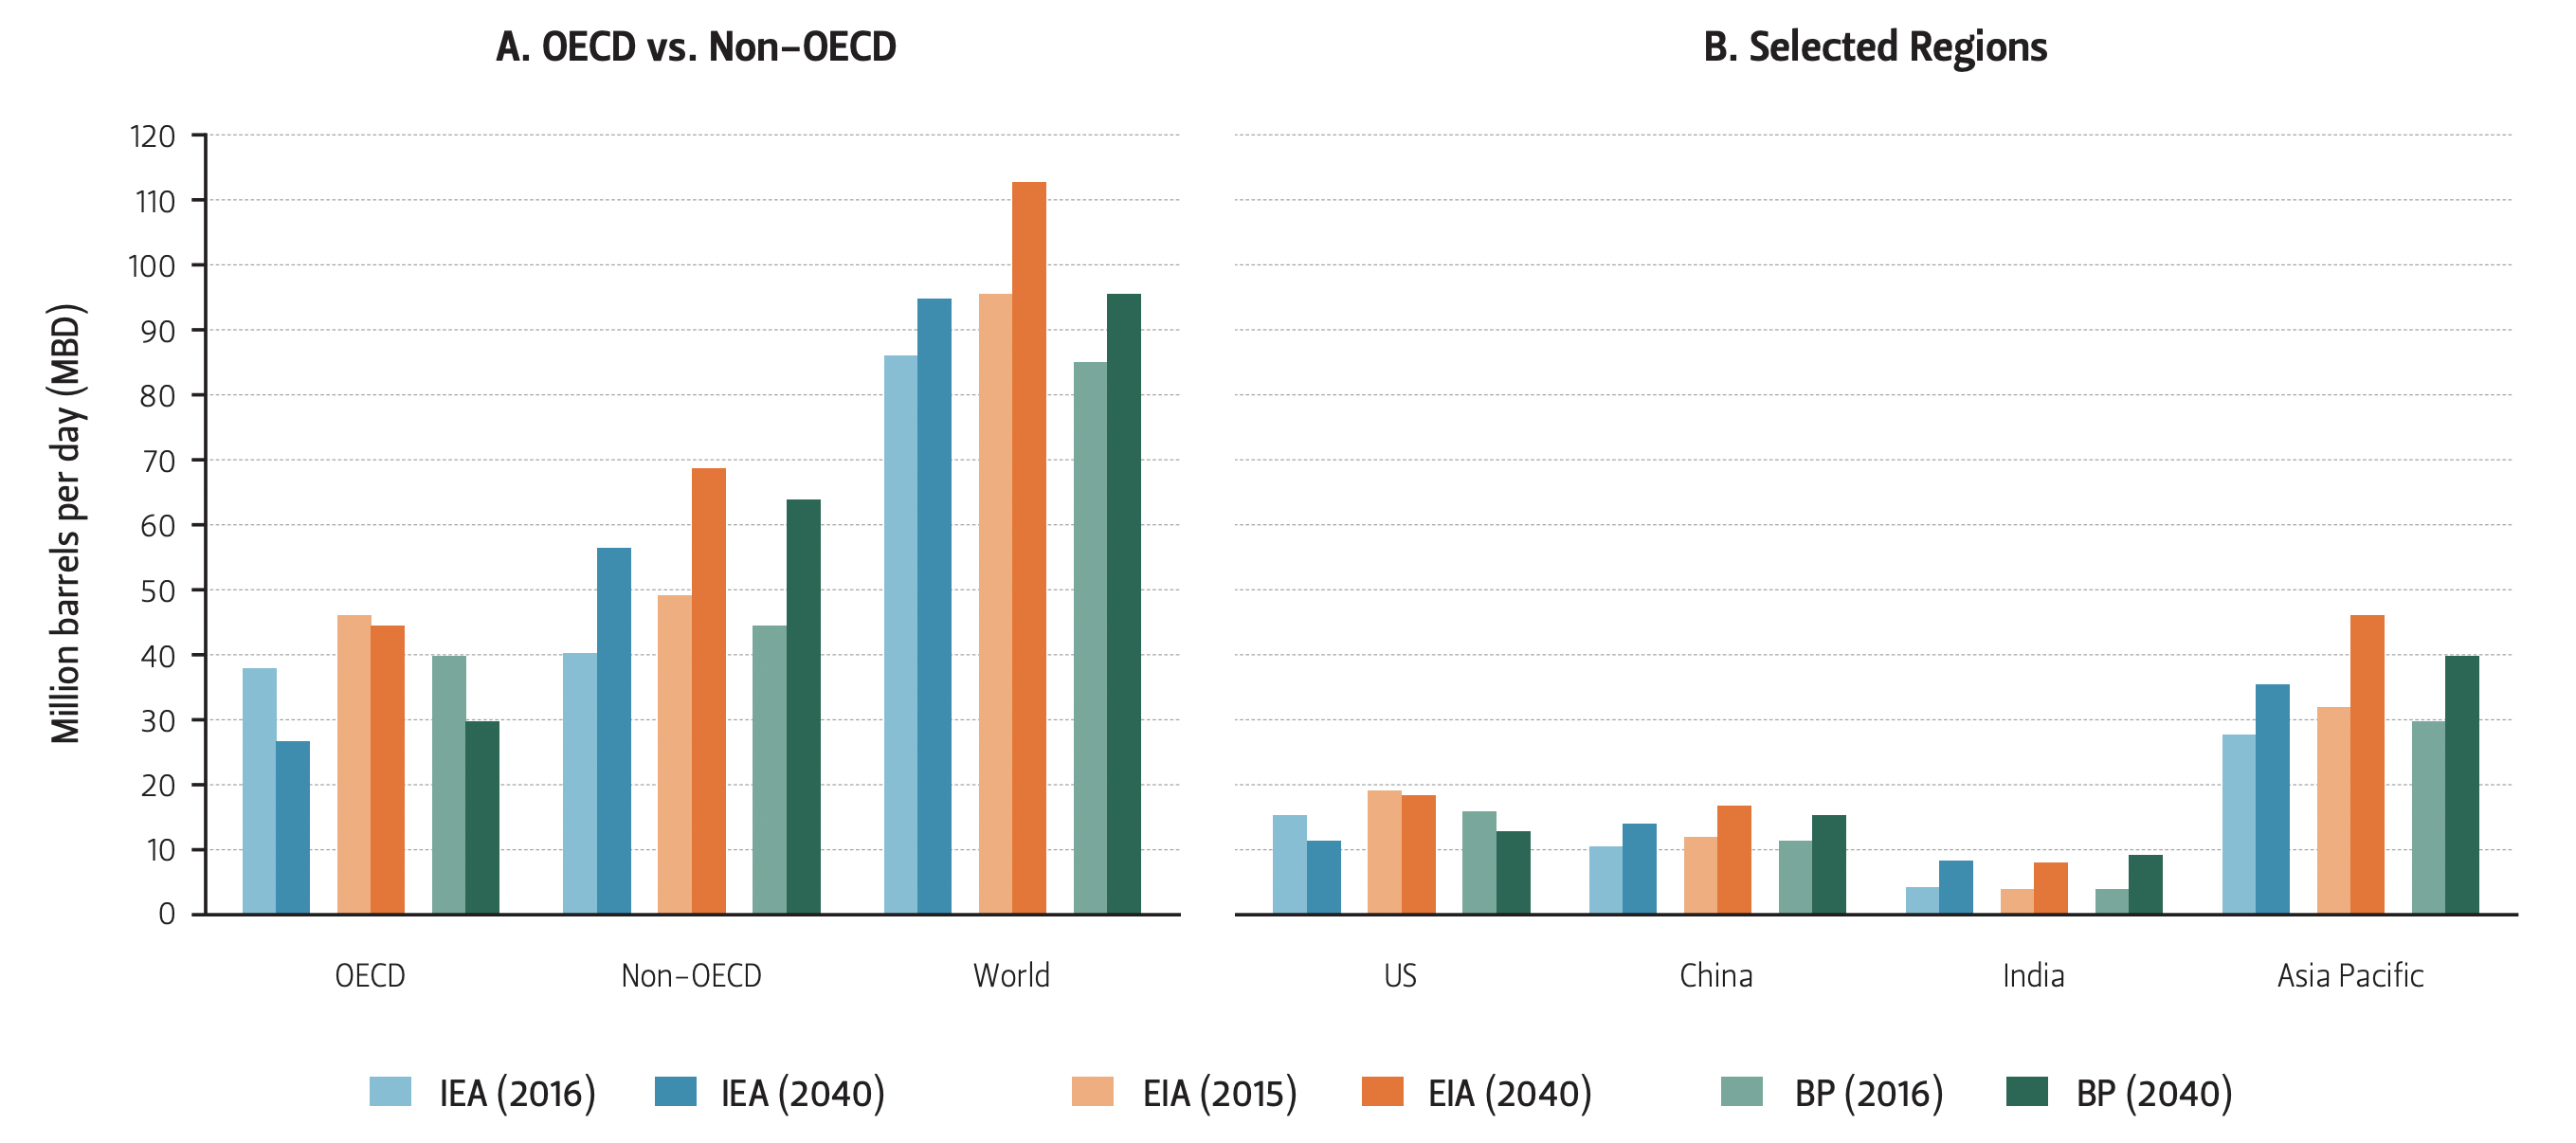
The outlooks also agree that all growth in oil demand will come from non-OECD countries as a whole instead of OECD nations (Figure 3A). IEA projects China overtaking the US as the largest consumer of crude in around 2030. But it will be India where—per each outlook—oil demand will grow the fastest. While China’s use of oil through 2040 will increase by 30-40%—depending on which outlook is considered—India is projected to register a staggering 95-130% increase in oil demand (Figure 3B).
Figure 3 — Oil Demand
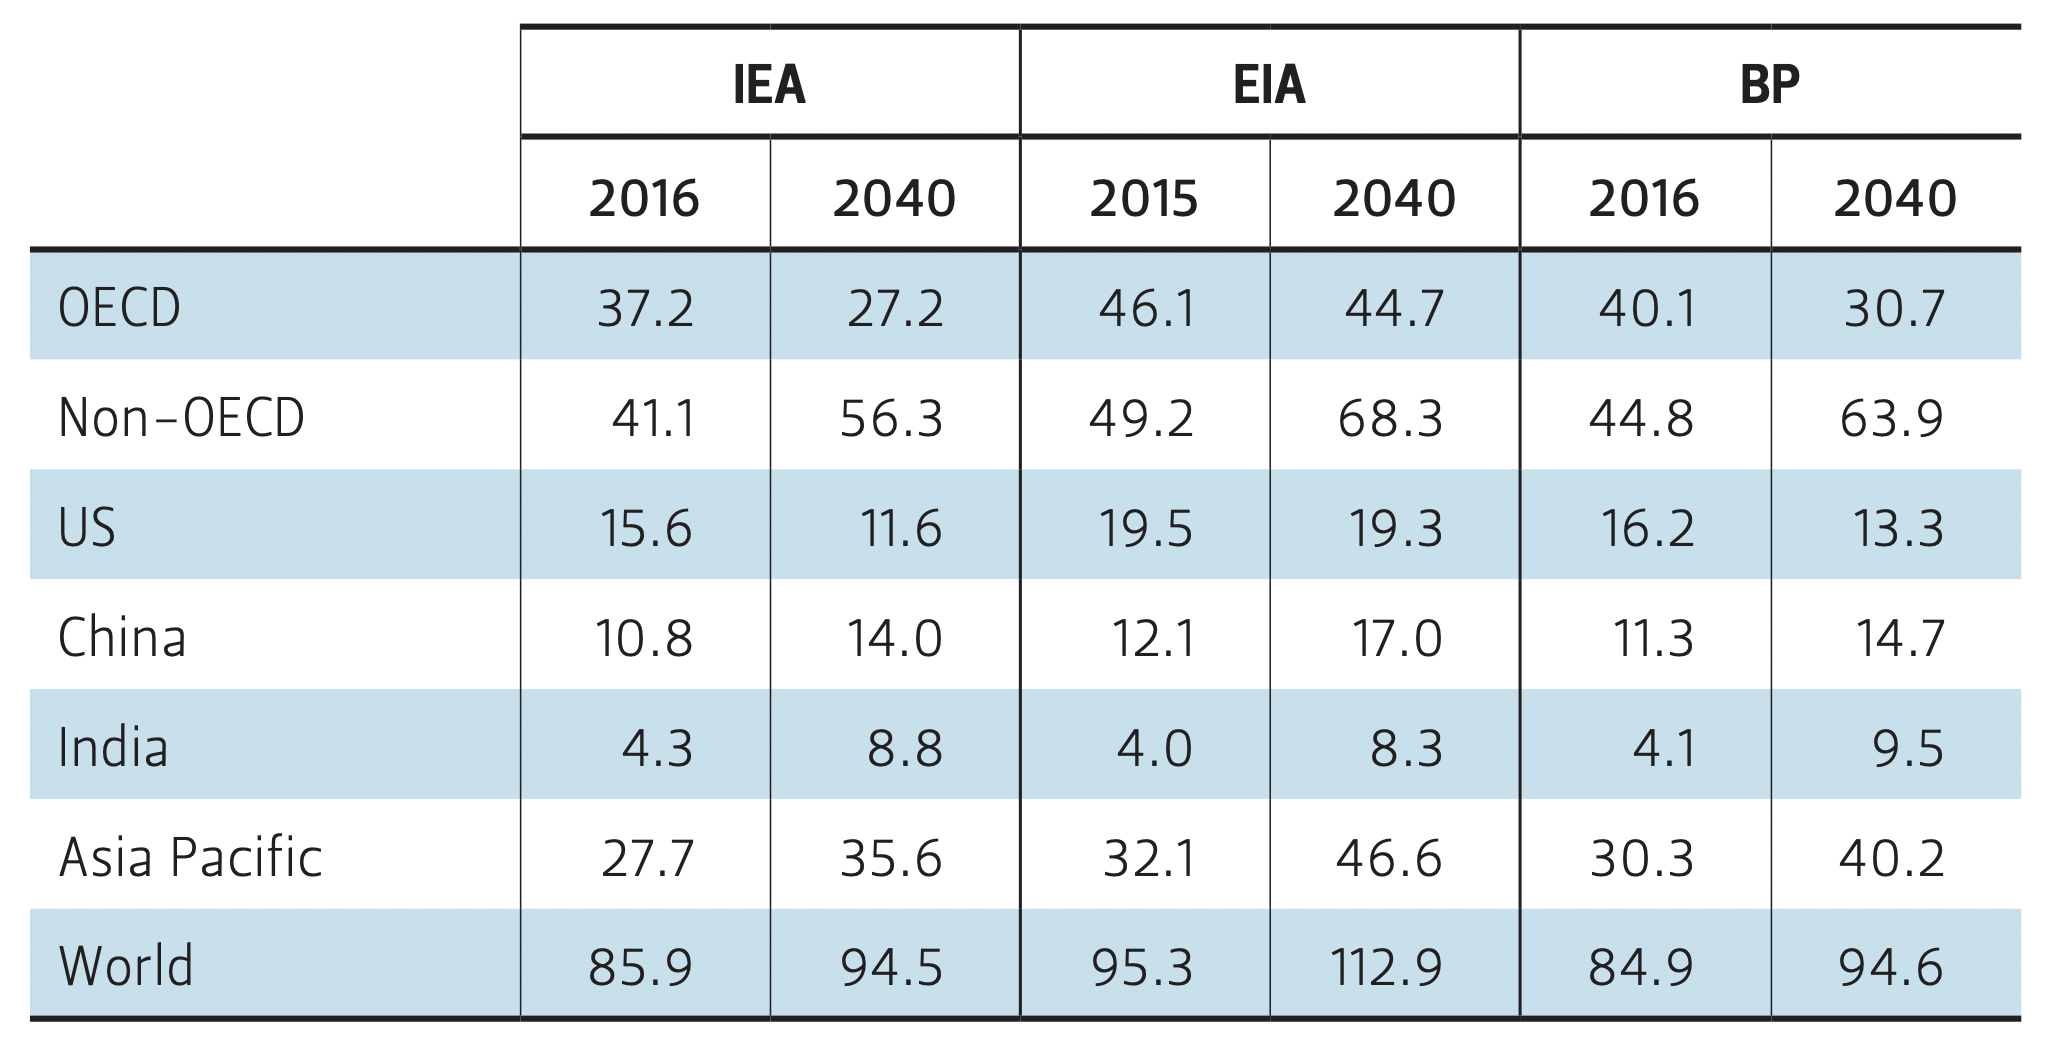
Natural Gas
According to the EIA, natural gas consumption through 2040 will grow by 1.9% per year in non-OECD countries and by 0.9% per year in OECD nations. The share of global natural gas consumption by non-OECD regions will increase from 53% to 59%. Thus, both non-OECD and OECD regions start from a similar base: around the mid-50 trillion cubic tonne (TCF) range for OECD nations and the mid-60 TCF range for non-OECD countries. However, going forward, this base will nearly double for non-OECD countries and grow by only 13-22.9% for the developed world (Table 5). India and China’s gas demand approximately triples in this period (Figure 4). Much of this phenomenon can be traced to the combined forces of growing economies and the need for cleaner fuels in electricity generation to support better air quality and potential climate change action.
Figure 4 — Natural Gas Demand

Table 5 — Gas Demand (TCF)
Take Away Points
The trends described above underline several points, probably the most important being that the developing world should be given a closer look, if not priority, in projections and/ or plans for any type of energy transitions. And while the developed world is right to point to the increasing presence and precipitous growth in renewable energy, it is often guilty of extrapolating the magnitude of these trends to the rest of the world.
Meanwhile, fossil fuel demand is projected to grow at a high rate in nonOECD countries. In the period under consideration (mid-2010s through 2040), this is particularly true for regions where finding reliable substitutes for fossil fuels can be a challenge. This includes oil as well as natural gas, which provides a cleaner substitute for coal in power generation.
As a result, under the base case scenarios, the growth in fossil fuels in absolute Mtoe terms approximately doubles the growth in renewable energy in nonOECD countries through 2040, per the IEA and EIA outlooks. Also, the lower demand for fossil fuels in the developed world is more than compensated for by the higher demand in non-OECD countries.
Policy Implications
The projections and trends that the EIA, IEA, and BP outlooks identify have several important implications for policymakers and stakeholders as they consider the next two decades.
1. For the US
Policymakers and stakeholders should take into account that the future of the US fossil fuel sectors will increasingly depend on foreign demand. This includes the need to invest in infrastructure that is conducive to energy exports. Thus, a careful consideration of the negative consequences of retreating from multilateral and bilateral free trade policies should be of utmost importance. Mercantilist policies could significantly hamper and/or disadvantage the United States’ position as a global energy exporter, slow global economic growth, and, in effect, decrease demand for US oil and gas.
2. For New Demand Centers
China and India are faced with the reality that their economic growth will continue to depend on the availability and price of oil and gas largely produced elsewhere. However, due to the size of their energy demand—propelled by burgeoning populations—these countries will also have considerable ability to shape global market conditions and, thus, global oil and gas prices. As such, the domestic and foreign policies of both countries will be increasingly significant, with the potential power to affect the global energy market and economy, for good or bad. In a way, Asia will also provide a blueprint for economic development and energy demand patterns in Africa and South America. While energy demand in these regions will be at rather low absolute levels through 2040 (with high levels of growth arising from a small base), we can expect that Africa and its rapidly growing population, in particular, will influence energy supply and demand patterns in the second half of the 21st century.
3. For Climate Change Efforts
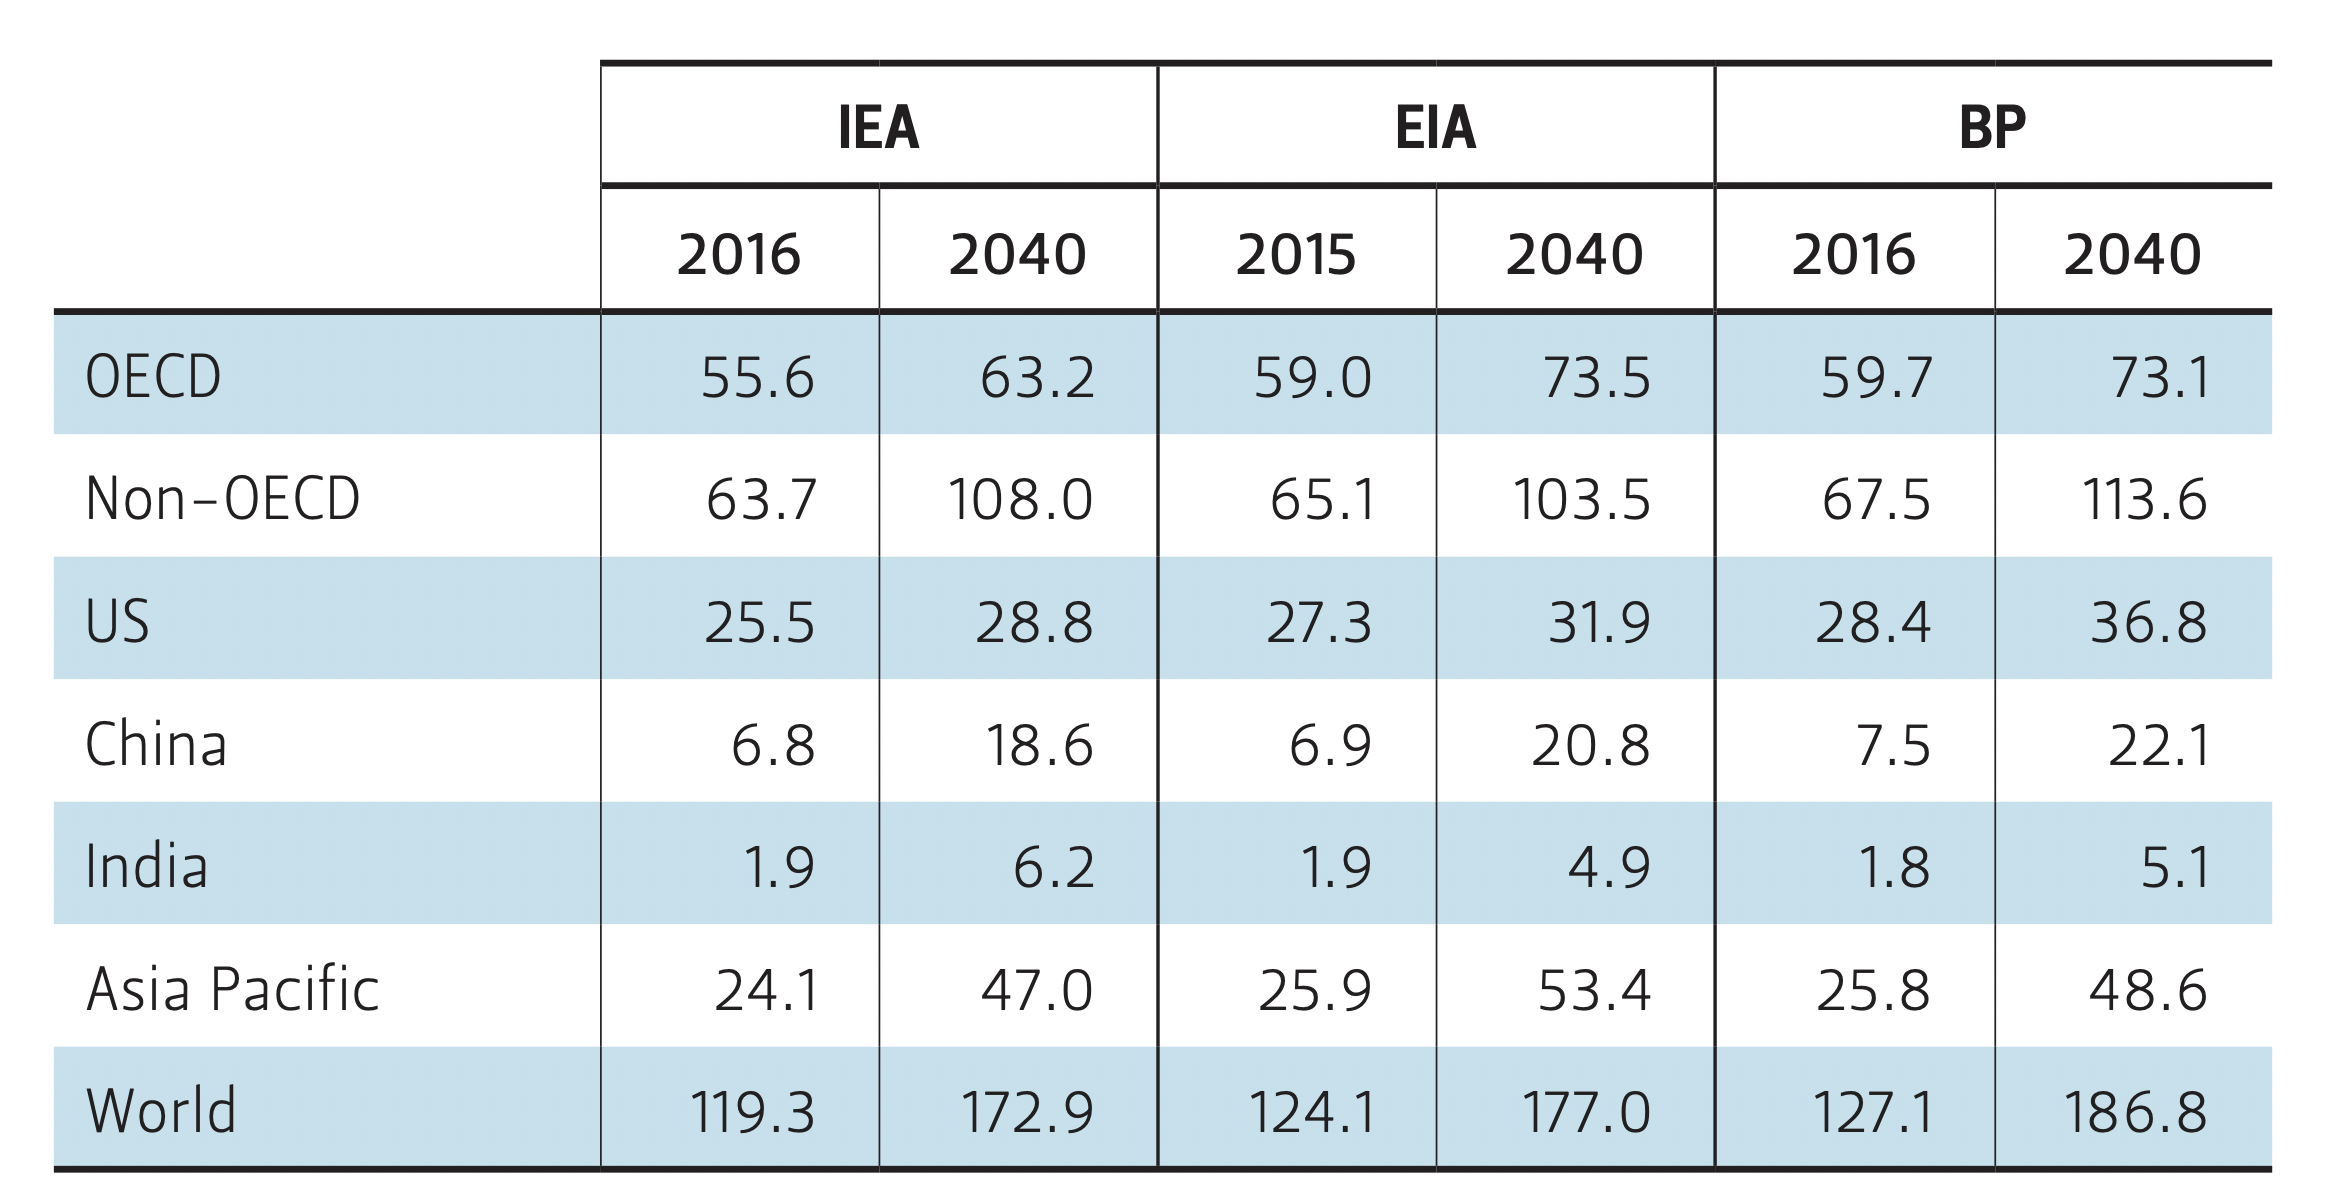
The push in the developed world to switch to renewable energy sources is important and will continue. However, it is very likely that such efforts will be overshadowed by growth in fossil fuel use in the developing world.7 Even in the most optimistic base case projections presented by the IEA’s outlook—which predicts that CO2 emissions in developing countries will decline by 20%—emissions are expected to grow by approximately 27% in the developing world and by around 10% globally (for absolute emission values, see Table 6). In consequence, climate agreements with no enforcement mechanisms to limit emissions or transfer funds from OECD nations to the developing world to support renewables will face difficulties in implementation and achieving set goals. Thus, if global CO2 emissions are to decline, compliance will have to become the focus of future climate negotiations. Unfortunately, the likelihood of such global agreement is probably not very high given the vast disparities in incomes, energy use, and capabilities, and the lack of goals that motivate governments around the world.
Current climate commitments, including the Paris Accord, feature another significant flaw. They reflect the developed world’s narrow focus on shifting from fossil fuels to renewables. Such an approach considers neither the role of economic and industrial growth in poor and very poor nations nor the critical role fossil fuels are more likely to play as the 7+ billion residents in these nations aspire to advance into the middle class. Thus, strategic investment in technological research and development (R&D) innovation is needed in the OECD. This includes increased R&D funding in the developing world—similar to that offered to farmers in Asia and Africa by the European Commission and the Bill and Melinda Gates Foundation.8 The funding would improve the economics of low or no carbon fuels and provide the price drivers for a declining carbon content. It would also remove the need for subsidies or government regulatory regimes that are largely beyond the capability or interest of governments in much of the developing world. This importance of funding is underlined by the IEA, which states that “only four of 38 energy technologies and sectors were on target last year to meet long-term climate and air pollution goals.”9
Table 6 — CO2 Emissions, Metric Tons (MT)
Conclusions
As highlighted in this brief, the developing world and not the developed OECD nations will likely drive the world’s energy in the 21st century. Thus, it is imperative that the needs, challenges, and limitations of the developing world are considered when planning for a cleaner and sustainable future. This includes focusing on sustainability in a much broader sense besides environmental impact. Accordingly, basic human needs—many of which are underserved in the least developed parts of the world—have to be carefully considered and incorporated into decarbonization and energy transition plans. Technological change and the speed of innovation provide for potential alternatives to the strictly non-fossil fuel energy policy to which the developed world is often so eager to commit. Moreover, technologies that improve energy efficiency in buildings, air conditioning, appliances, etc. can be critical elements to providing the developing world with the conveniences that richer nations enjoy today. There is also something to be said about a concerted R&D effort aimed at making zero-carbon emission technology cost-effective so that the market rather than government policies—which are especially ineffective in nations with poor governance structures—drive the change.
Endnotes
1. “Improving Comparisons of Global Energy Outlooks,” Resources for the Future, April 26, 2018, http://www.rff.org/about/media/press-release/improving-comparisons-global-energy-outlooks.
2. Richard Newell, Stuart Iler, and Daniel Raimi, “Global Energy Outlooks Comparison Methods: 2018 Update,” Resources for the Future, April 26, 2018, http://www.rff.org/research/publications/global-energy-outlooks-comparison-methods-2018-update (last accessed 06/04/2018).
3. For the purposes of this analysis, we look only at the “business as usual scenarios” included in the outlooks (IEA: new policies scenario; EIA: reference case; and BP: evolving transitions scenario). The assumptions in each scenario differ, sometimes significantly, and produce relatively different absolute value predictions across the outlooks. For example, the outlooks assume different energy content per fuel (see Richard G. Newell and Yifei Quian, “Global Energy Outlooks Comparison: Methods and Challenges IEF,” March 2015). Since we focus in this brief on trends, we do not find the differences to be an issue. In fact, finding similar trends across different sets of assumptions additionally validates our observations.
4. United Nations, World Population Prospects: The 2017 Revision (New York: United Nations, 2017), https://esa.un.org/unpd/wpp/Publications/Files/WPP2017_KeyFindings.pdf (last accessed 06/04/2018).
5. Table 2 and all tables and figures that follow use data reported by the IEA, EIA, and BP outlooks.
6. We do not include Southeast Asia separately in our tables and figures given the varying definitions of the region across the outlooks, but we think it is important to mention this general conclusion.
7. “The State of Global Coal Power, Center for Global Sustainability,” University of Maryland School of Public Policy, April 2018, http://stateofglobalcoal.org/wp-content/uploads/2018/04/CGS-5-onepager-1-WEB-1.pdf.
8. “Bill & Melinda Gates Foundation Commits $300M (€255M) to Help Farmers in Africa and Asia Cope with Climate Change,” https://www.gatesfoundation.org/Media-Center/Press-Releases/2017/12/Gates-Foundation-Commits-300M-USD-to-Help-Farmers-in-Africa-and-Asia-Cope-with-Climate-Change (last accessed 06/04/2018.
9. “Few energy technologies, sectors on track for climate goals: IEA,” Reuters, May 23, 2018, https://www.reuters.com/article/us-iea-cleanenergy/few-energy-technologies-sectors-on-track-for-climate-goals-iea-idUSKCN1IO14U (last accessed 06/04/2018).
This material may be quoted or reproduced without prior permission, provided appropriate credit is given to the author and Rice University’s Baker Institute for Public Policy. The views expressed herein are those of the individual author(s), and do not necessarily represent the views of Rice University’s Baker Institute for Public Policy.


