
Author(s)

For the first time in nearly three decades, wealth inequality in the United States has declined. The wealth Gini coefficient—a standard measure of inequality—fell between 2016 and 2019, reversing a rising trend that has persisted since 1992. Although wealth remains highly concentrated at the top, the data shows an improvement among lower shares of the wealth distribution. Income inequality, according to the same measure, also declined between 2016 and 2019. Although this series is more volatile, the recent drop in income inequality was the largest decline since 1992.
The results come from the Survey of Consumer Finances (SCF)—a triennial family survey sponsored and provided by the Federal Reserve. The survey data for 2019, which was released in late September 2020, gives one of the best insights into U.S. households’ wealth composition. Because people are generally reluctant to report financial information, this data is notoriously difficult to capture. To overcome this deficiency, considerable resources are placed into data quality, making this data set both unique and invaluable to researchers.
Along with the data set, the Federal Reserve releases a summary paper, which details changes in the wealth and income distributions. The data corresponding to the summary paper involves several variables constructed by the primary SCF data set. This issue brief uses the same augmented data set to provide complementary analysis and additional preliminary estimates of several measures characterizing the wealth and income distribution, particularly in comparison to previous releases of the data.
Trends in Inequality
Wealth
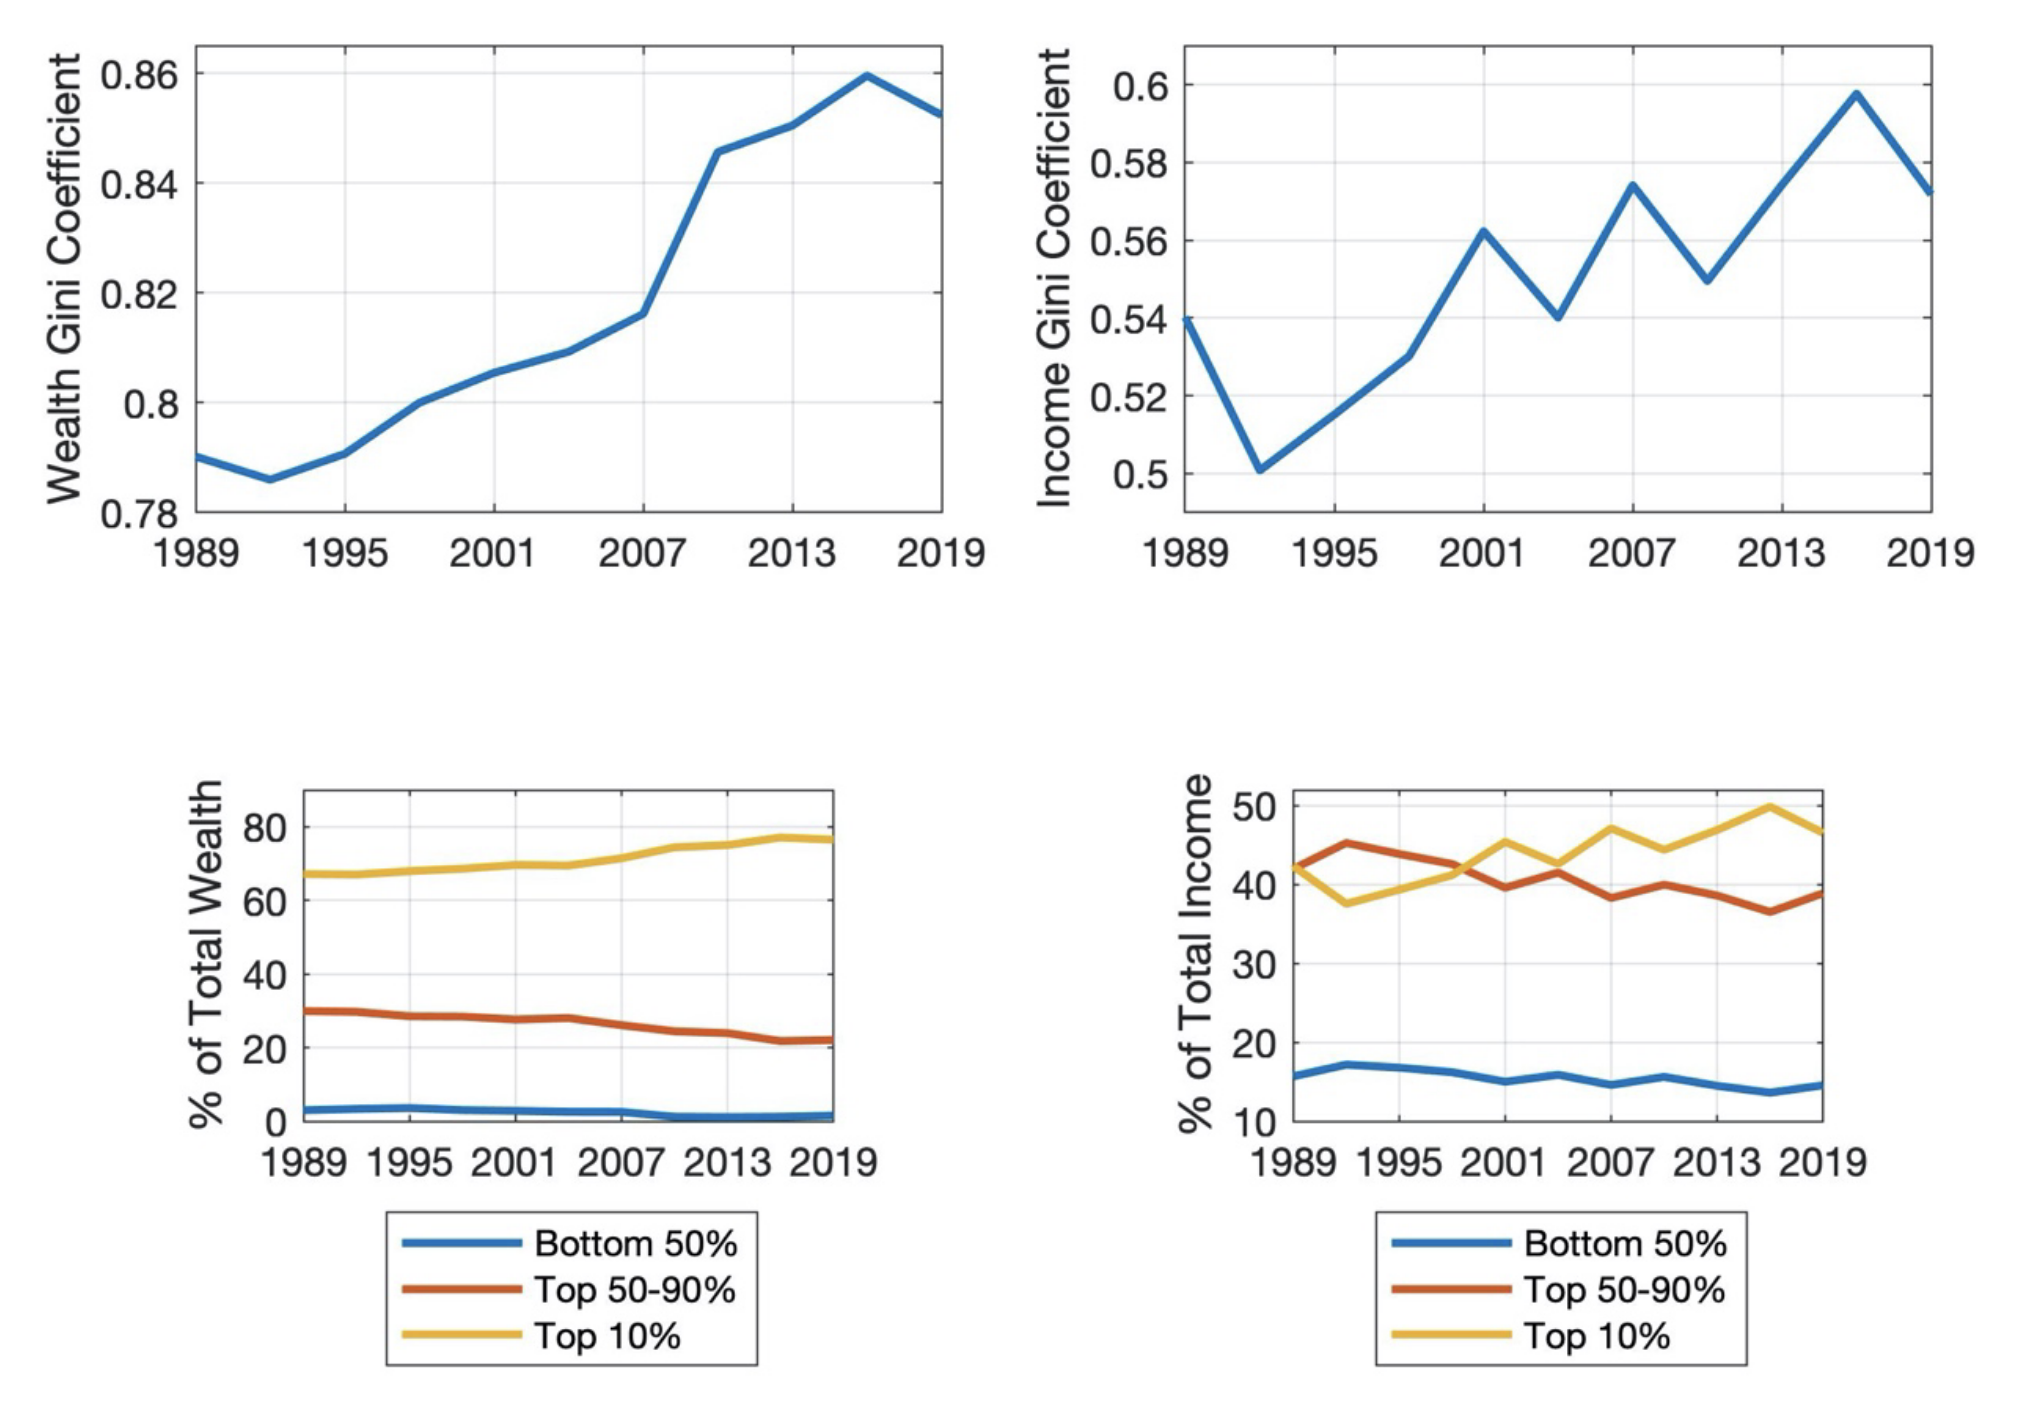
The SCF collects granular data on the financial positions of U.S. families, with regards to both assets and liabilities. The extent to which a family’s assets exceed their liabilities determines their net worth, which in turn defines the family’s wealth. Between 2016 and 2019, real median family wealth grew 17.7% from $103,460 to $121,760. Even as broad measures of wealth grew over this time period, the dispersion of wealth contracted. Figure 1 shows how wealth inequality in 2019, as measured by the Gini coefficient, experienced its first decline since 1992.
The bottom left graph shows how changes in the wealth distribution are largely driven by changes in the share of wealth held by the top 10% of the distribution. That share trended upwards for nearly three decades before falling in 2019. The top 50%-90% of the distribution gained most of this decline in 2019, with the bottom 50% also improving modestly.
Figure 1 — Trends in Wealth and Income Inequality, 1989–2019
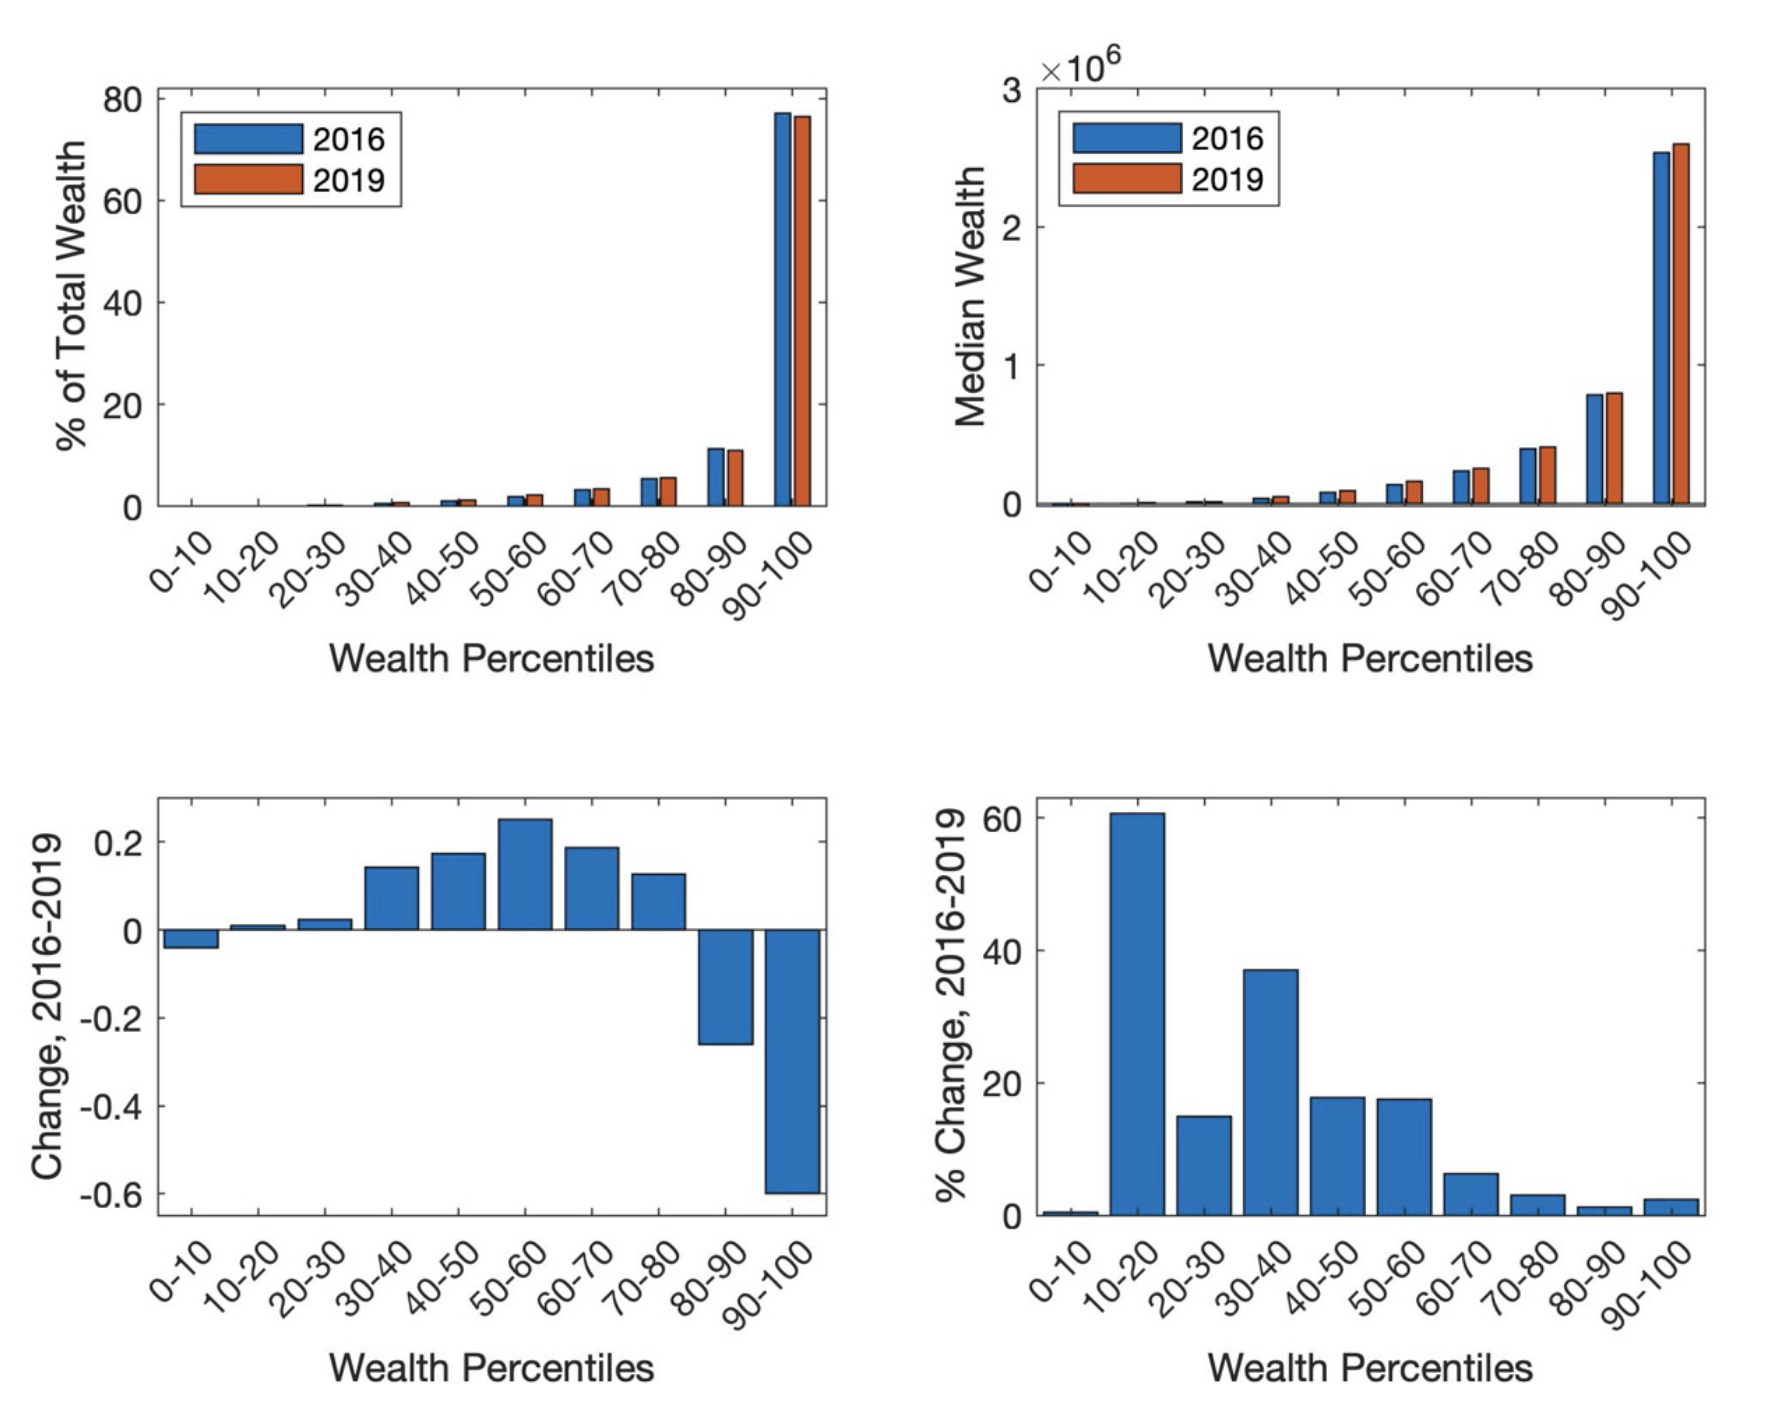
The reversal of wealth inequality motivates a closer look at the differences in the wealth distribution across the last two measurements. The top left graph of Figure 2 shows the shares of total wealth held by each decile of the wealth distribution in 2016 and 2019, while the bottom left graph shows the differences over those years. Contrasting with the historical trend, the middle wealth deciles gained shares of total wealth, while shares held by the top deciles declined. The top right graph shows median wealth per decile in the respective years, and the bottom right shows the percentage change in these values. While all wealth groups performed well between 2016 and 2019, the data shows especially large gains at the lower and middle deciles of the wealth distribution.
Figure 2 — Changes in the Wealth Distribution by Wealth Deciles, 2016–2019
Understanding the cause of the improvement in the wealth position of middle wealth deciles requires closer inspection of the composition of household assets. The augmented SCF data set provides classification of net worth components by financial and nonfinancial assets. Financial assets consist of items like stock holdings, bank deposits, and retirement accounts, while nonfinancial assets include residential property, vehicles, and business equity. The data shows distributional gains in nonfinancial assets by middle-decile wealth groups, particularly in the category of residential property. This was an influential factor with regards to shifts in the wealth distribution, since nonfinancial wealth comprises 66% of total wealth.
Figure 3 — Financial and Nonfinancial Wealth Shares, 2016–2019
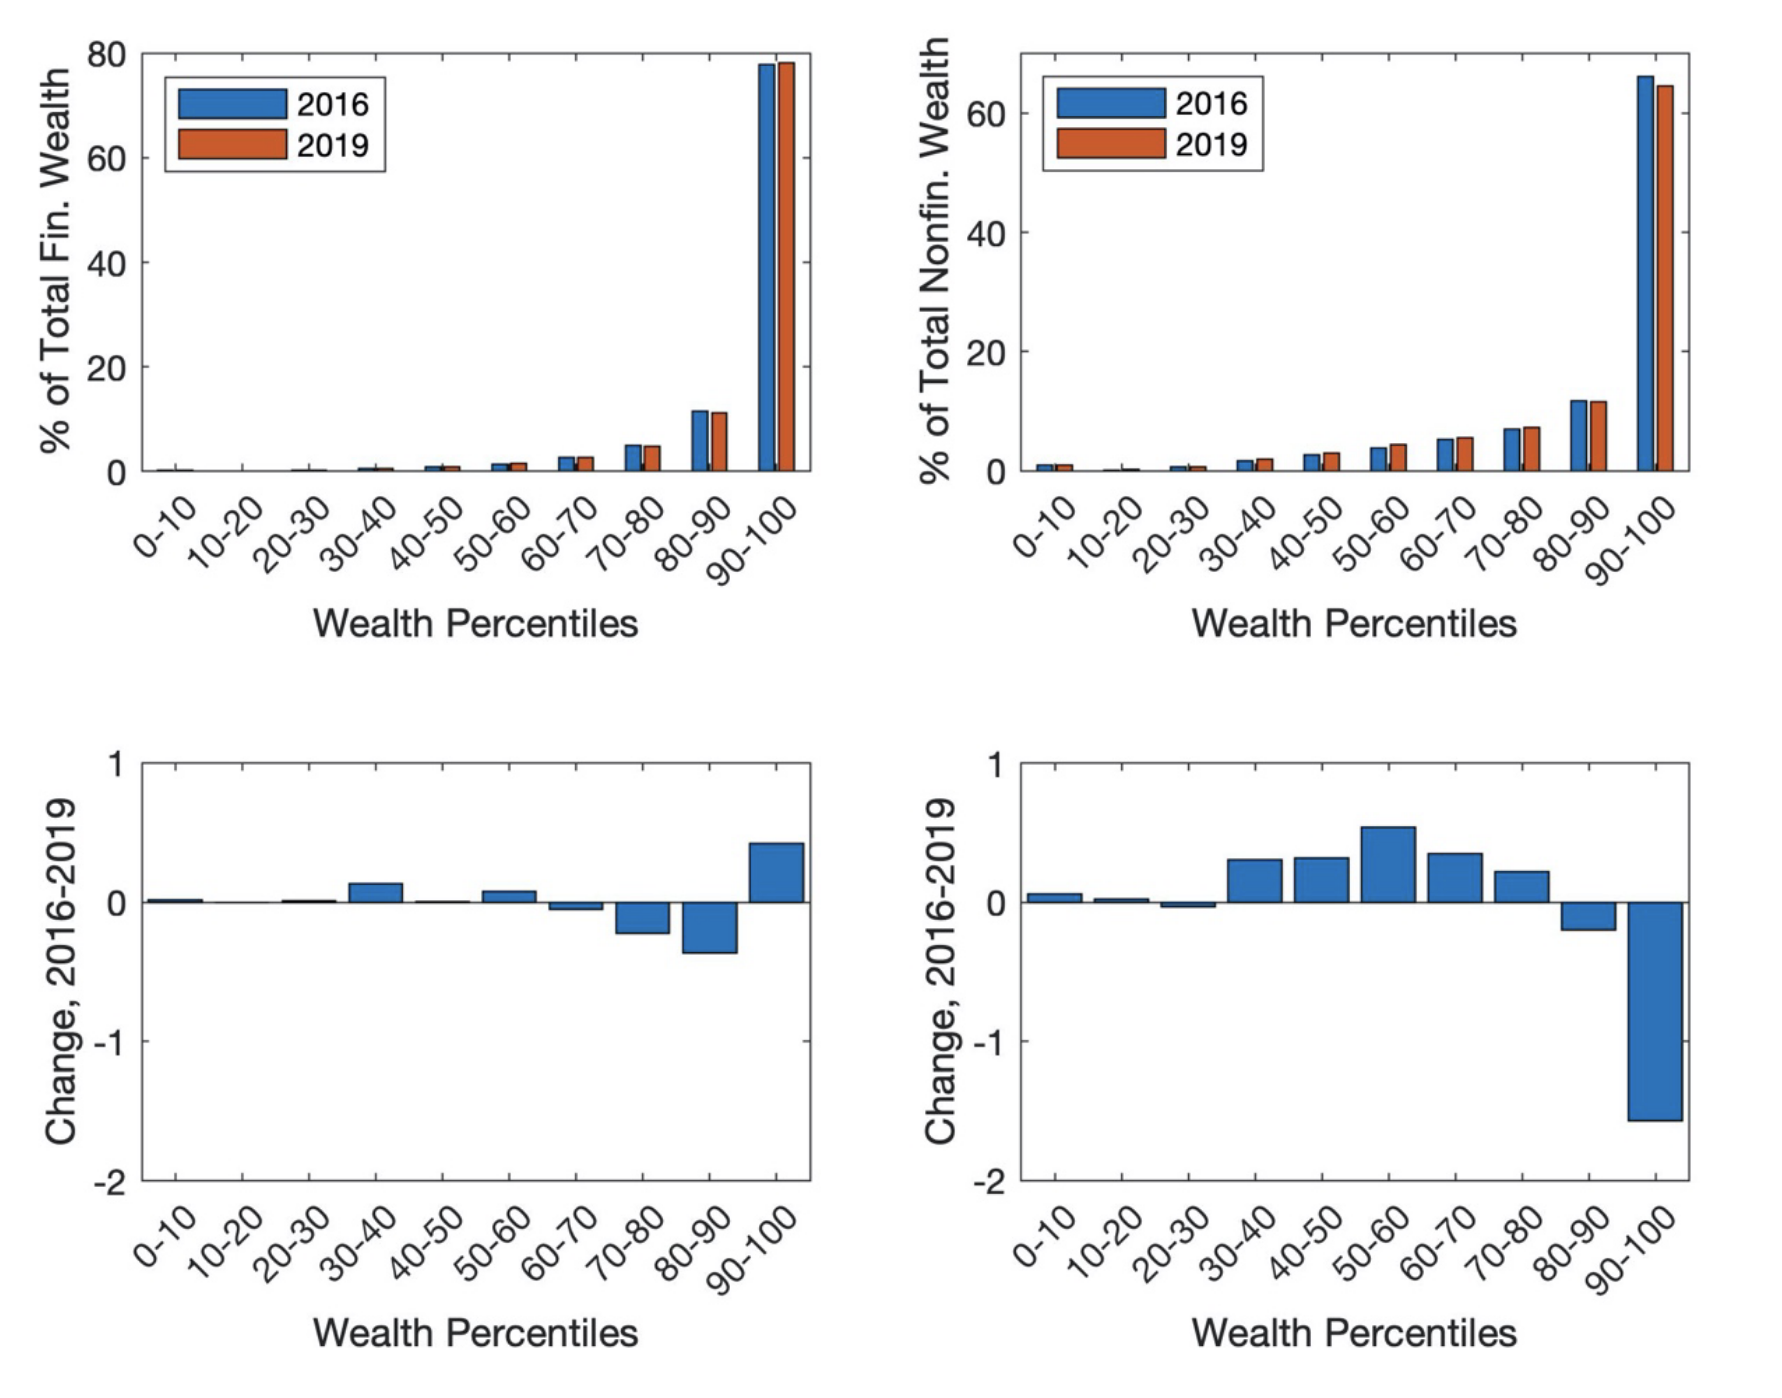
Figure 3 shows how the wealth distribution changed with regards to financial and nonfinancial wealth holdings between 2016 and 2019. The top left figure shows that financial wealth remains highly concentrated at the top wealth decile. The bottom left graph shows that the top wealth decile and some middle deciles gained from the 60-90th percentiles. Similar to the trend in total wealth, further analysis showed that median financial wealth grew significantly faster in the lower wealth deciles, relative to higher wealth deciles.
Despite the modest improvement in total financial wealth held by the top decile, nonfinancial wealth showed a different trajectory. This category, largely comprised of housing, indicated a sharp decline in the total share held by the top decile and a modest decline by the 80-90th percentile. Moreover, this loss by the top two deciles was largely gained by the middle wealth deciles and to a small extent by the bottom 20%. Since nonfinancial wealth comprises a majority of total wealth, a decline in overall wealth inequality can largely be attributed to gains by lower wealth deciles in this category.
Income
In the time between 2016 and 2019, real median U.S. family income rose 5.4% from $56,019 to $59,051. Over that time period, income inequality experienced its sharpest decline since the decline between 1989 and 1992, as evidenced by the decline in the income Gini coefficient in Figure 1. Since this time series shows greater volatility, the observed decline does not necessarily indicate a reversal in trending income inequality growth. The magnitude of the decline does, however, suggest that the growth in income inequality likely slowed over this period.
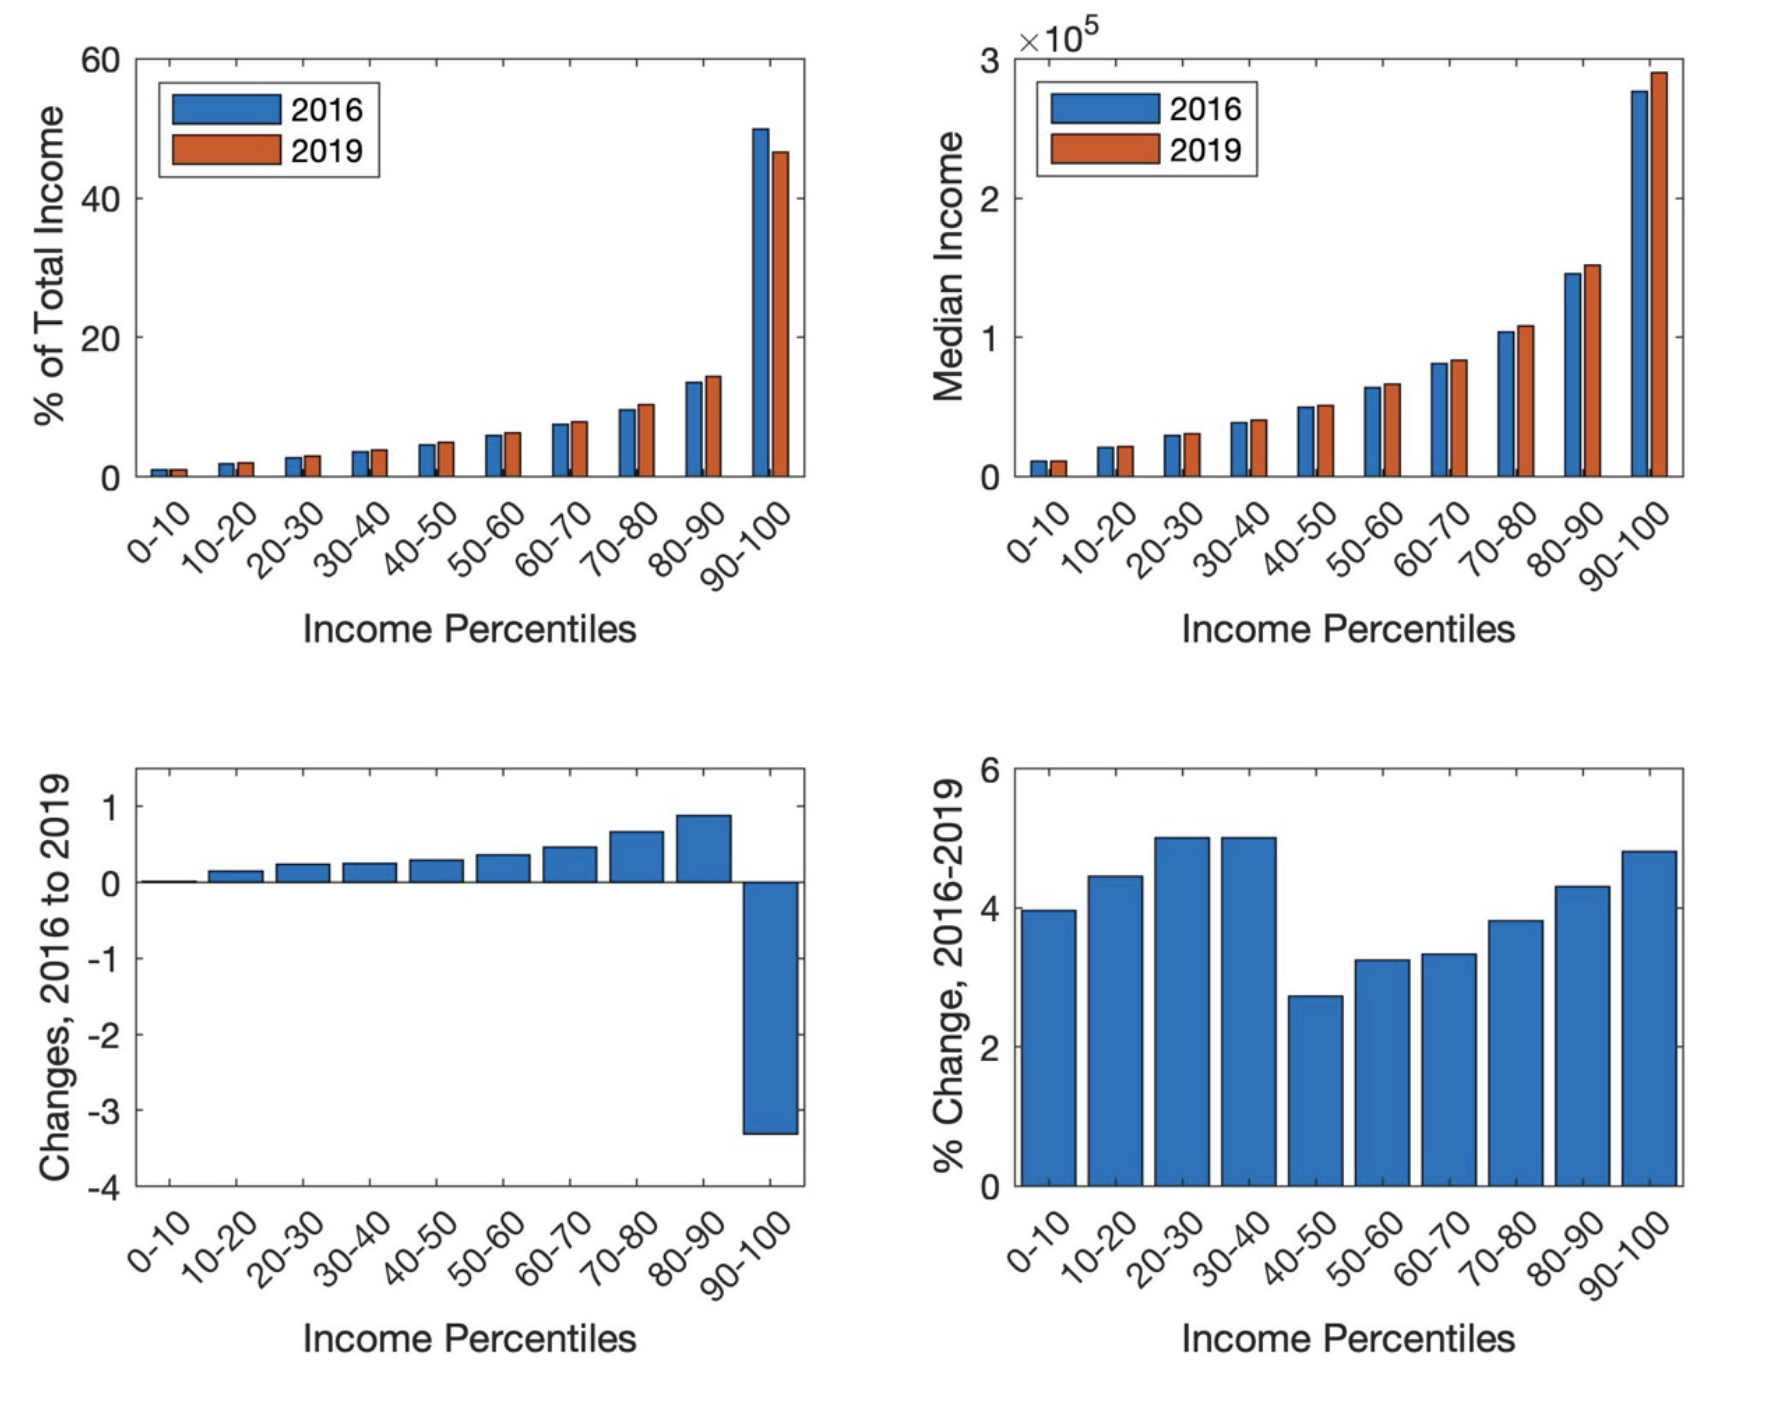
Figure 4 shows how the income distribution changed between 2016 and 2019. The top left graph shows total income share by income decile, while the bottom left graph shows the change in these values. Each of the bottom nine income deciles made gains relative to the top decile. Similar to the trend in wealth, growing income inequality in the past was largely a result of gains by the top income earners—a pattern that reversed in 2019. The top right graph shows how real median income per decile changed from 2016 to 2019, while the bottom right graph shows the percentage change in these values. Despite the disproportionate gains of total income by lower income deciles, the data shows growth in the median income of every income decile.
Figure 4 — Changes in the Income Distribution by Income Deciles, 2016–2019
Discussion
The reversal of wealth inequality, as well as the sharp decline in income inequality, could have happened for a number of reasons, including the natural progression of a prolonged economic expansion. One plausible explanation corresponds to the aging of the U.S. population.1 An aging of the population shifts the age distribution from a large share of young and a low share of old to a low share of young and a large share of old. Because people generally have low assets early in life and higher assets later in life, this demographic shift can alter the wealth distribution from fewer high-wealth individuals to relatively many high-wealth individuals. Consequently, an aging of the population can plausibly generate a reduction in wealth inequality.
What makes the decline in wealth and income inequality particularly surprising is that it comes after a significant tax cut signed into law in 2017. This tax reform, commonly known as the Tax Cuts and Jobs Act (TCJA), reduced the corporate tax rate from 35% to 21%. Given that this tax cut largely benefited those who hold corporate equity, many expected this change would actually increase wealth and income inequality. A recent working paper at the National Bureau of Economic Research, however, notes that higher corporate taxation shifts corporate income to noncorporate businesses, increasing the dispersion of income and generating a rise in income inequality—an outcome that would reverse with a decline in the corporate tax rate.2 Another study uses a standard macroeconomic model with wealth inequality to show that the corporate tax cuts can actually generate gains in the share of total wealth held by households in the bottom 80% of the wealth distribution, leading to a reduction in wealth inequality.3 These findings support the connection between a decline in the corporate tax rate and a reduction in wealth and income inequality.
Other components of the TCJA may have also led to a decline in wealth inequality. The tax law reduced the maximum mortgage debt eligible for the mortgage interest deduction and capped the state and local tax deduction at $10,000. The former narrowed the tax incentives for buying expensive houses, and the latter raised the effective property tax rate on expensive homes. Furthermore, the doubling of the standard deduction significantly reduced the share of households benefitting from excess itemized deductions, limiting the effectiveness of the existing tax incentives for housing, even for many higher-income households. Each of these factors likely combined to improve the valuation of less expensive homes, relative to more expensive homes. Much of the change in the wealth distribution between 2016 and 2019 resulted from an improvement in housing wealth at lower wealth deciles, which is consistent with this theory.
Conclusion
Wealth inequality rose persistently between 1992 and 2016—a trend that saw a reversal in 2019. Income inequality also experienced the largest decline since 1992. Both changes are a result of gains in the total shares by lower deciles. While there are many plausible explanations, changing age demographics and the economic impact of the TCJA may have played a role in generating this outcome. Rising wealth and income inequality have been focal points in debates in the economic profession for many years. Researchers and institutions have allocated considerable resources to understanding the causes of inequality and how policy can affect it. A decline in both income and wealth inequality between 2016 and 2019 will require researchers to rethink the mechanisms driving inequality.
This material may be quoted or reproduced without prior permission, provided appropriate credit is given to the author and Rice University’s Baker Institute for Public Policy. The views expressed herein are those of the individual author(s), and do not necessarily represent the views of Rice University’s Baker Institute for Public Policy.


