
Author(s)

Introduction
In the last few years, the U.S. economy has faced several important transitions. Most notably, the Trump administration has implemented substantial tariffs intended to foster a more equitable trading flows and incentivize U.S. manufacturing. These measures followed a national emergency declaration aimed at strengthening economic security, with the president citing the need to address long-standing trade imbalances to support domestic job and wage growth.
Tariffs on commodities such as steel, aluminum, and automobile parts were imposed under Section 232 of the Trade Expansion Act of 1962, tariffs on China and other countries’ unfair trade practices were imposed under Section 301 of the Trade Act of 1974, and reciprocal and fentanyl-related tariffs were imposed under the International Emergency Economic Powers Act. However, after the U.S. Supreme Court ruled that the reciprocal and fentanyl-related tariffs enacted in April 2025 were unconstitutional, the administration removed those tariffs and replaced them with a 10% tariff based on Section 122 of the Trade Act of 1974.
The impact of the tariffs has been widely debated, with proponents arguing that tariffs will bring manufacturing investment back to the U.S., raise revenues to reduce deficits, and reduce U.S. reliance on imports of critical goods from other countries. Opponents argue that tariffs would reduce the growth rate of the economy and raise prices for imported goods, which would lead to reductions in consumption, investment and output in the long run. However, concurrent shifts in trade patterns and production inputs are making the true effect of tariffs on the U.S. economy harder to measure.
Most importantly, the economy has experienced an investment boom as the race to create and implement artificial intelligence (AI) related infrastructure has increased at a rapid pace. AI-related investments could be as high as $725 billion in 2026, after just four firms — Meta, Alphabet, Microsoft, and Amazon — spent $130 billion in the first quarter of 2026. The rapid buildout of data centers and the necessary infrastructure to power them requires imports from around the world. The increase in imports for this purpose has confounded the impact of the tariffs on economy.
The early trade data in 2026 suggest that recent U.S. trade policy changes are reshaping the sourcing of imports. It is not only the increase in tariff rates that are driving these changes, policy uncertainty and diversification of supply chains have also led to shifting demand for imports across countries. At the same time, the rapid buildout of data centers is driving a surge in a narrow set of AI-related imports. The result is a trade landscape being pushed by two major forces at once: 1) policy-driven reallocation away from some suppliers and products, and 2) demand-driven growth in AI-related investment.
Broad Shift in Trade Patterns
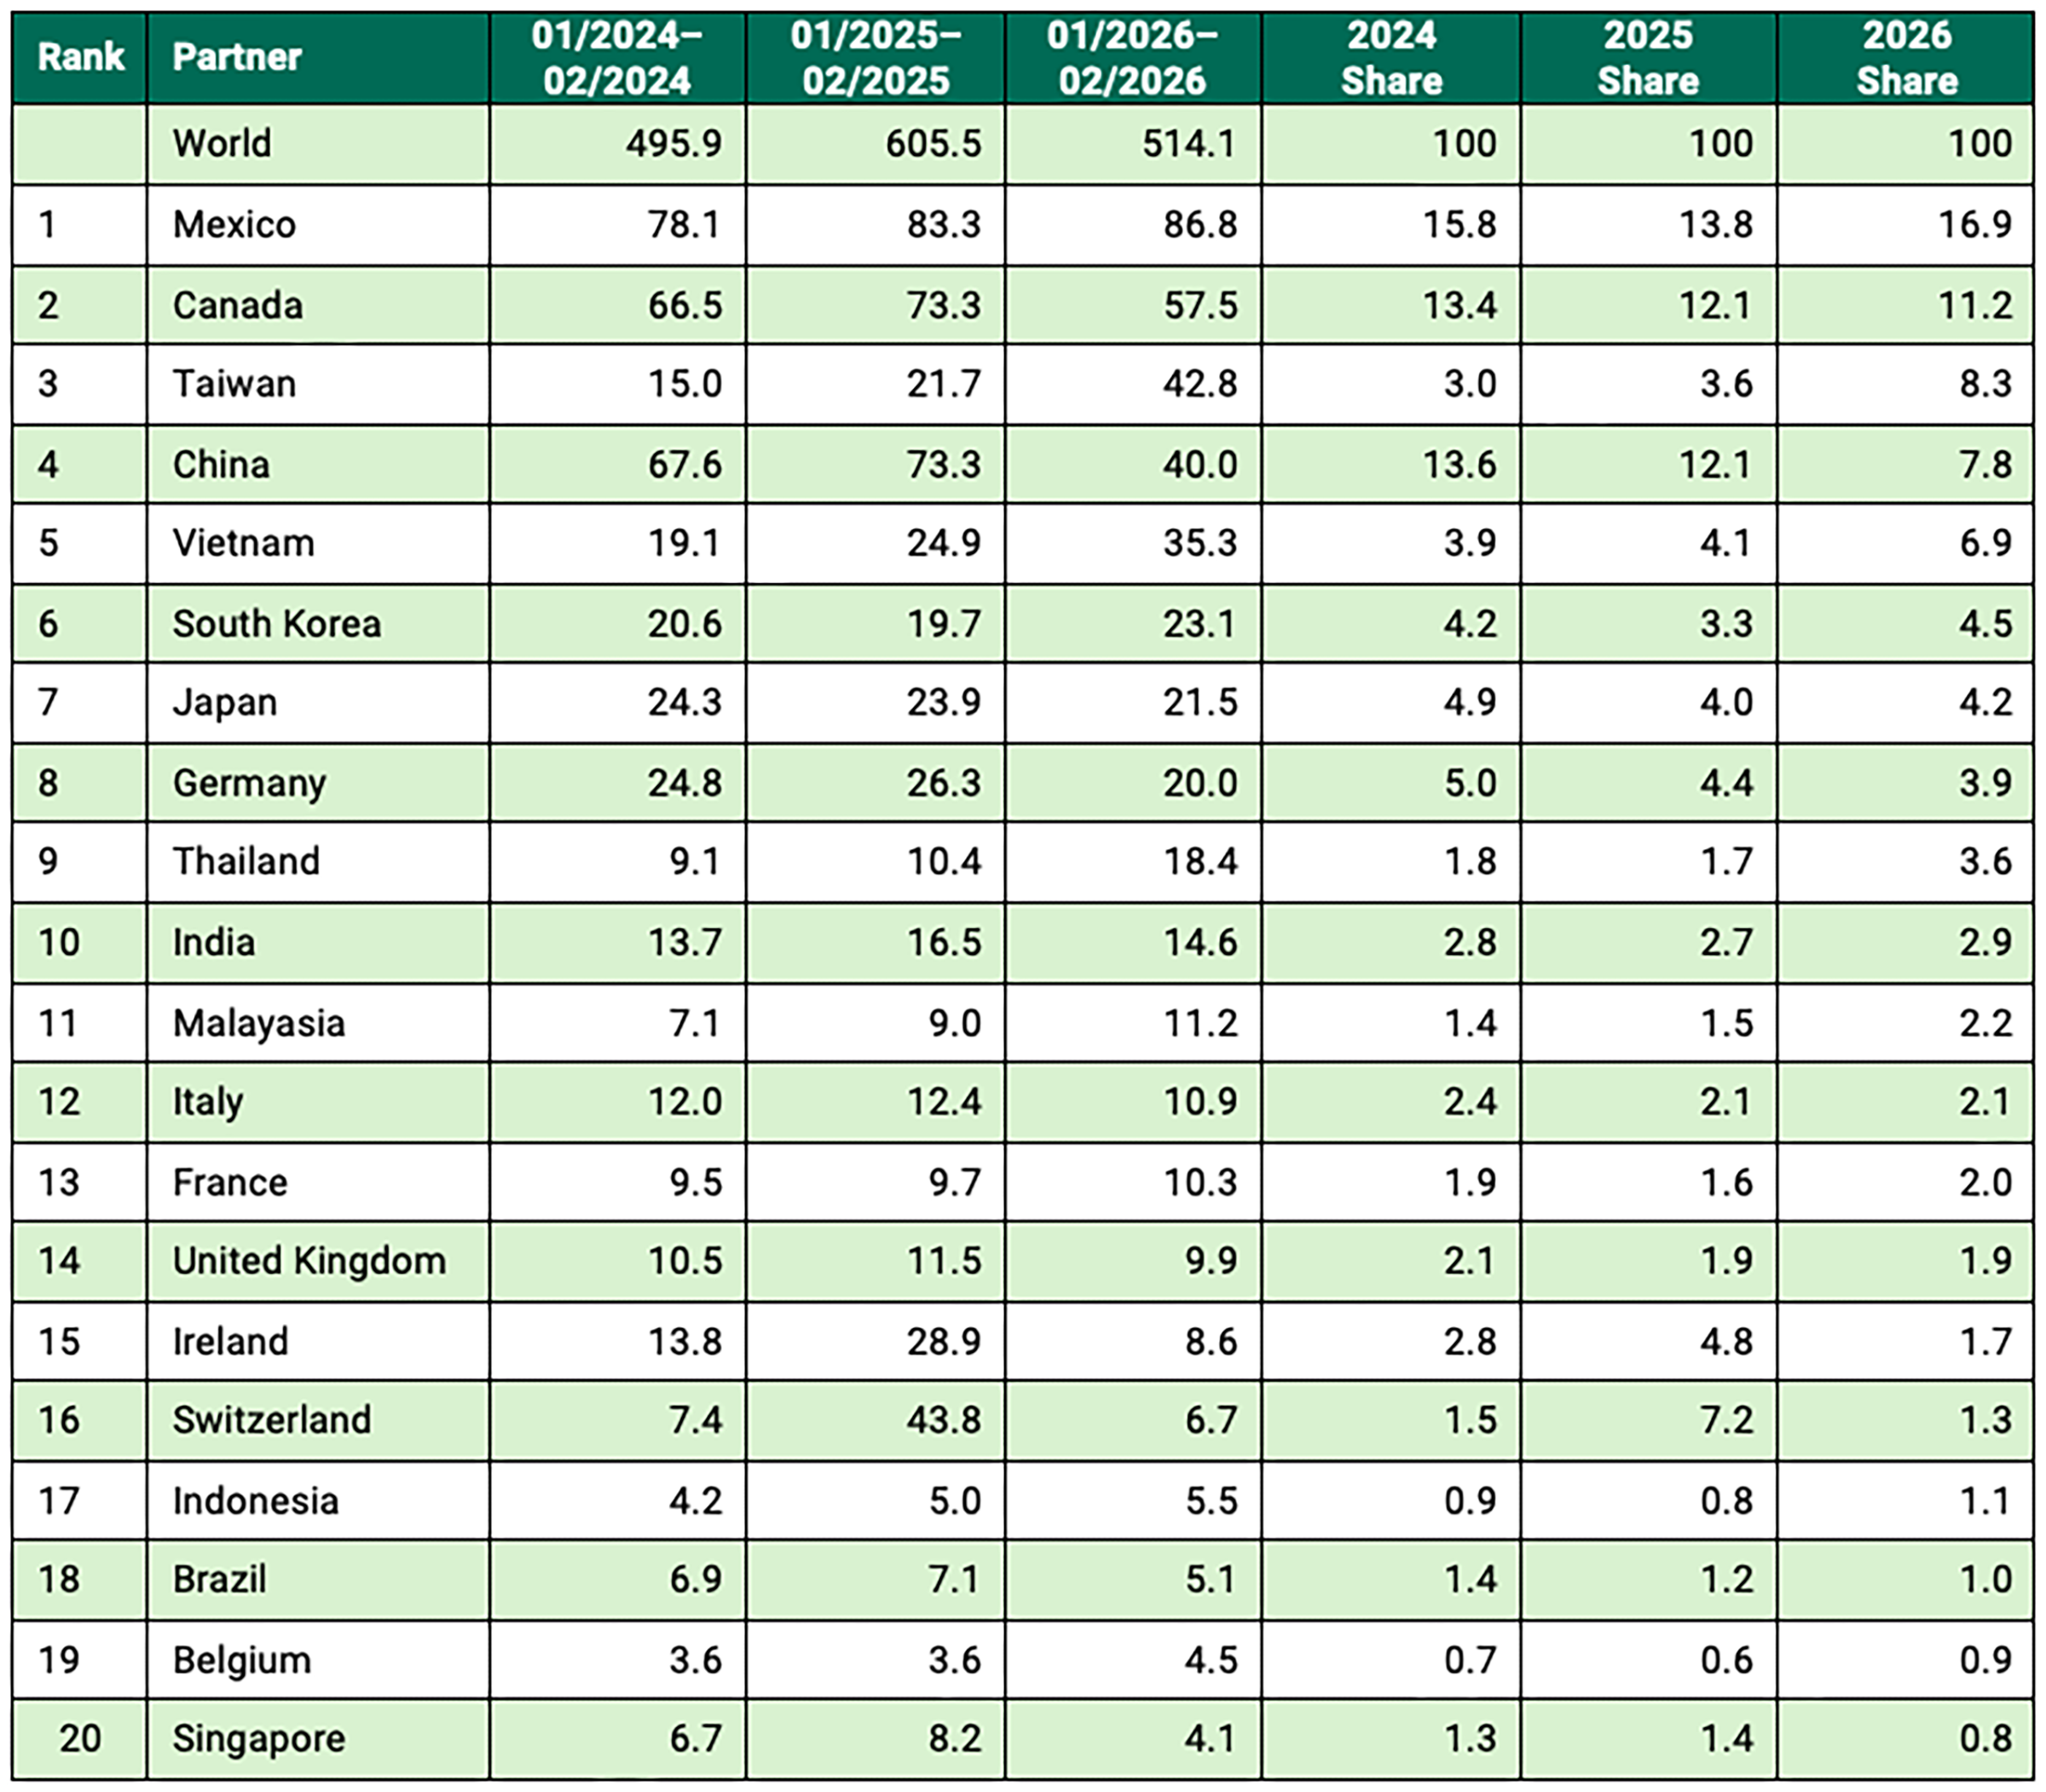
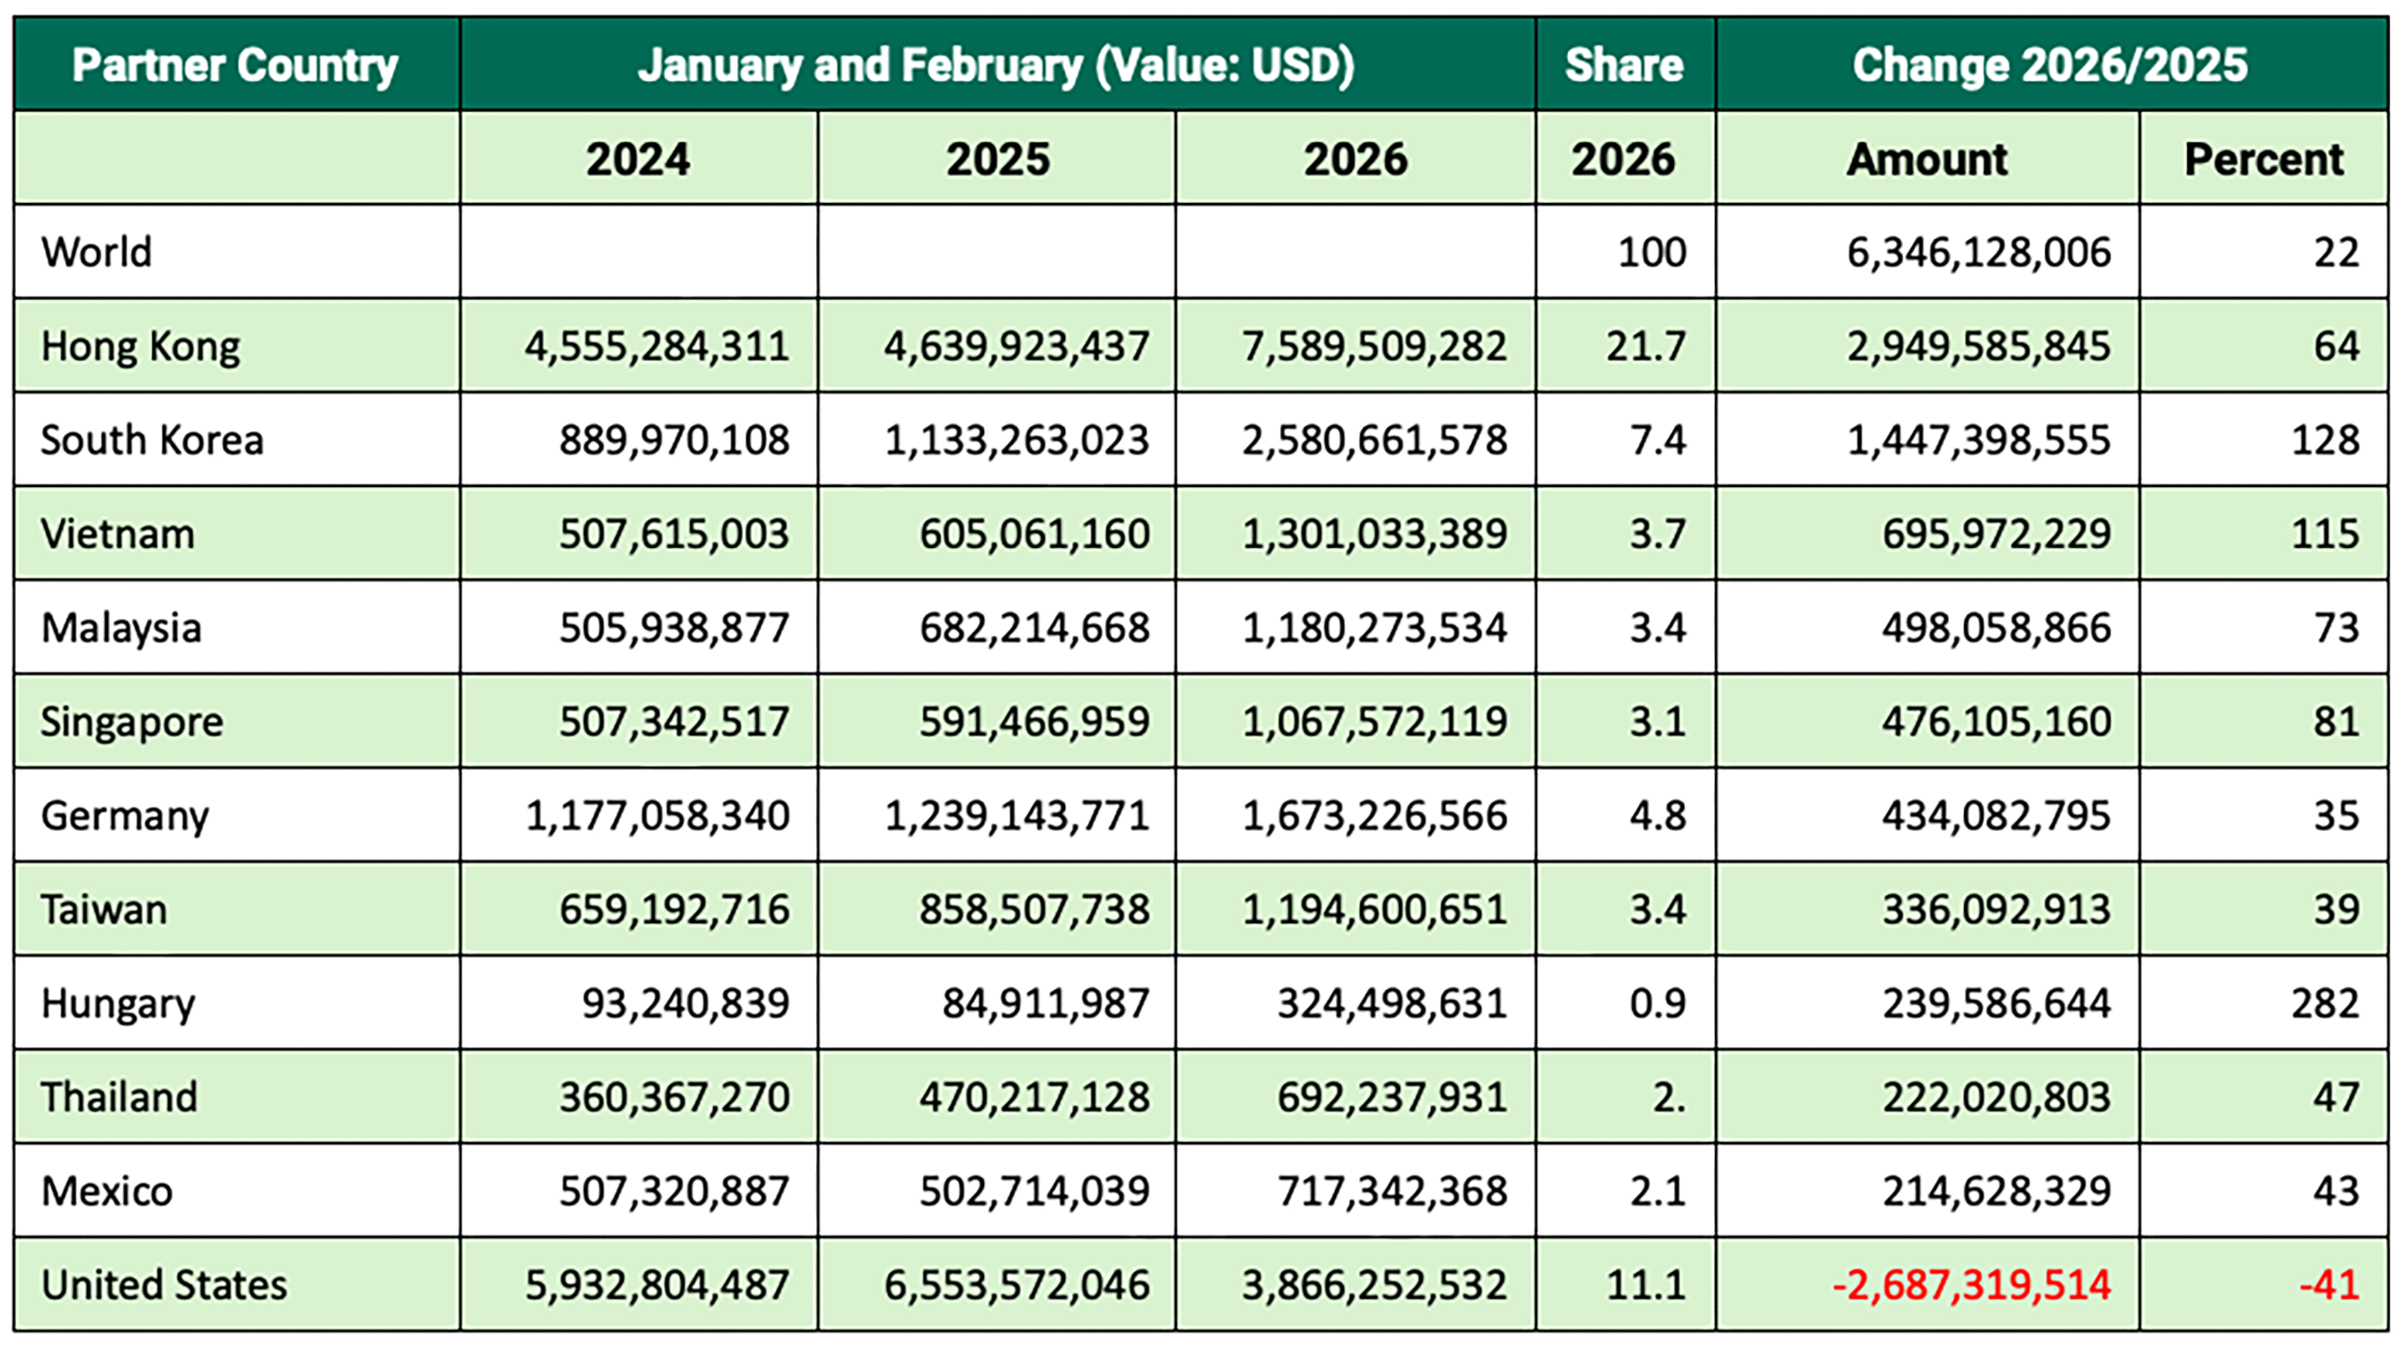
Table 1 illustrates a broad reshuffling of U.S. import sourcing in the first two months of 2026 compared with the same period in 2024 and 2025. The data suggests a redistribution of trade away from traditional suppliers, primarily China, toward other North American and Asian partners:
- Mexico: Remains the U.S.’ top trading partner and has substantially widened its lead over Canada and China. U.S. imports rose to $86.8 billion in early 2026, a 16.9% market share, up from 15.8% in 2024.
- Canada: Saw market share fall to 11.2%, with imports dropping to $57.5 billion. This divergence likely reflects strained U.S.-Canada relations during in the first year of the second Trump administration.
- China: Experienced a sharp decline, as its share of U.S. imports dropped from 13.6% in early 2024 to 7.8% in early 2026.
- Other Asian suppliers: Gained market share, notably Taiwan, Vietnam, Thailand, and Malaysia.
China’s drop is one of the biggest changes in Table 1. Its imports fell from $73.3 billion in early 2025 to $40.0 billion in early 2026 — a significant decline for such a major trading partner— causing market share to drop from 12.1% to 7.8%. Given the escalation in trade tensions between the U.S. and China in 2025, with tariff rates rising above 100% on both sides, it is not surprising to see large changes in the trading patterns between these two countries. The shift away from Chinese imports likely reflects lagged effects from the 2025 tariff shock, the uncertainty around the relationship moving forward, and firms’ efforts to diversify supply chains. While the relationship has stabilized, it is unlikely that trade between the U.S. and China will shift back to the pre-2025 patterns.
Table 1 — US Imports in January and February 2024–26
Diversification and Rerouting in Southeast Asia
- Vietnam: U.S. imports rose to $35.3 billion in 2026, up from $19.1 billion in 2024. This growth nearly doubled Vietnam's share of U.S. imports, rising from to 6.9% from 3.9%.
- Thailand: Imports from Thailand followed a similar trajectory, climbing from $9.1 billion to $18.4 billion over the same period.
- Strategic shift: These strong gains suggest that the supply chain shift away from China is not limited to one substitute supplier. However, a portion of this increase likely represents Chinese goods being rerouted through these intermediary countries.
Taiwan’s Surge and Europe’s Decline
- Taiwan’s growth: Comparing the first two months of 2025 and 2026, total imports from Taiwan nearly doubled, growing from $21.7 billion to $42.8 billion.
- Market share: Taiwan’s share of U.S. imports rose from 3.6% to 8.3%, pushing it ahead of China in the rankings.
- European losses: In contrast, traditional European trading partners lost significant ground. Switzerland’s share dropped from 7.2% in 2025 to 1.3% in early 2026, while Ireland fell from 4.8% to 1.7%.
- The AI factor: While tariff policy influenced these swings, the data indicates that these shifts are also being driven by other factors.
Dual Impact of Tariffs and AI Infrastructure
Comparing the first two months of the year, total U.S. imports from the rest of the world decreased by $91.4 billion, from about $605.5 billion in early 2025 to $514.1 billion in early 2026. Much of the decline in total imports and the shift in trade volumes — such as the decline in direct imports from China — are likely driven by tariff policy changes during the first year of the second Trump administration. Digging into the data on trade shows that another major impact is occurring alongside the impact of changing tariffs. Most notably, new trade patterns related to the expansion of data centers and other AI-related imports are becoming more important.
Trade Policy or AI-Related Demand?
The global trading system is based on a harmonized system of codes — often referred to as HS codes — for all goods so customs agencies know what product is being imported or exported. The 2-digit codes show aggregated data that is broken down further into 4- and 6-digit codes, and a 10-digit breakdown is available at the national level. For example, HS 84 includes nuclear reactors, boilers, machinery, and mechanical appliances, and the related parts of those items. Across all trading partners, U.S. imports in HS 84 rose from $39.9 billion in January and February 2024 to $55.5 billion in the same period in 2025 and $80.5 billion in 2026. For the first two months of the year, the share of imports in HS 84 increased by 13 percentage points, from 53.4% to 66.4%.
Figure 1 shows the increase in imports of HS 84 commodities for the first two months of each year and the breakdown across five countries.
- U.S. imports of HS 84 goods from Taiwan rise from $6.3 billion in 2024 to $11.9 billion in 2025 to $31.1 billion in 2026.
- Comparing the same periods from 2025 to 2026 shows that the increase in imports from Taiwan was 77.1% of the total, while the increase in imports from Mexico was 31%.
- Imports directly from China decreased by $8.0 billion, a decline that likely reflects increased rerouting of Chinese goods through intermediary countries such as Mexico and Taiwan.
- The total increase in HS 84 imports from 2025 to 2026 was $25.0 billion, a figure that significantly outweighs the reduction in imports from China.
Figure 1 — US Imports of HS 84 Commodities
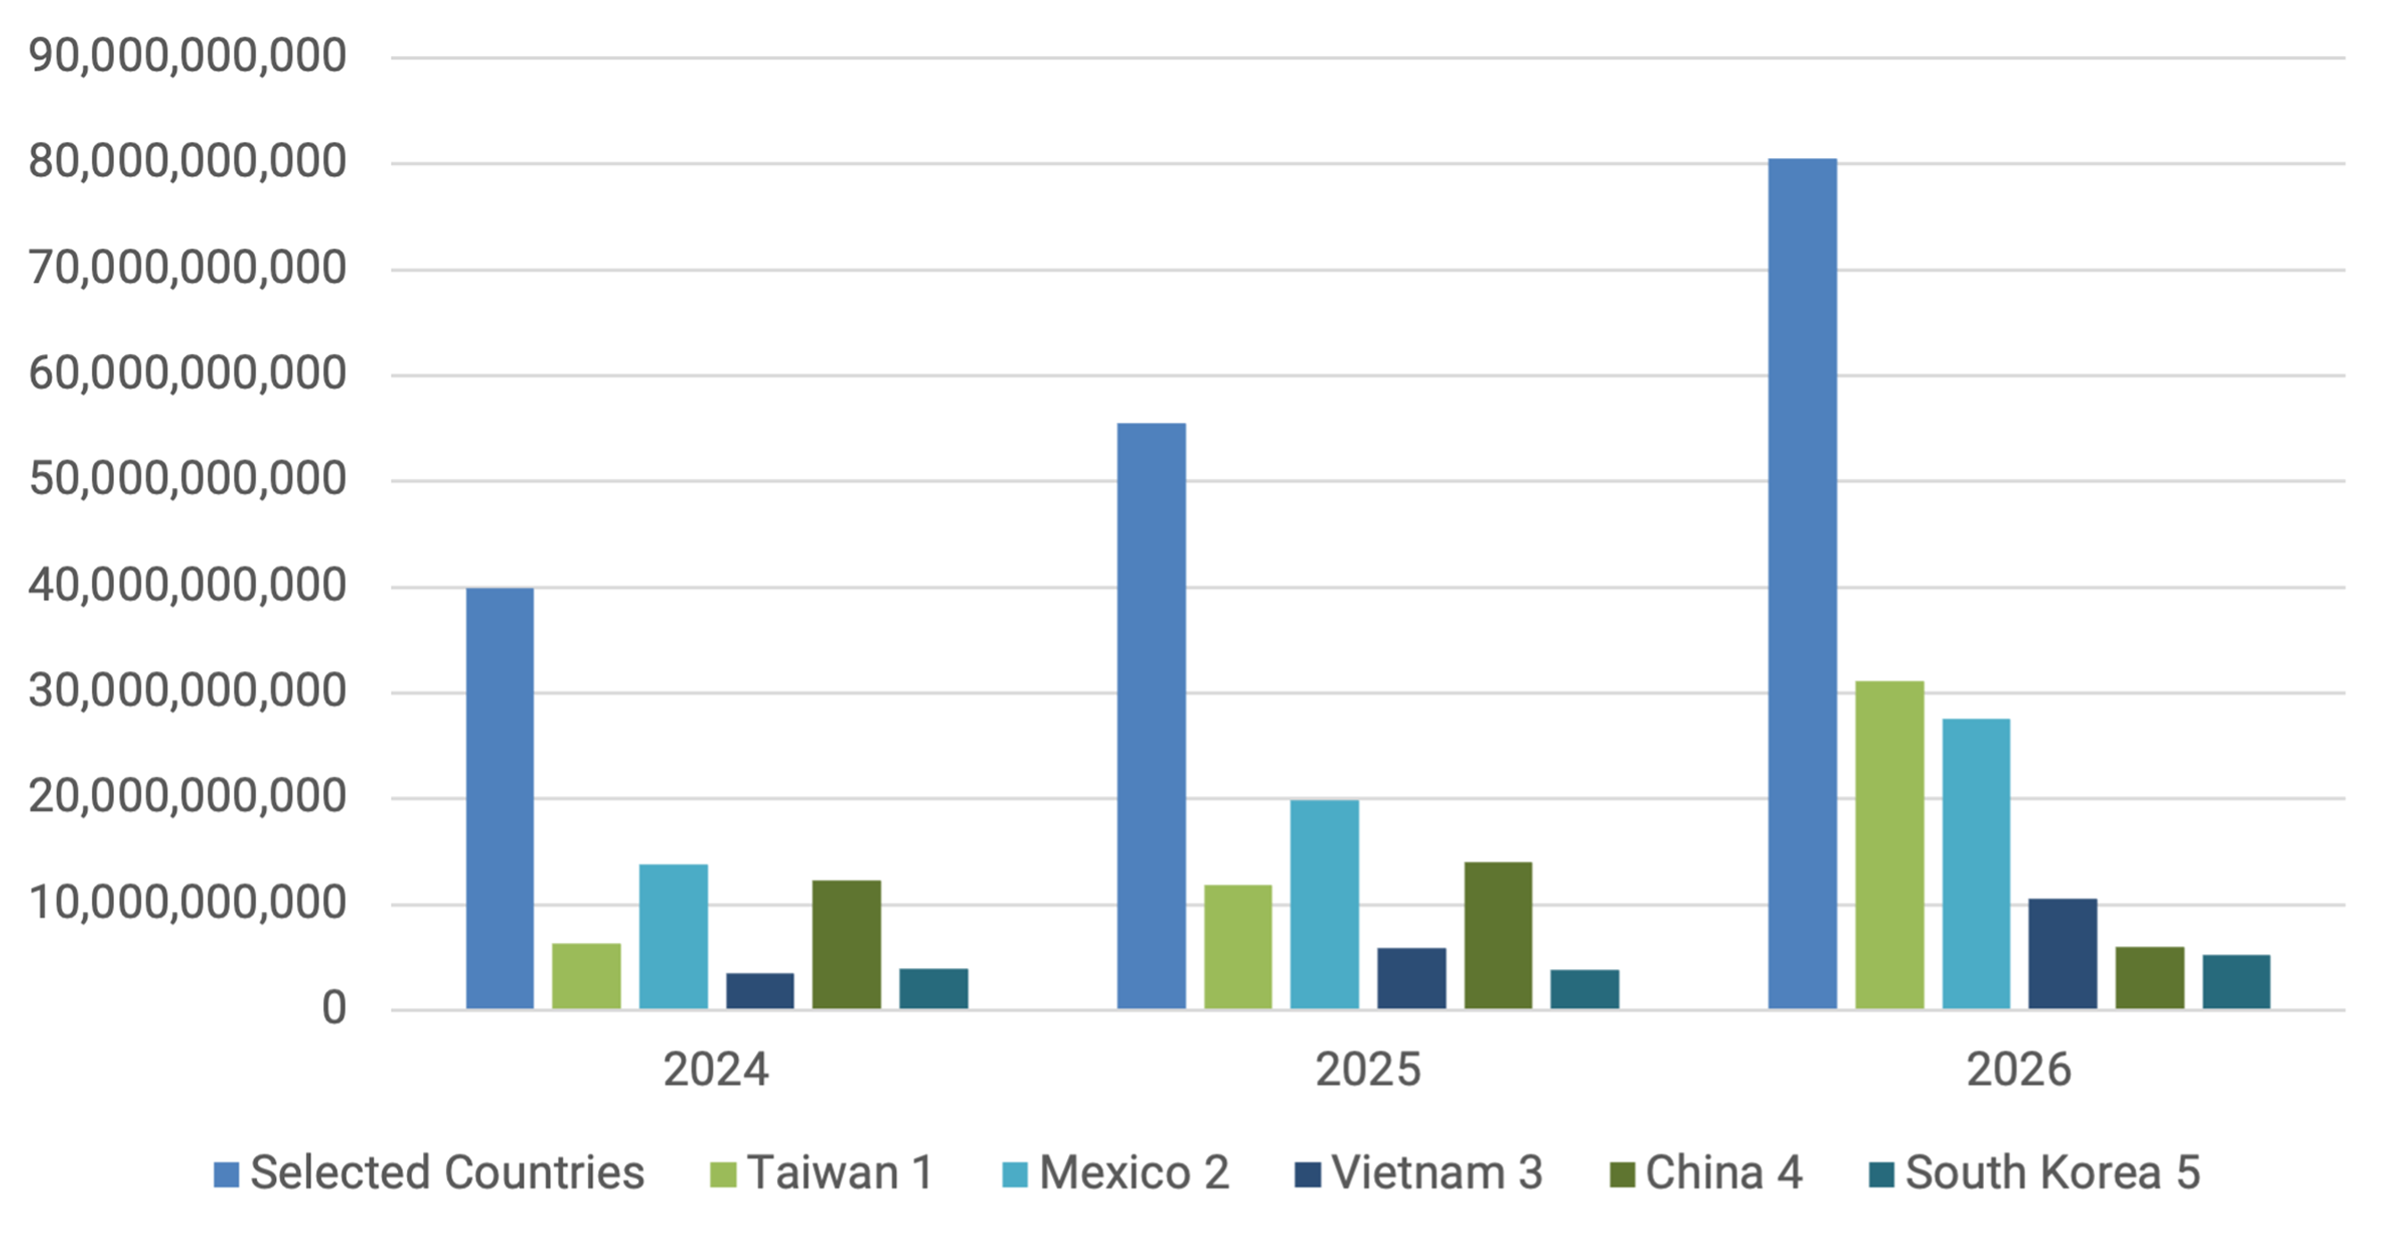
At first glance, Figure 1 seems to indicate strong import growth of machinery. But the composition of HS 84 tells a different story, as nearly all the increase came from two categories:
- HS 8471: Automatic data processing machines.
- HS 8473: Parts and accessories for data-processing and office machines.
Table 2 shows that total imports of HS 8471 rose by roughly $29.4 in the first two months of 2026 compared with the first two months of 2025, which is larger than the increase in total HS 84 imports over the same period. HS 8473 goods increased by $6.5 billion. Those two categories increased by $10.9 billion more than the total increase in HS 84 imports, which implies that the share of other machinery categories must have declined. The data indicates that the significant increase in imports of equipment and machines related to data centers is masking a larger decline in imports of other types of machinery. In fact, the last row of Table 2 shows that the increase is concentrated overwhelmingly in processing units under HS 847150, and thus it is more plausibly tied to the rapid expansion of AI-related and data-center computing demand than to broad-based tariff-driven trade diversion alone.
Table 2 — US Imports of HS 8471 and HS 847150 Commodities
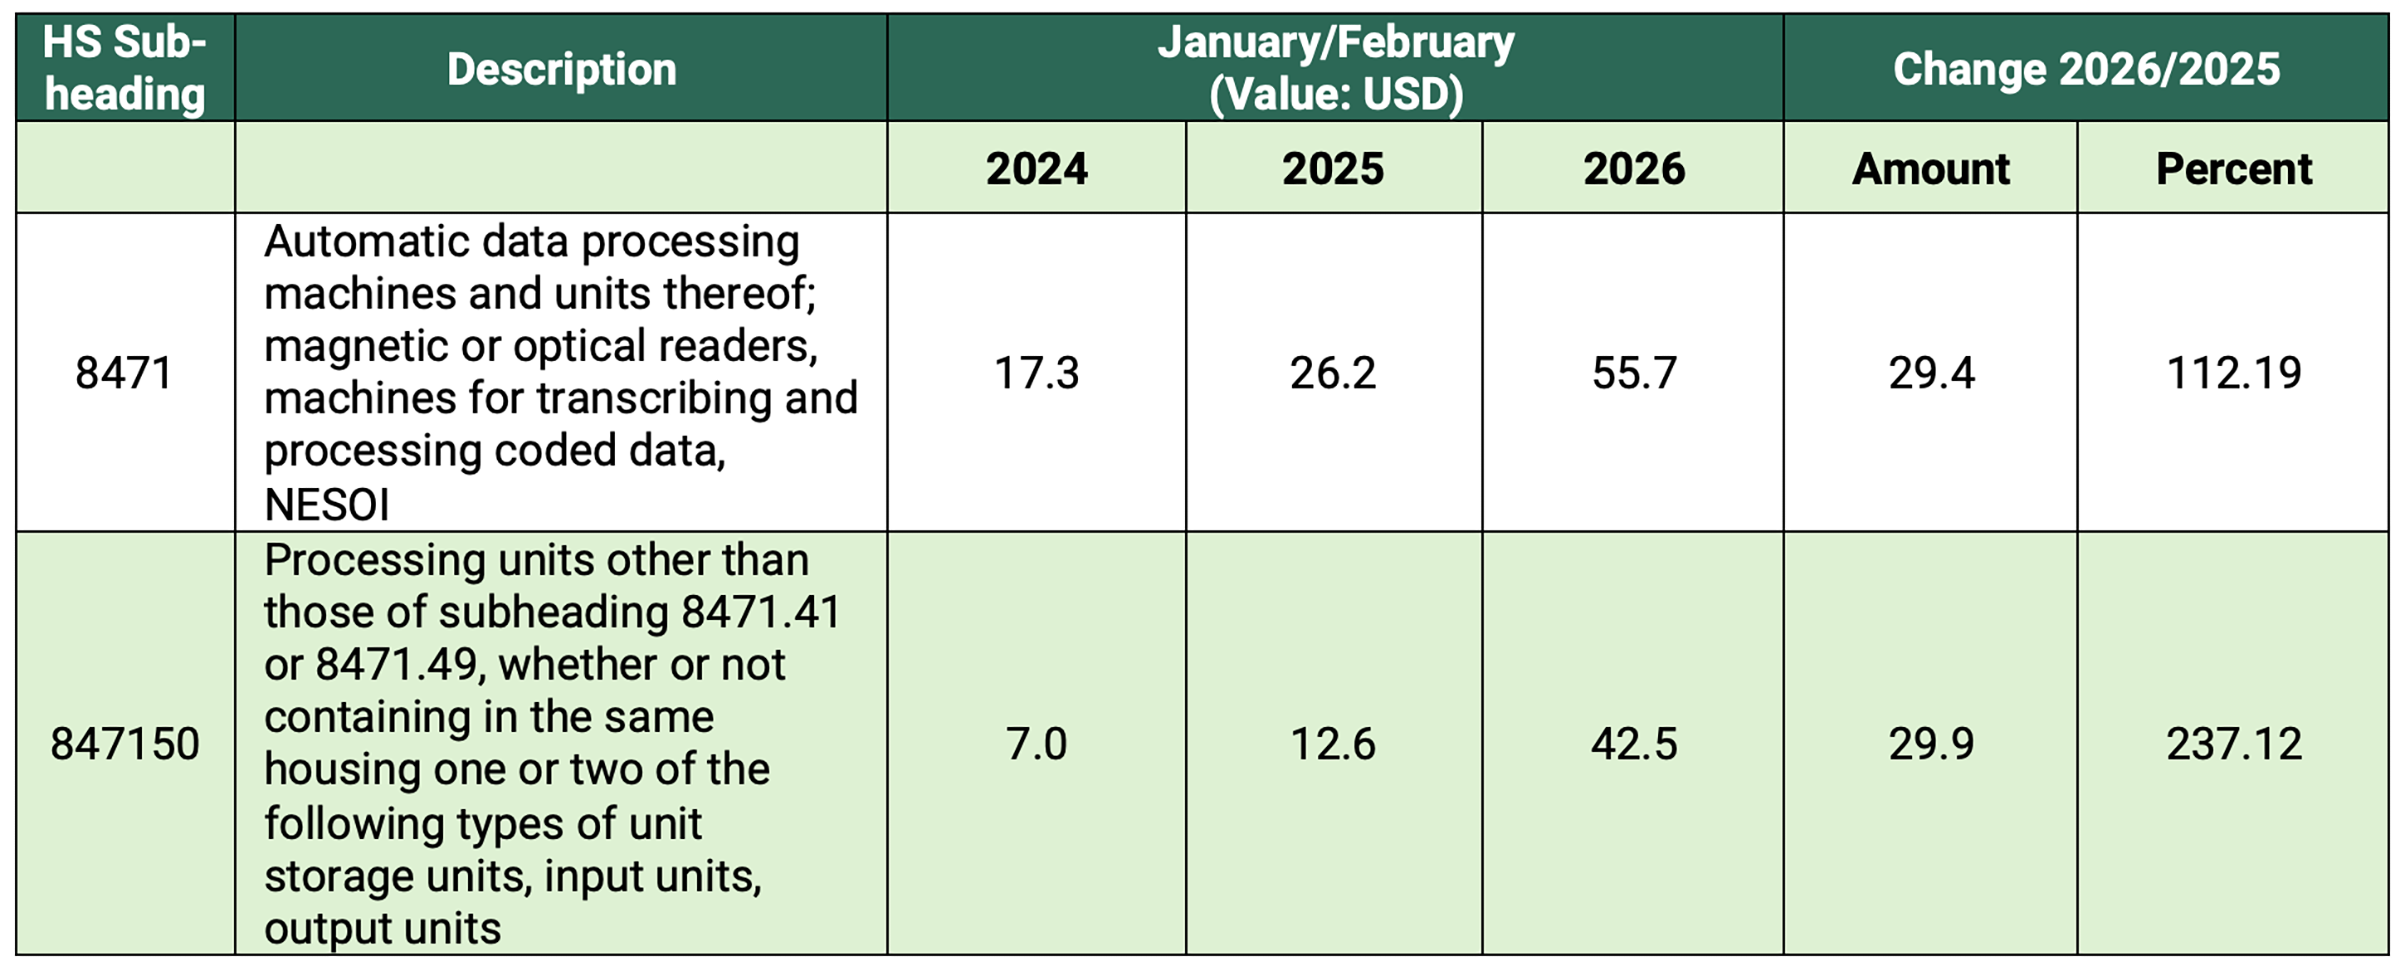
Note: NESOI stands for “not elsewhere specified or included.”
The observed shifts in trading patterns appear to reflect several different forces. The decline in China’s share is consistent with tariff pressure, policy uncertainty, and supply-chain diversification. However, the surge in imports from Taiwan appears to be very different. South Korea’s early 2026 import growth in HS 84 appears linked to the same broader computing and AI buildout visible in Taiwan, but it is slightly different. While Taiwan’s surge is concentrated in processing units, South Korea’s increase is concentrated in parts and accessories for automatic data-processing machines.
Interpreting Recent Trade Patterns
This pattern supports a simple interpretation. Trade policy changes (e.g., tariffs) are putting downward pressure on imports in many traditional categories, especially where tariffs, restrictions, or supplier shifts are biting. But the AI infrastructure boom is offsetting part of that decline by sharply increasing imports of processing equipment, computing hardware, and other related parts and machines.
In other words, the aggregate data does not show tariffs failing to matter. They show tariff effects being partly masked by a separate and unusually strong wave of demand tied to AI. This also helps explain country patterns:
- The decline in China’s share looks consistent with trade policy and geopolitical diversification.
- The rise of imports from Mexico fits a nearshoring story, though its growth is also supported by a rise in demand for computing equipment.
- Taiwan looks completely different. Its surge is almost entirely concentrated in processing units, indicating this is an AI-related expansion showing up in the trade data not a tariff-diversion story.
This distinction matters for policy analysis. If overall import numbers are supported by a narrow set of AI-related categories, then aggregated trade data can be misleading. A rise in total machinery imports does not necessarily mean tariffs are having little effect. Instead, it likely represents a powerful investment cycle in AI hardware that is overwhelming weakness elsewhere.
The current trade data should not be interpreted simply as a success or failure of trade policy. It is better understood as a combination of:
- A supplier reallocation caused by tariffs and policy risk.
- A surging demand for AI-related computing equipment.
- Weaker performance in more traditional machinery and equipment.
Supporting Evidence on AI-Related Trade Flows
A recent working paper by Michael E. Waugh shows that the AI-related data center boom is now a major force in U.S. trade. Waugh uses a large language model (LLM) to classify HS10 trade codes tied to AI infrastructure and finds that AI-related products made up 23% of U.S. imports in 2025, with imports rising 73% since 2023. The paper argues that AI-related imports have widened the U.S. goods trade deficit by nearly $200 billion, while many AI inputs have been shielded from tariffs through exemptions.
Waugh identifies 655 HS10 codes — out of over 18,000 total HS10 codes in U.S. trade data — as highly relevant to AI data center construction and operation. The codes identified encompass the infrastructure required for data center buildout, including:
- Computing and hardware: Servers and processing units.
- Power and cooling: Electrical systems and thermal management.
- Networking and materials: Connectivity components and specialized raw materials.
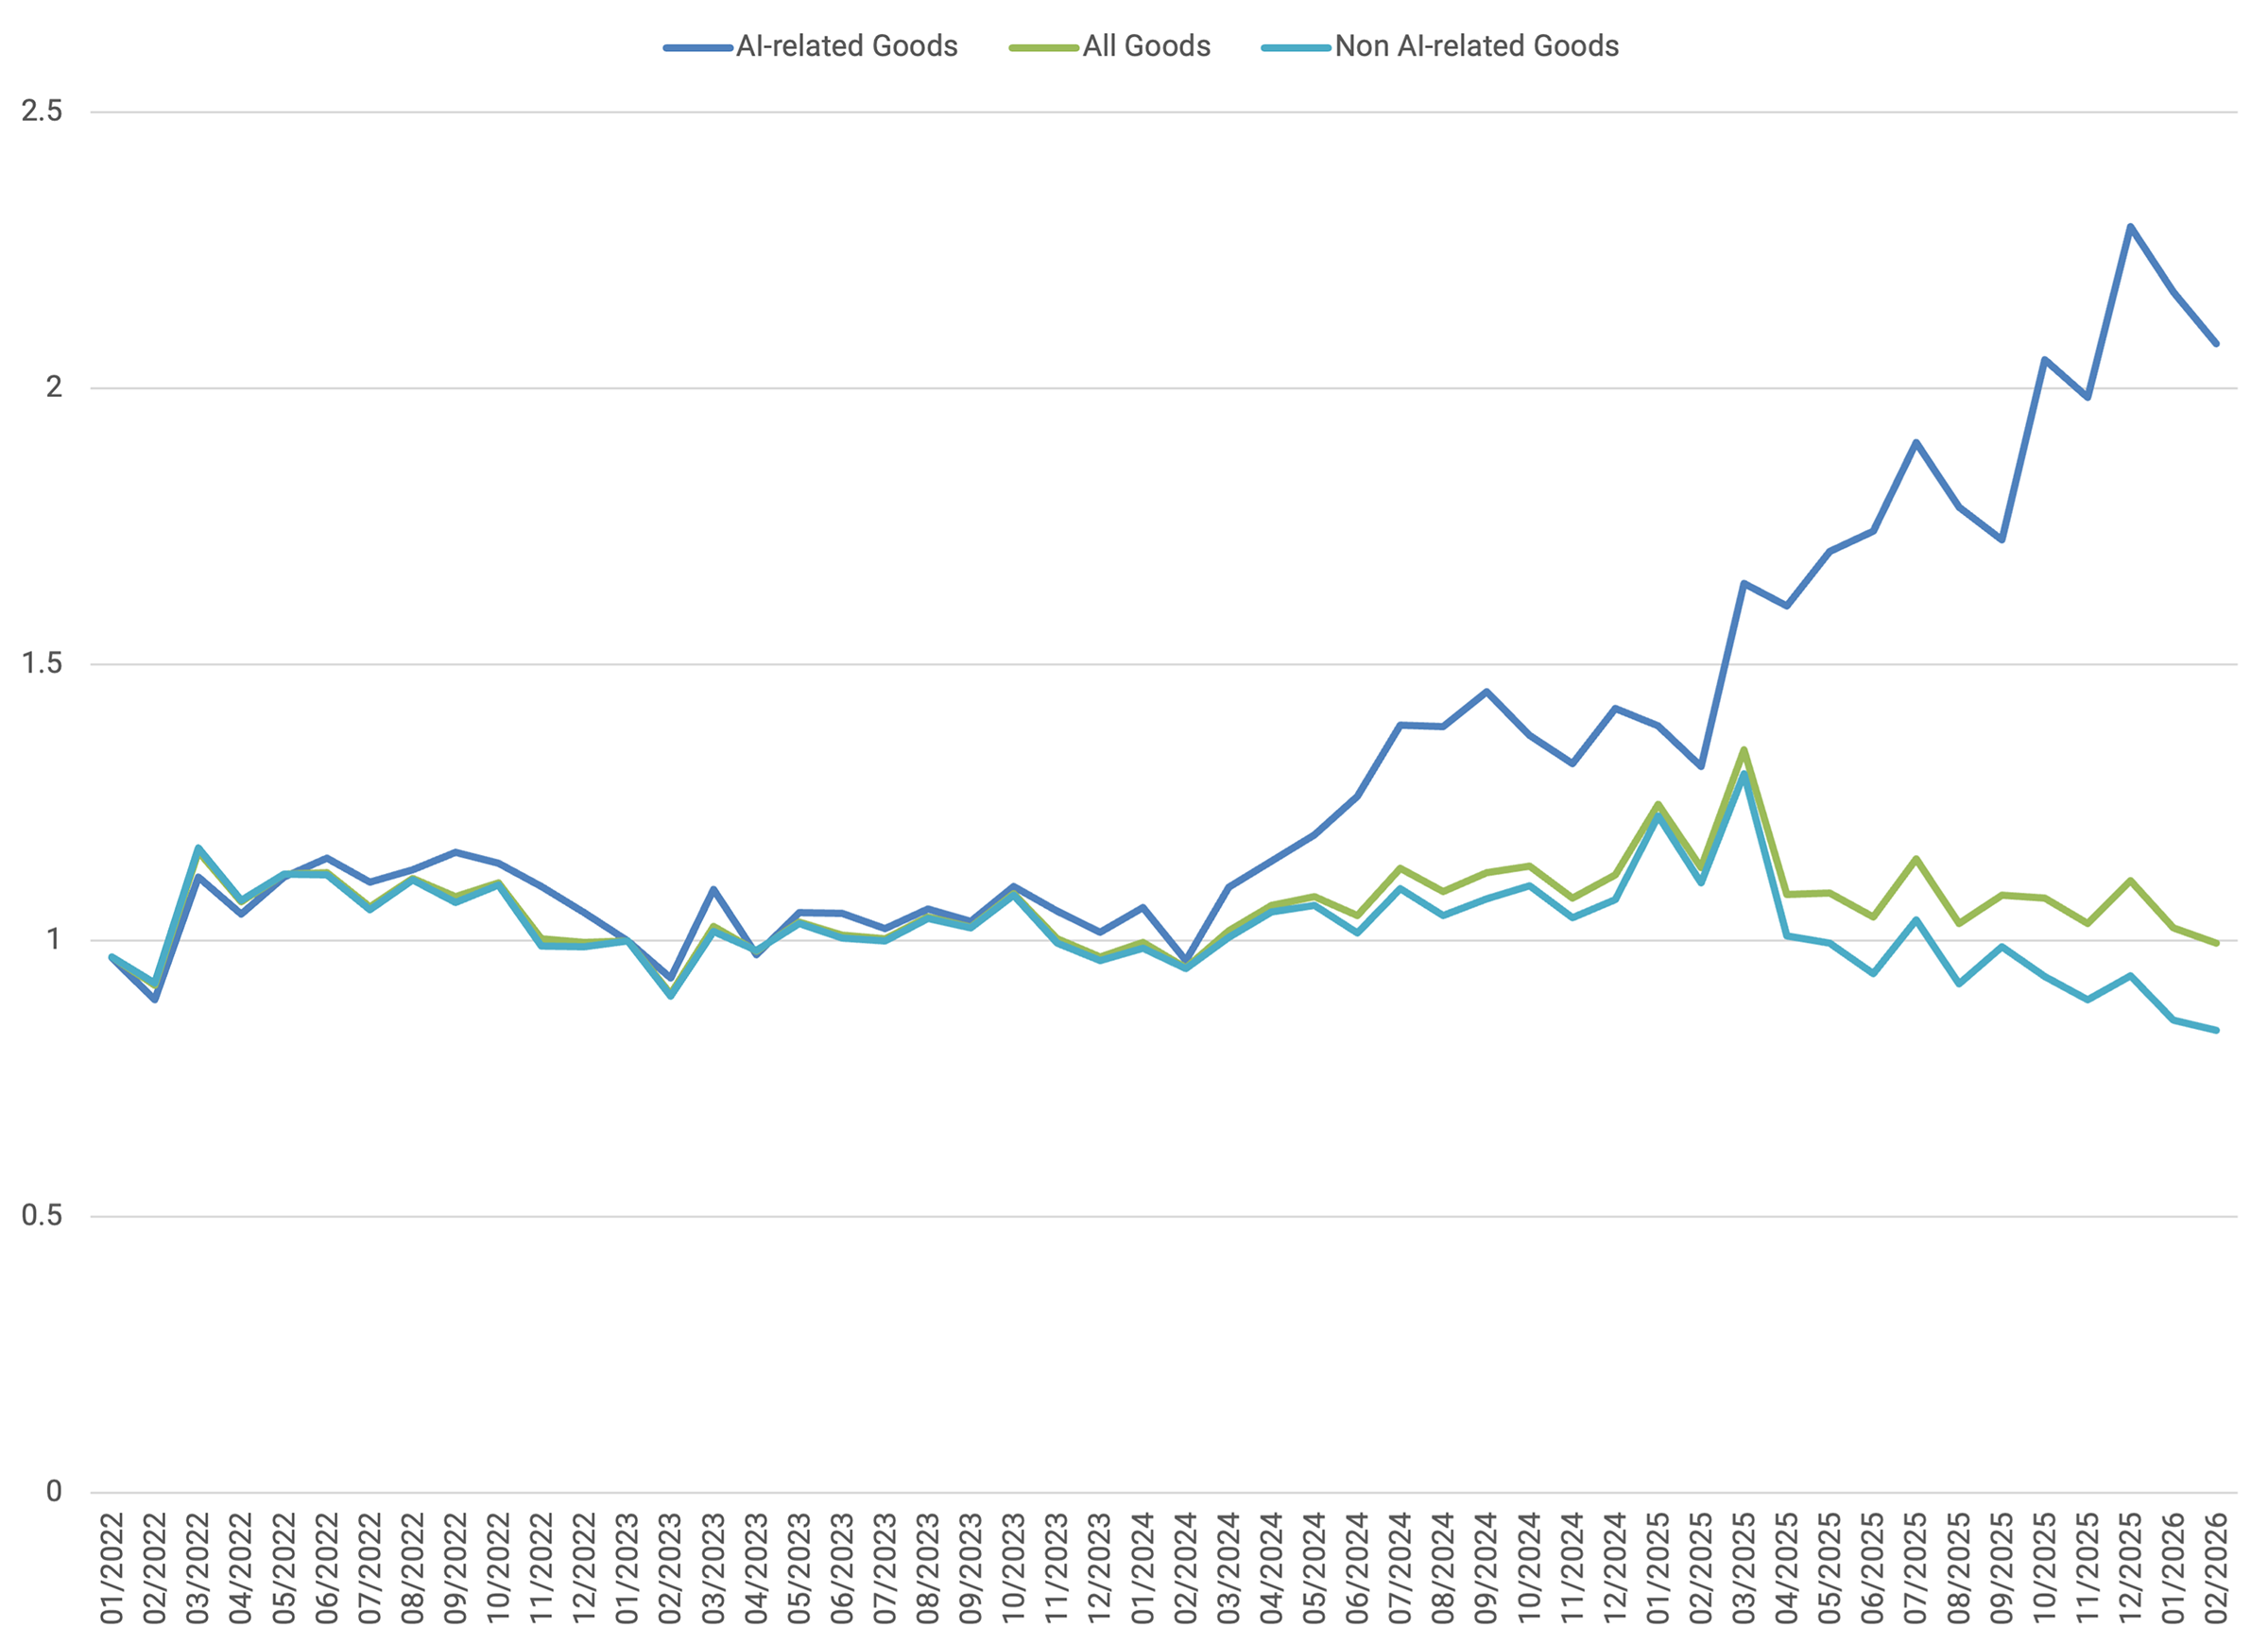
This analysis uses Waugh’s 655 code framework to derive specific estimates and category-level results to verify the outcomes presented above. Figure 2 recreates Waugh’s original chart using data from Trade Data Monitor to cross-check this brief’s findings.
Beginning in early 2024, Figure 2 shows a sharp divergence between AI-related goods and the rest of trade. While overall imports remain relatively flat and non-AI goods trend downward, AI-related imports rise rapidly — more than doubling relative to their 2023 baseline by late 2025. This pattern suggests that the AI data center buildout is driving a disproportionate share of recent trade growth, even as broader goods trade stagnates or declines. This is very similar to the results presented in Waugh’s Figure 1.
Figure 2 — AI-Related Goods, Non-AI-Related Goods, and All Goods
In addition to the rise in the level of AI-related imports, there is also a significant shift in which countries source the imports that the U.S. needs for the AI buildout. Figure 3 shows a reshuffling in the top sources of AI-related imports from early 2024 to early 2026.
- In 2024, Mexico was clearly the largest supplier, with China and Taiwan well behind.
- By 2025, Mexico had grown significantly and remained the top source, while Taiwan moved into second place.
- By 2026, Taiwan surged into first place, adding over $20 billion in output, but Mexico also continued to grow substantially and remained a very strong second, far ahead of the rest of the top five.
The main story is not just Taiwan’s rise, but the growing dominance of Taiwan and Mexico together in the AI-related goods trade.
Figure 3 — Top Five Sources of AI-Related Imports for the US
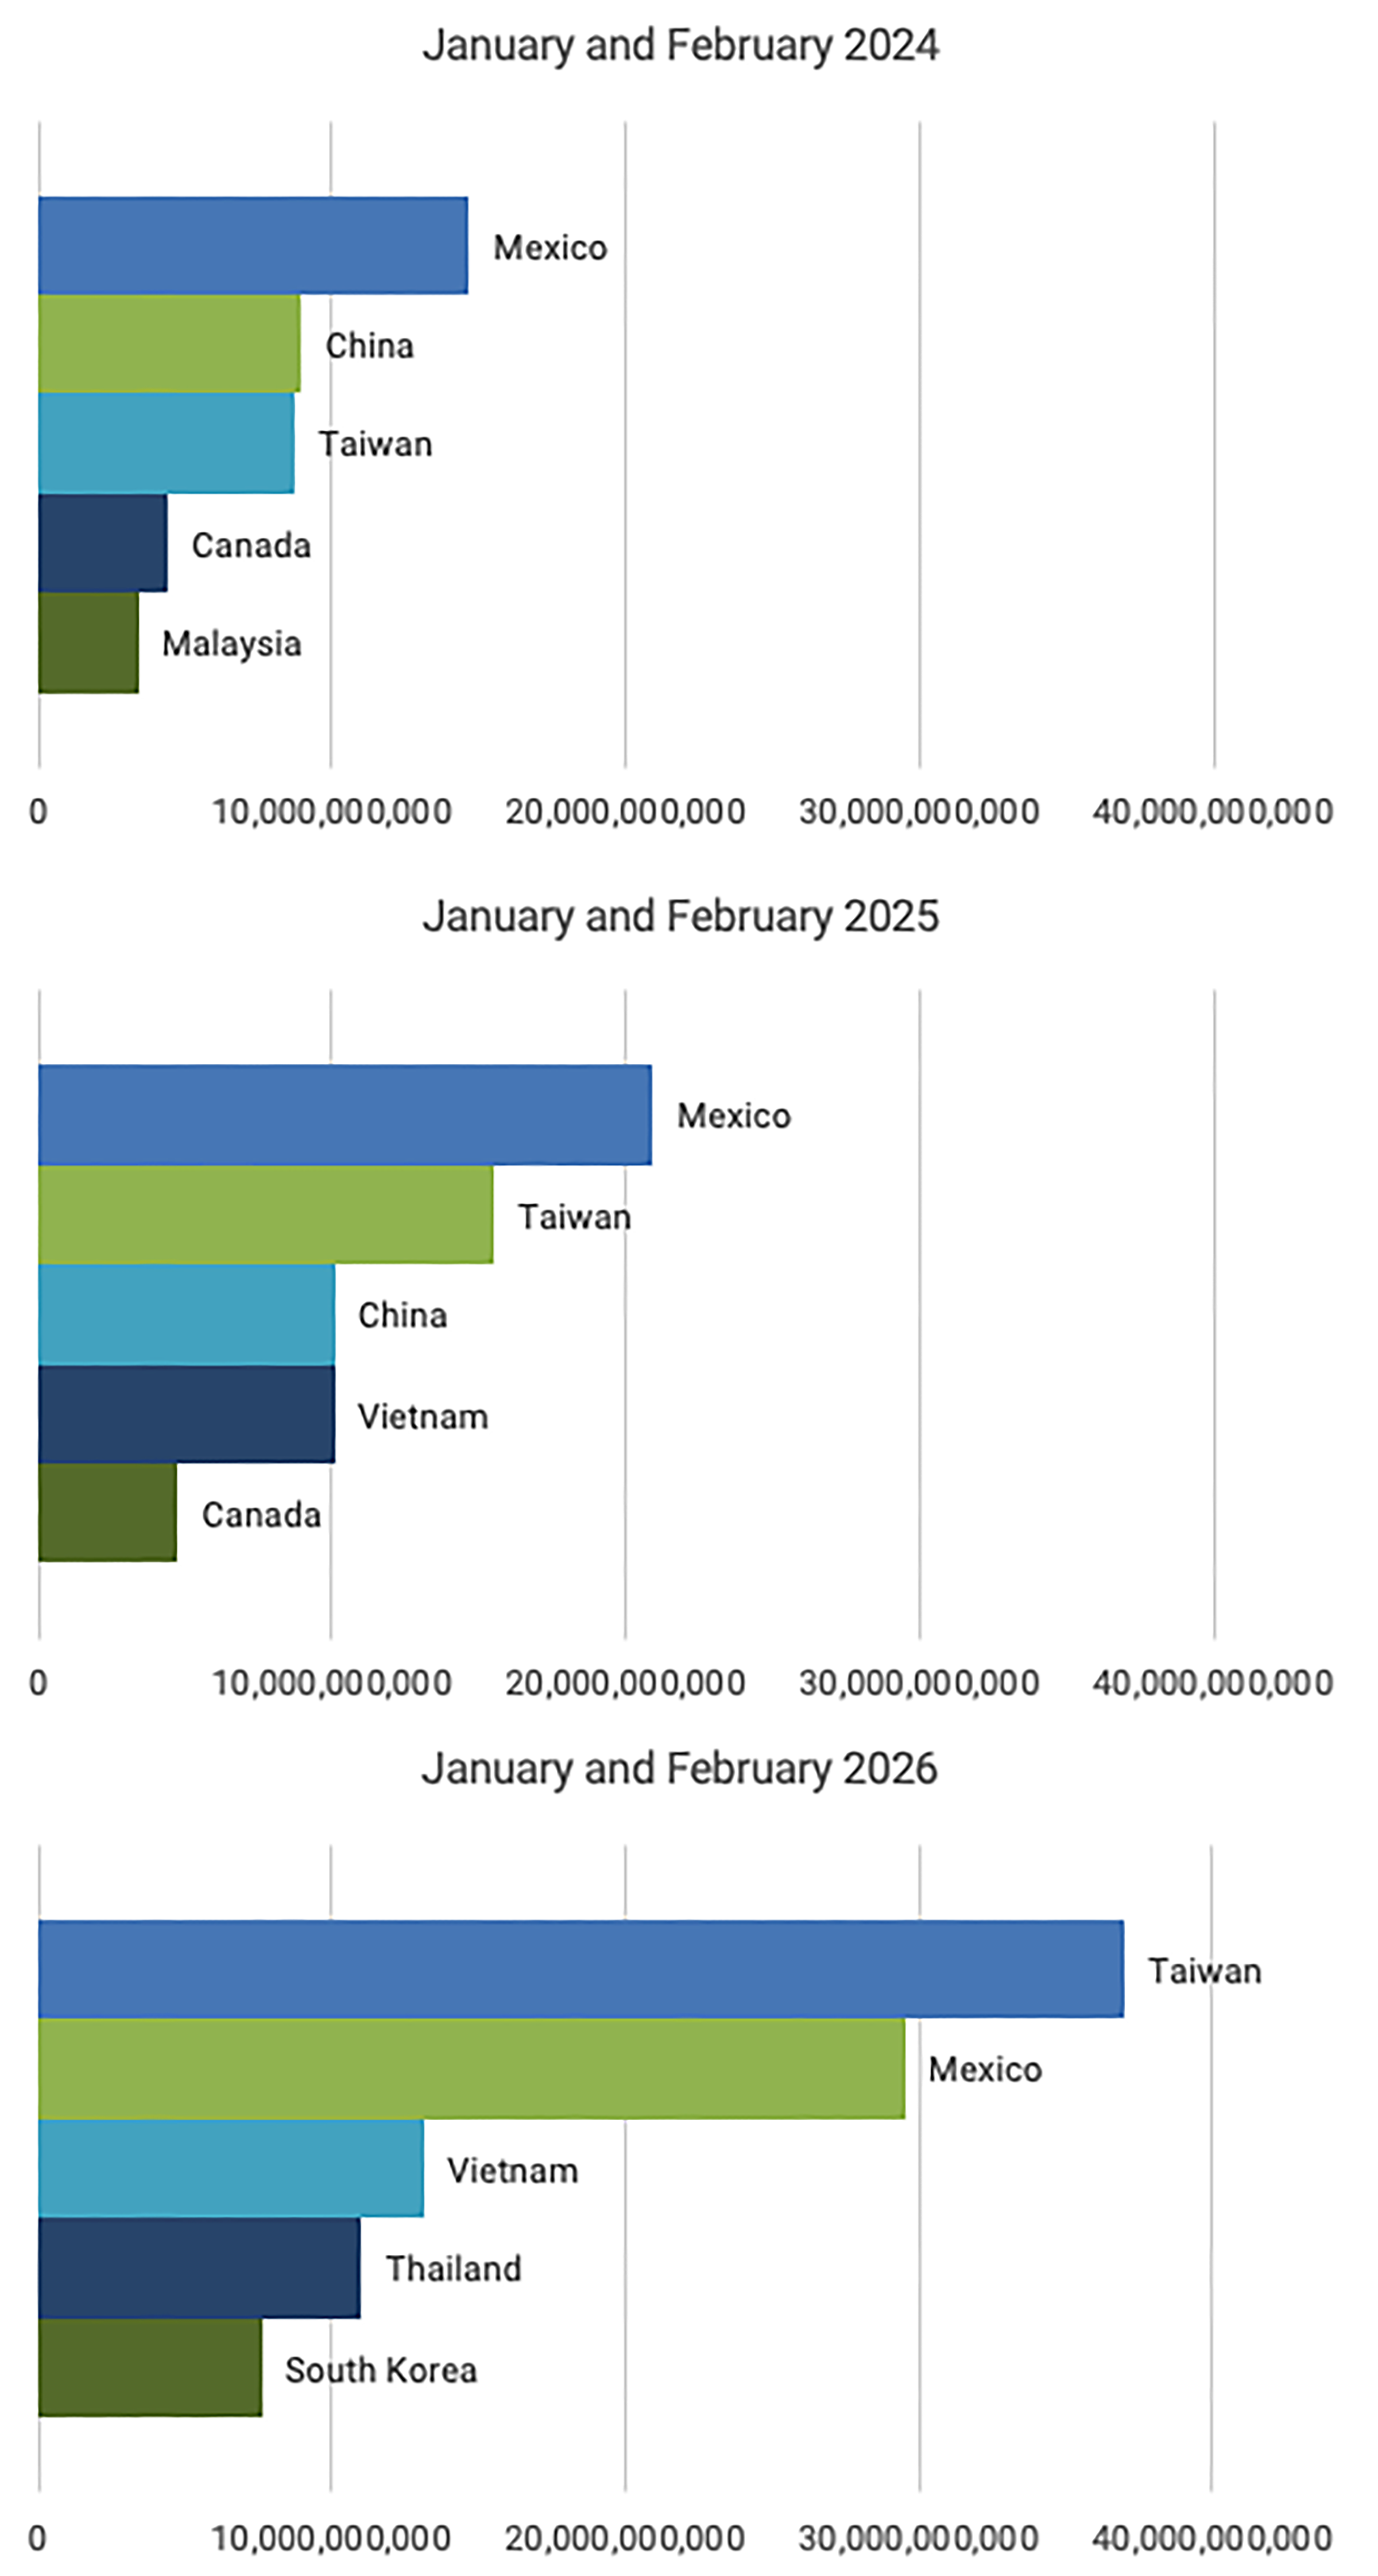
Figure 3 shows a clear shift toward Asia, excluding China. While Taiwan rises sharply, Vietnam, Thailand, and South Korea enter or rise within the top five. At the same time, China falls out of the top five by early 2026, suggesting that AI-related supply chains are moving away from direct China sourcing. Some of this could reflect transshipment or rerouting through third countries. But ultimately, Taiwan and Mexico are becoming the dominant direct suppliers, while China’s direct role in U.S. AI-related imports appears to be declining.
Table 3 shows China’s exports of HS Codes 8471 and 8473, goods that make up a significant share of AI-related goods. If the rise in U.S. AI-related imports from Taiwan and Mexico was primarily the result of Chinese goods being rerouted, China’s exports to those intermediary countries should rise by a similar amount. Instead, the increases in U.S. imports from Taiwan and Mexico are significantly larger than the corresponding increases in China’s exports to potential pass-through countries. Together Taiwan and Mexico saw increases of roughly $30 billion from early 2025 to early 2026, while the total increase in China’s exports was only $6.3 billion over the same period.
The scale of the increase makes a pure transshipment explanation unlikely. This suggests the pattern is better explained by a real reorganization of AI-related supply chains, with Taiwan expanding as a major source of advanced computation hardware and Mexico playing a growing role in assembly, integration, and nearshoring. Some transshipment may still exist, but the data fits the story of production and supply-chain relocation as opposed to rerouting. In addition, the last row of Table 3 shows that China’s exports to the U.S. have fallen by roughly $2.7 billion in early 2026 relative to early 2025, making it even less likely that transshipment plays a major role in driving these numbers.
Table 3 — China’s Exports of HS Codes 8471 and 8473
Conclusion
Trade data from early 2026 should not be viewed as a simple verdict on whether tariffs are achieving their intended goals. This would confound the impacts of two forces moving at the same time. Tariffs, policy uncertainty, and geopolitical risk are changing sourcing patterns, particularly by reducing direct dependence on China and pushing imports toward Mexico, Taiwan, Vietnam, Thailand, and South Korea. But the AI infrastructure boom is also creating a large, separate surge in demand for computing equipment, processing units, and related parts. That demand is strong enough to mask some of the import-reducing effects of tariffs in the aggregate data.
This distinction matters for policy. If AI-related imports keep rising as data-center investment expands, headline trade numbers may make tariffs appear less disruptive than they truly are for traditional manufacturing, machinery, and other investment goods. In effect, AI imports are cushioning the overall trade decline while other categories weaken beneath the surface. Rather than broad-based import strength, the data reflects a concentrated investment boom in the goods needed for AI and data centers.
Going forward, these forces are likely to become even more important. Continued investment by hyperscalers, data-center developers, utilities, and semiconductor supply chains will increase demand for imported computing hardware, power equipment, cooling systems, and related components. At the same time, tariffs and uncertainty may continue to discourage other forms of investment, especially in sectors that rely on imported inputs but do not receive the same boost in demand from AI.
The broader policy lesson is that trade policy cannot be evaluated using aggregate import totals alone. Tariff-driven supplier reallocation needs to be separated from demand-driven AI investment. Otherwise, there is a risk of overstating the impact of tariffs and missing the extent to which AI, energy demand, supply-chain security, and infrastructure constraints will shape the next phase of U.S. trade.
This publication was produced by Rice University’s Baker Institute for Public Policy. Wherever feasible, the material was reviewed by outside experts prior to release. Any errors or omissions are solely the responsibility of the author(s).
This material may be quoted or reproduced without prior permission, provided appropriate credit is given to the author(s) and Rice University’s Baker Institute for Public Policy. The views expressed herein are those of the individual author(s) and do not necessarily represent the views of Rice University’s Baker Institute for Public Policy.


