About The Dashboard
Purpose
This dashboard integrates demographic data with natural disaster records to help visualize the historical record to elevate discussions and research on factors contributing to increasing financial impacts from natural disasters across the United States.
Note: For the best experience, please use a desktop browser. Performance on tablets or mobile devices may be limited.
For questions or feedback, please contact [email protected].
Layers and Data Sources
Category | Description | Data Period | Data Source | Date Retrieved |
Demographics | ||||
Population density | Population density at the county level | 1950-2020 | 2/1/2025 | |
Urbanized tracts | Urbanization year indicates if and when each tract became “urbanized” | 1950-2020 | 2/1/2025 | |
Natural Disasters | ||||
Hurricanes | Hurricanes, tropical storms, and depressions that made landfall | 1950-2024 | International Best Track Archive for Climate Stewardship (IBTrACS) | 2/1/2025 |
Tornadoes | Tornado tracks and fatalities | 1950-2024 | 5/1/2025 | |
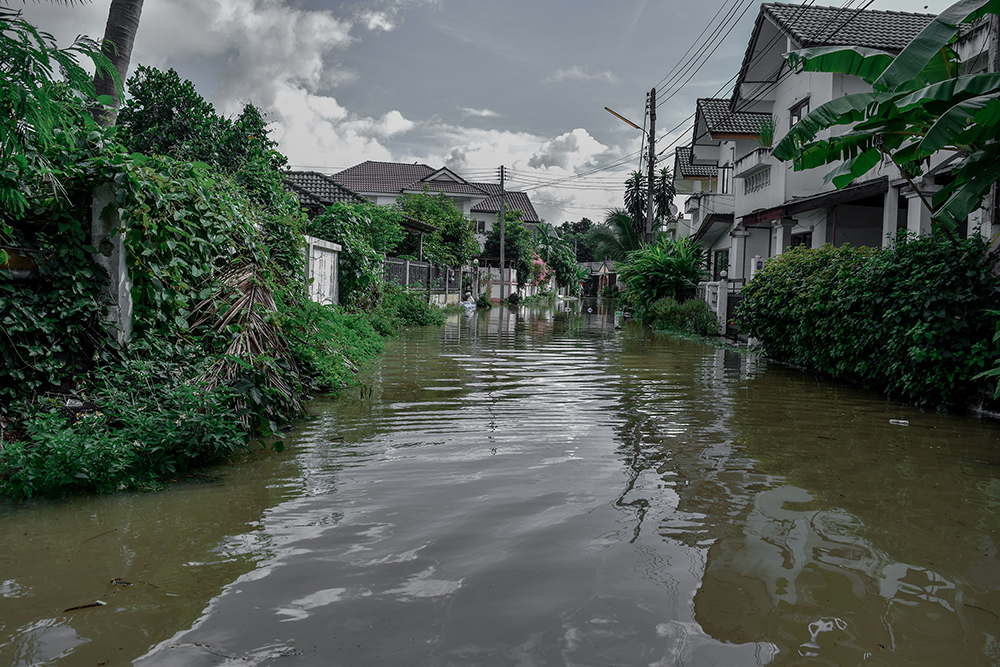
Floods | Flood and flash flood location, duration, and damage | 2001-2025 | 7/18/2025 | |
Fires | National wildfire perimeter history | 1950-2025 | 8/1/2025 | |
Energy Infrastructure | ||||
Power plants | Oil & Gas; Solar; Wind; Hydro; Geothermal; Coal; Nuclear; Biomass | 1910-2025 | 10/21/2024 | |
Electric power transmission lines | Electric power transmission lines from 69 KV up to 765 KV. Underground transmission lines are included where sources were available. | 2025 | Homeland Infrastructure Foundation-Level Data through GIS Online | 4/1/2025 |
Petroleum refineries | Petroleum refineries with capacity, location, and company, etc. | 2024 | 4/1/2025 | |
Natural gas processing plants | Natural gas processing plants with capacity, location, operator, etc. | 2023 | 4/1/2025 | |