
Author(s)

Introduction
For nearly two decades, U.S. federal government debt as a share of the economy has grown continuously, with acceleration since the start of the Great Recession in the late 2000s. Throughout most of this period, U.S. taxpayers benefited from historically low interest rates that dampen the cost of federal borrowing and insulate the private sector from adverse effects of government debt growth. Economic theory predicts that after enough time, however, uncontrolled debt growth will strain the economy through higher interest rates and the anticipation of aggressive fiscal intervention. The possibility of this outcome motivates the question, for how long can the current economic environment keep this from happening?
Over any projected time horizon, the range of potential economic outcomes is bounded by two possibilities. In a best-case scenario, the federal government and private borrowers continue benefitting from low-interest debt with no interference with the domestic economy. At the other extreme, both domestic and international investors cease lending to the U.S. federal government, leading to aggressive fiscal intervention and soaring interest rates that crowd out private investment. In the most extreme circumstance where the most aggressive fiscal policy is unable to finance federal debt outlays, the government may be cornered into sovereign default.
Whether policymakers choose to continue growing federal debt along this path will reflect the will of the electorate, but all parties should understand the risks and limitations associated with this decision. Risks to the domestic economy arrive in the form of internal factors, such as private investment crowd-out, and external factors, such declining foreign demand for U.S. federal debt. Determining whether mounting government debt triggers an economic contraction or continues growing inconsequentially requires an evaluation of projected domestic and international asset market factors. Accordingly, this issue brief studies U.S. capital markets to provide a long-term outlook on the macroeconomic consequences of unbalanced debt growth.
How Big Is Government Debt?
In 2018, the U.S. Department of the Treasury reported a total federal debt stock of $21.5 trillion, which is approximately the size of the entire U.S. economy as measured by Gross Domestic Product (GDP).1 Federal government agencies, such as the Social Security Administration, hold around a quarter of all federal debt, reducing net public obligations to 77% of GDP. Since the federal government’s net debt position reflects the share of government securities sold in financial markets, it is the relevant measure for determining the economic impact of government debt growth.2
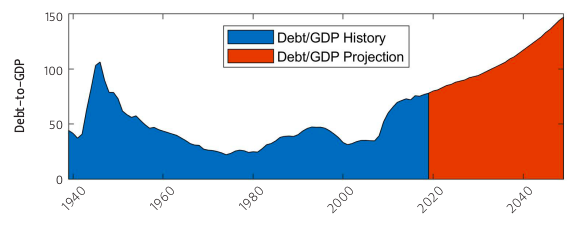
By historical standards, federal debt-to-GDP today remains elevated but well below its peak. The highest measurement followed World War II when net outstanding debt as a share of GDP rose to 106% in 1946. After reaching that peak, the federal government immediately began aggressively paying off this debt, and the ratio declined to 79% just two years later. By 1956, only 10 years after peaking, the post-war debt as a share of the economy declined by more than half as the ratio fell to 49%. This decline resulted mostly by holding the level of debt constant as economic growth accelerated.
The ratio steadily declined over the next two decades until it reached a trough of 22% in 1974. Starting in that year and continuing until the early 1990s, average debt growth exceeded average economic growth, leading to a rise in debt-to-GDP. After climbing to 47% in 1993, fiscal austerity efforts again led the U.S. on a declining debt path until 2001, when debt bottomed out at 31.4% of GDP. Despite a recession in 2002 and a subsequent surge in defense spending, debt-to-GDP only rose modestly and stabilized at just under 35% in 2007. As the Great Recession hit, economic growth declined and government borrowing soared. Over the next seven years, debt-to-GDP more than doubled to nearly 73% in 2014. Although the growth rate of debt declined in recent years, sizable tax cuts in 2017 and a steady rise in government spending brought the debt up to nearly 77% of GDP in 2018.
Long-term projections show that debt growth is expected to continue indefinitely. Over the next 30 years, the Congressional Budget Office (CBO) expects government debt to once again double as it grows to 147% of GDP.3 Although this forecasted value is more than 40 percentage points above its historical peak in 1946, evidence suggests that federal debt growth in this economy may look very different than it did nearly a century before.
Figure 1 — Federal Debt as a Share of GDP
Government Debt in Financial Markets
Economic theory predicts that new issuance of government debt competes with businesses, entrepreneurs, and other borrowers in financial markets.4 If the government is unable to find a lender at a particular borrowing rate, then it must attract investors by offering a higher rate of return. Such a move drives up the interest rate in broader asset markets, as private borrowers must also compete with the government for lenders. The heightened market interest rate increases businesses’ cost of capital, which discourages business investment. This is the channel through which federal debt is said to crowd out private investment, generally resulting in adverse economic outcomes.
Whereas businesses, governments, and other private entities tend to borrow money, lenders generally consist of households mediated by banks and financial institutions. Even though most households use debt to finance certain expenditures, such as cars and houses, their net assets are largely positive. As many as 80%-90% of U.S. households have a positive net worth, with much of that invested in financial markets.5 In addition to domestic households, lenders also consist of international investors, like foreign households or governments. At the end of 2018, for example, foreign investors held 40% of all outstanding U.S. federal debt.6
Like all other markets, financial market outcomes materialize through a supply and demand process. Lenders supply assets, borrowers demand assets, and the interest rate rations the allocation of assets in the economy. An increase in supply of assets drives down the interest rate, whereas an increase in borrowing demand, such as government debt issuance, drives up the interest rate. According to this theory, it may seem surprising that a sharp rise in government debt over the last several years has not led to higher interest rates—unless other market factors are counteracting it.
Why Are Interest Rates So Low?
In a four-part series titled “Why Are Interest Rates So Low?” former Federal Reserve Chairman Ben Bernanke (2015) identified two possible hypotheses explaining the persistent decline in interest rates over the past few decades.7 The first explanation, dubbed the secular stagnation hypothesis, points to declining business investment resulting from structural factors like demographic changes.8 The second explanation, which Bernanke advocates, attributes international factors he calls the global savings glut. He notes that a surge in national savings starting in the mid-1990s by Asian countries, such as China, and oil-producing countries, such as Saudi Arabia, that increased international asset supply, driving interest rates down across the globe.9
Bernanke discounts the secular stagnation hypothesis, claiming that the theory focuses too much on domestic factors. Harvard economist and former presidential advisor Lawrence Summers, however, highlights a body of evidence supporting it. Summers, who also acknowledges the role of global savings, points to declining demand for goods and services caused by a declining population growth rate. This decline in output demand leads to declining business investment in a time of bountiful domestic and international asset supply, which ultimately results in declining interest rates.
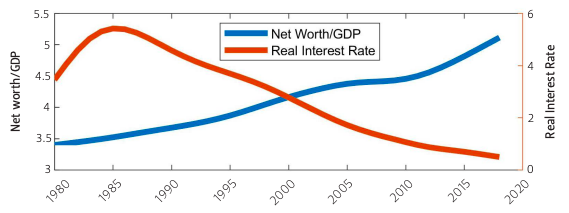
Figure 2 shows why the secular stagnation hypothesis is a popular candidate for explaining declining interest rates. The graph compares the long-term trend in interest rates with the net worth of households and nonprofits scaled to GDP—a measure of domestic wealth.10 Economic theory predicts an inverse relationship between the supply of domestic savings and interest rates, so the trend supports this prediction.
Figure 2 — Household and Nonprofit Net Worth (Trend) vs. Real Interest Rates (Trend)
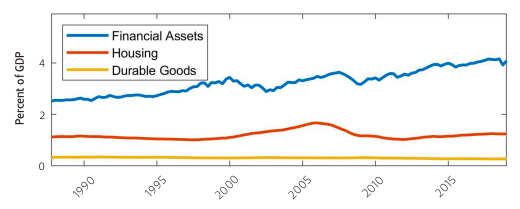
Since declining interest rates might encourage households to accumulate assets like housing, cars, and other durable goods, a closer look at the composition of assets can validate the direction of causality between domestic wealth and interest rates. Figure 3 shows this decomposition of net worth since the Federal Reserve first released the itemized data in 1987. The lines show household and nonprofit net worth by the categories of financial assets, housing, and durable goods. Over that time period, housing only rose from 1.12% to 1.24% of GDP, while the share of durable goods actually declined. On the other hand, financial assets surged from 2.5% of GDP to almost 4.1%, suggesting that the rise in domestic savings almost certainly contributed to depressed interest rates over that time period.
Figure 3 — Net Worth Composition as a Percent of GDP
Since the rise in household and nonprofit financial assets has largely outpaced growth in government debt, the net effect has resulted in steady downward pressure on interest rates. As long as domestic savings continue growing at the current pace, the private sector could remain immune to government debt crowd-out over the next few decades. Projecting debt sustainability, therefore, requires a deeper understanding of what caused this surge in domestic savings.
The Role of Demographics
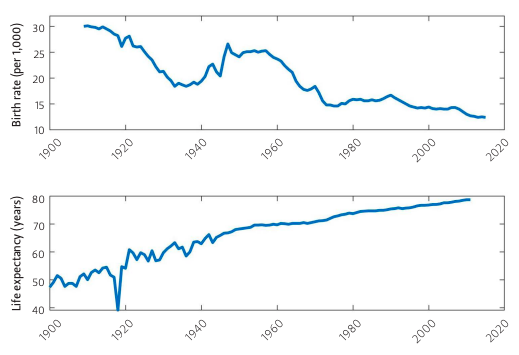
The 20th century brought about two significant demographic shifts in the U.S. The century started with a steady decline in the birth rate, but the mid-century sparked a sudden surge in births, bringing about a generation commonly known as baby boomers, before continuing on a downward trend. The second demographic shift was a sharp rise in life expectancy resulting from medical advancements and improvements in health care provision. These two demographic transitions shown in Figure 4 led to a steady rise in the relative age of the population.
Figure 4 — Crude Birth Rate by Year (Top) and Life Expectancy at Birth by Year
By the 1980s, the baby boomers had solidified their presence in the labor force and began saving for retirement. Despite a population surge initiated by their parents, baby boomers reversed the trend, leading to a decline in the growth rate of the population. A decline in the U.S. birth rate led to a subsequent decline in the entry rate of new employees, triggering a steady decline in the growth rate of the economy. Meanwhile, baby boomers progressed throughout their careers, growing their stocks of assets, leading to this secular rise in net worth relative to GDP. Finally, as savings increased relative to the economy, the relative supply of assets increased with it, contributing to declining interest rates.
To the extent that steadily declining interest rates are the result of a demographics-driven rise in asset supply, population projections can help predict how much government debt growth financial markets can feasibly absorb. Figure 5 helps paint a picture of how demographic changes are expected to unfold in the U.S. over the next several decades. The value shown in that figure is the old age dependency ratio (OADR), or the share of the population over 65 years old relative to the share of the population 18-64 years old. This ratio provides an indication of how total savings relative to the economy will materialize over that horizon. In the ten years spanning 2010-2020, the OADR surged from 21% to 28%. The OADR is expected to continue rising to 35% by 2030 and up to 41% by 2060. This projection suggests that the trending rise in domestic savings relative to the economy is not expected to reverse course any time soon.
Figure 5 — Old Age Dependency Ratio in the U.S. by Year
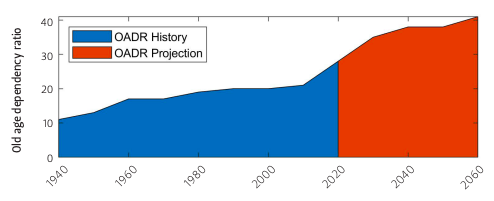
As the population continues aging, the demographics-driven change in asset supply is likely to continue rising, implying that interest rates will continue declining. Recall Bernanke’s criticism that this view of asset markets focused too much on domestic factors and failed to properly account for international asset supply. As it turns out, relative aging in OECD countries is expected to considerably outpace aging in the U.S. Between 2020 and 2060, the OADR among OECD countries is expected to climb from 31% to 58% of the population.11 This means that the demographics-driven decline in the interest rate shares a common trend in international asset markets. If demographic changes continue depressing global interest rates, then analysis of government debt sustainability can be restricted to risk factors beyond population projections.
External Risks to Sustainability
Whether the secular stagnation hypothesis or the global savings glut seems more convincing, proper evaluation of international asset markets requires consideration of each. The secular stagnation hypothesis suggests that long-term demographic trends will continue driving interest rates down for several years, while a change in foreign national savings referenced by the global savings glut could potentially cause an immediate impact on global interest rates. Consequently, if global interest rates depend more on net national savings, then federal debt sustainability could rely on the decisions of foreign governments like China, which holds 7% of all outstanding U.S. government debt.12
When Bernanke initially coined the term global savings glut in 2005, Asian countries were ramping up their levels of national savings. He pointed to the countries’ current accounts, which measure the difference between a country’s imports and exports. If this value is negative it means a country imports more than it exports, and it must borrow to finance the difference. Conversely, if the value is positive, it means that the country—from the viewpoint of international finance—is a net saver. Figure 6 shows this rapid escalation of national savings by Asian countries from 2000- 2008, which was inversely related to the U.S. current account over the same period.13
Figure 6 — Balance of Payments By Year
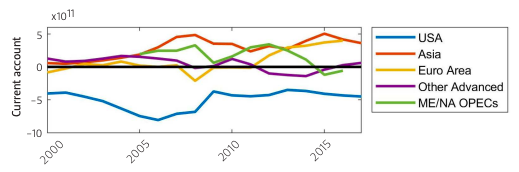
From the point in time at which he made this claim, Bernanke seemed justified in saying that savings by Asian countries, as well as Middle Eastern and North African oil-producing countries, could have resulted in a steady interest rate decline. The time since 2008, however, shows a relative stabilization in Asian net savings and a decline by other advanced economies. Over the same period, net national savings by Middle Eastern and North African oil-producing countries declined, but those declines were almost entirely offset by an increase in Euro area national savings. Meanwhile, the U.S. current account deficit declined, reverting to levels close to those at the turn of the millennium. While it may be premature to conclude that international current accounts have been smaller in magnitude since 2008, it certainly does not seem like they have grown. Given that interest rates have continued declining despite lack of growth in global national savings, the evidence seems to correlate more favorably with the factors attributed by the secular stagnation hypothesis. Moreover, the magnitudes of these current accounts seem quite small (all less than $1 trillion) relative to figures like U.S. net worth ($104 trillion in Q4 2018). To that extent, interest rates seem to depend more on stable, long-term global demographic changes, making U.S. government debt sustainability less sensitive to national savings behavior. Moreover, asset supply seems large enough to absorb a sudden sale of U.S. debt by any foreign country.
Internal Risks to Sustainability
Regardless of whether federal government debt accumulation leads to heightened interest rates, federal debt is still debt. It is incurred and owed back with interest. Over time, these interest payments become an increasingly larger share of federal government outlays, and greater fiscal austerity is required to stabilize the federal budget. If debt grows to a level where this requisite fiscal austerity package includes eliminating large portions of the federal government and levying aggressive taxes, then further debt growth could be characterized as unsustainable. Figure 7 shows how this problem is expected to escalate over the next few decades.
Figure 7 — Interest Outlays as a Share of GDP
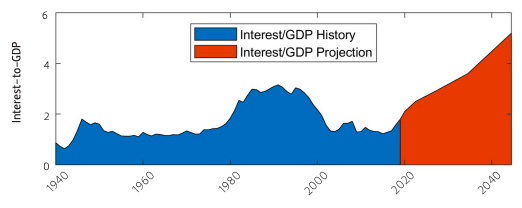
At the end of its projected forecast window, the CBO anticipates that average annual interest payments from 2040-2049 will be 5.2% of GDP—with a very steep trajectory. To put this in perspective, in 2017, individual income taxes generated revenue equal to 8.3% of GDP—and this was before the 2017 tax cuts.14 This means that an amount equal to nearly half of all personal income tax revenue would have to be allocated just to afford the growth in interest payments, and this does not include the fiscal austerity that would be required to stabilize debt growth.
Economic theory predicts at least two possible internal risks associated with accelerating government debt growth. The first, known to economists as Ricardian equivalence, predicts that heightened government debt growth creates anticipation of the looming fiscal austerity required to eventually balance the budget. If the government eventually balances the budget by increasing taxes, then people may begin increasing savings to smooth consumption over time. This behavior operates as a kind of shock absorber that dampens the impact of tax increases, but it also creates undesirable economic distortions. While the historical evidence on Ricardian equivalence seems inconclusive, policymakers should factor the possibility of triggering precautionary behavior by households and firms as government debt reaches unsustainable levels.
The second risk, which lives at the extreme, is the likelihood of sovereign default. As debt accumulation increases, the value of default increases with it, and after enough debt accumulation, default becomes the rational choice. Instances of sovereign default in modern times are rare, and in most cases, they are carried out implicitly rather than explicitly. Since the government issuing debt usually prints the currency in which the debt is denominated, it can implicitly default by printing more money to devalue its debt stock. Like Ricardian equivalence, sparse historical evidence makes default risk difficult to anticipate, but unprecedented projected debt levels could instigate a dramatic outcome.
Conclusion
The past two decades have witnessed extraordinary growth in U.S. government debt, with unprecedented escalation forecast in the coming decades. Only 16 years from now, government debt is expected to exceed its historical peak and continue on a steep trajectory thereafter. While U.S. policymakers still have plenty of time to avoid burdensome debt accumulation levels, the cost of reaching a fiscal balance grows with every moment of delay.
Over the next several decades, domestic and international savings are likely to grow by enough to absorb the entire projected federal debt growth, limiting any crowding out of domestic private investment. Any potential change in foreign national savings seems small relative to private savings, suggesting that external risk factors pose a minimal threat to domestic capital market stability. The biggest long-term threat to debt sustainability is its own repayment. Without fiscal stabilization, just the growth in interest payments alone over the next few decades would increase government outlays by an amount equal to roughly half of all personal income tax revenue.
The fact that government debt growth has not yet delivered noticeable harm to the U.S. economy does not imply that debt can continue growing inconsequentially. Eventually, all existing debt must be repaid with interest. As these debt outlays rise, fiscal austerity becomes more urgent, and market behavior will eventually begin reflecting that anticipation. Consequently, the benefits of debt stabilization are better incurred sooner rather than later.
Endnotes
1. “Financial Report of the United States Government FY18,” U.S. Department of the Treasury, https://fiscal.treasury.gov/reports-statements/financial-report/current-report.html.
2. Committee for a Responsible Federal Budget, “Q&A: Gross Debt Versus Debt Held by the Public,” September 11, 2017, https://www.crfb.org/papers/qa-gross-debt-versus-debt-held-public.
3. Data available at https://www.cbo.gov/system/files/2019-01/51134-2019-01-historicalbudgetdata.xlsx.
4. The terms “capital market,” “asset market,” and “financial market” are equivalent and used interchangeably in the context of this discussion.
5. Moritz Kuhn and José-Victor RiosRull, “2013 Update on the U.S. earnings, income, and wealth distributional facts: A View from Macroeconomics,” Federal Reserve Bank of Minneapolis Quarterly Review 37, no. 1 (2016): 2–73.
6. U.S. Department of the Treasury, Fiscal Service, “Federal Debt Held by Foreign and International Investors [FDHBFIN],” retrieved from FRED, Federal Reserve Bank of St. Louis, https://fred.stlouisfed.org/series/FDHBFIN, May 10, 2019.
7. Interest rates, in this sense, refer to real interest rates, which are net of inflation. The Federal Reserve only controls nominal interest rates, which are not net of inflation.
8. Lawrence Summers, “U.S. Economic Prospects: Secular Stagnation, Hysteresis, and the Zero Lower Bound,” Business Economics 49, no. 2 (2014).
9. Ben S. Bernanke, “Global Imbalances: Recent Developments and Prospects,” (Bundesbank Lecture, Berlin, Germany, September 11, 2008), https://www.federalreserve.gov/newsevents/speech/bernanke20070911a.htm.
10. The real interest rate is calculated by subtracting the annual CPI growth rate from the 10-year Treasury notes. Both series in the graph were smoothed by a Hodrick-Prescott filter (λ=100), which removes business cycle fluctuations to highlight long-term trends.
11. This value was solved by taking the projections in the OECD Pensions at a Glance 2017 and linearly interpolating between the values provided. This creates a similar basis of comparison with U.S. projections. One exception is the definition of the OADR. The OECD values assume working age to be 20-64, whereas U.S. projections assume that working age is 18–64.
12. Data accessed at https://ticdata.treasury.gov/Publish/mfh.txt.
13. Country groups are defined as: Asia (China, Hong Kong, Korea, Singapore, and Thailand); Euro Area (World Bank definition); Other Advanced (Australia, Canada, Japan, Switzerland, and United Kingdom); Middle East and North African OPEC members (Algeria, Angola, Congo, Iraq, Kuwait, Libya, Nigeria, and Saudi Arabia).
14. Tax Policy Center, Urban Institute and Brookings Institution, “Source of Revenue as Share of GDP, 1934 to 2024,” https://www.taxpolicycenter.org/statistics/source-revenue-share-gdp.
This material may be quoted or reproduced without prior permission, provided appropriate credit is given to the author and Rice University’s Baker Institute for Public Policy. The views expressed herein are those of the individual author(s), and do not necessarily represent the views of Rice University’s Baker Institute for Public Policy.


