
Author(s)

Over the past 40 years, the ideological differences between the members of the Democratic and Republican delegations in the Texas House of Representatives have increased dramatically. Using data drawn from roll call votes cast by representatives (for more information see “How liberal or conservative is your Texas state representative?”), here I document the widening over the past four decades of the ideological gulf that now separates Democrats and Republicans.
In 1973, the mean location of the members of the Republican delegation on the liberal-conservative ideological dimension (ranging from -1.00 [liberal extreme] and 1.00 [conservative extreme]), along which most votes in the House are cast, was 0.44; while the mean location for the Democratic delegation was 0.01. Over the following three decades, the Republican delegation became increasingly conservative, with mean values of 0.45 in 1983, 0.58 in 1993, 0.63 in 2003 and 0.67 in 2009; while the Democratic delegation became increasingly liberal, with mean values of -0.08 in 1983, -0.23 in 1993, -0.28 in 2003 and -0.34 in 2009.
The figure below highlights the growing ideological distance between the two parties (see the left Y axis), which more than doubled in size between 1973 (when the difference between the mean ideological position of the Democratic and Republican House members was 0.45) and 2009 (when the difference was 1.01). This latter value underscores the reality that, today, the average Democrat and the average Republican in the Texas House occupy worlds that are very distinct in terms of ideology and public policy preferences — a sharp contrast to the 1970s and 1980s, when there existed considerably more ideological commonalities between Democratic (primarily conservative Democrats) and Republican legislators.
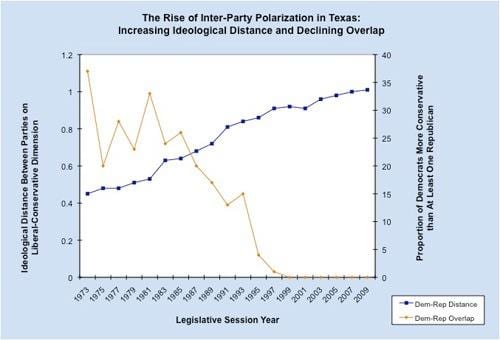
The principal sources of this growing gap between the two parties include the transition of the status of conservative Democrats in Texas from abundant to endangered, along with the increasing conservatism of many Republicans. In 1973, conservative Democrats were plentiful, with, for instance, a full 37 percent of Democratic House members (see the right Y axis in the figure) more conservative than the most liberal Republican (who was never very “liberal”). By 1995, this number had dropped to 4 percent, and since 1999, there has been no Democrat whose location on the liberal-conservative ideological dimension has been more conservative than that of the most liberal Republican.
Paralleling the decline of the conservative Democrat is the rise of the very conservative Republican. In the 1970s and 1980s, a mere 0 percent and 3 percent of Texas Republican legislators were located respectively at a “very conservative” location (greater than 0.75) on the liberal-conservative dimension. The percentage of Republicans who were very conservative rose dramatically in the 1990s (18 percent) and 2000s (23 percent), with one in four Republicans in the 2009 House having a Liberal-Conservative Score greater than 0.75.
The impact of this increased level of polarization on the legislative process in the House has varied over time, resulting in a tendency toward hegemonic Republican rule during the speakership of Tom Craddick (2003-2009), when Republicans pushed through legislation over the objections of a majority of Democrats; and to the obverse during the latter portion of the speakership of Pete Laney (1993-2003) and during the current speakership of Joe Straus (2009-2011), when the more conservative Republicans tended to find themselves on the losing side of a greater proportion of votes than their Democratic and more-liberal Republican colleagues. This topic will be discussed in greater detail in a future post.
A QuickTime movie (courtesy of Dr. Keith Poole of the University of Georgia) that graphically displays the growing polarization between Democrats and Republicans in the Texas House can be downloaded from the link below. The movie is two-dimensional, although the second dimension is not politically salient in Texas (but is necessary in order to optimally view the evolution of representatives along the liberal-conservative dimension). In addition, Poole employs the traditional colors for the Democrats [D] (left = red) and Republicans [R] (right = blue), the opposite of the standard adopted by the U.S. media over the past decade.
View or download the QuickTime movie (.mov)
Mark P. Jones is a Baker Institute Rice Scholar, the Joseph D. Jamail Chair in Latin American Studies, and chair of the Department of Political Science at Rice University.
This material may be quoted or reproduced without prior permission, provided appropriate credit is given to the author and Rice University’s Baker Institute for Public Policy. The views expressed herein are those of the individual author(s), and do not necessarily represent the views of Rice University’s Baker Institute for Public Policy.


