
Author(s)

The federal government continues to run large and sustained deficits, even as the economy expands and unemployment remains historically low.
Introduction
On Feb. 11, 2026, the Congressional Budget Office (CBO) released its latest Budget and Economic Outlook for 2026–36, offering a sobering assessment of United States’ fiscal trajectory. The report indicates that the federal government continues to run large and sustained deficits, even as the economy expands and unemployment remains historically low. The CBO issues this report to provide its baseline projections for the next decade.
Often referred to as the 10-year budget window, this timeframe is used to evaluate the fiscal impact of federal policies over the coming decade. The budget projections in the report are based on CBO’s economic forecasts, including output, employment, and interest rates, and the laws in place as of Jan. 14, 2026, commonly referred to as current law. CBO’s baseline projections help policymakers understand the potential budgetary impacts of changes to current law through new legislation.
The 2026 Budget and Economic Outlook
For the current fiscal year, the deficit is projected to reach $1.9 trillion, or roughly 5.8% of gross domestic product (GDP), and to rise over the next decade to $3.1 trillion in 2036. These annual shortfalls are expected to add $24.4 trillion to the current stock of debt, bringing it to $63 trillion by 2036.
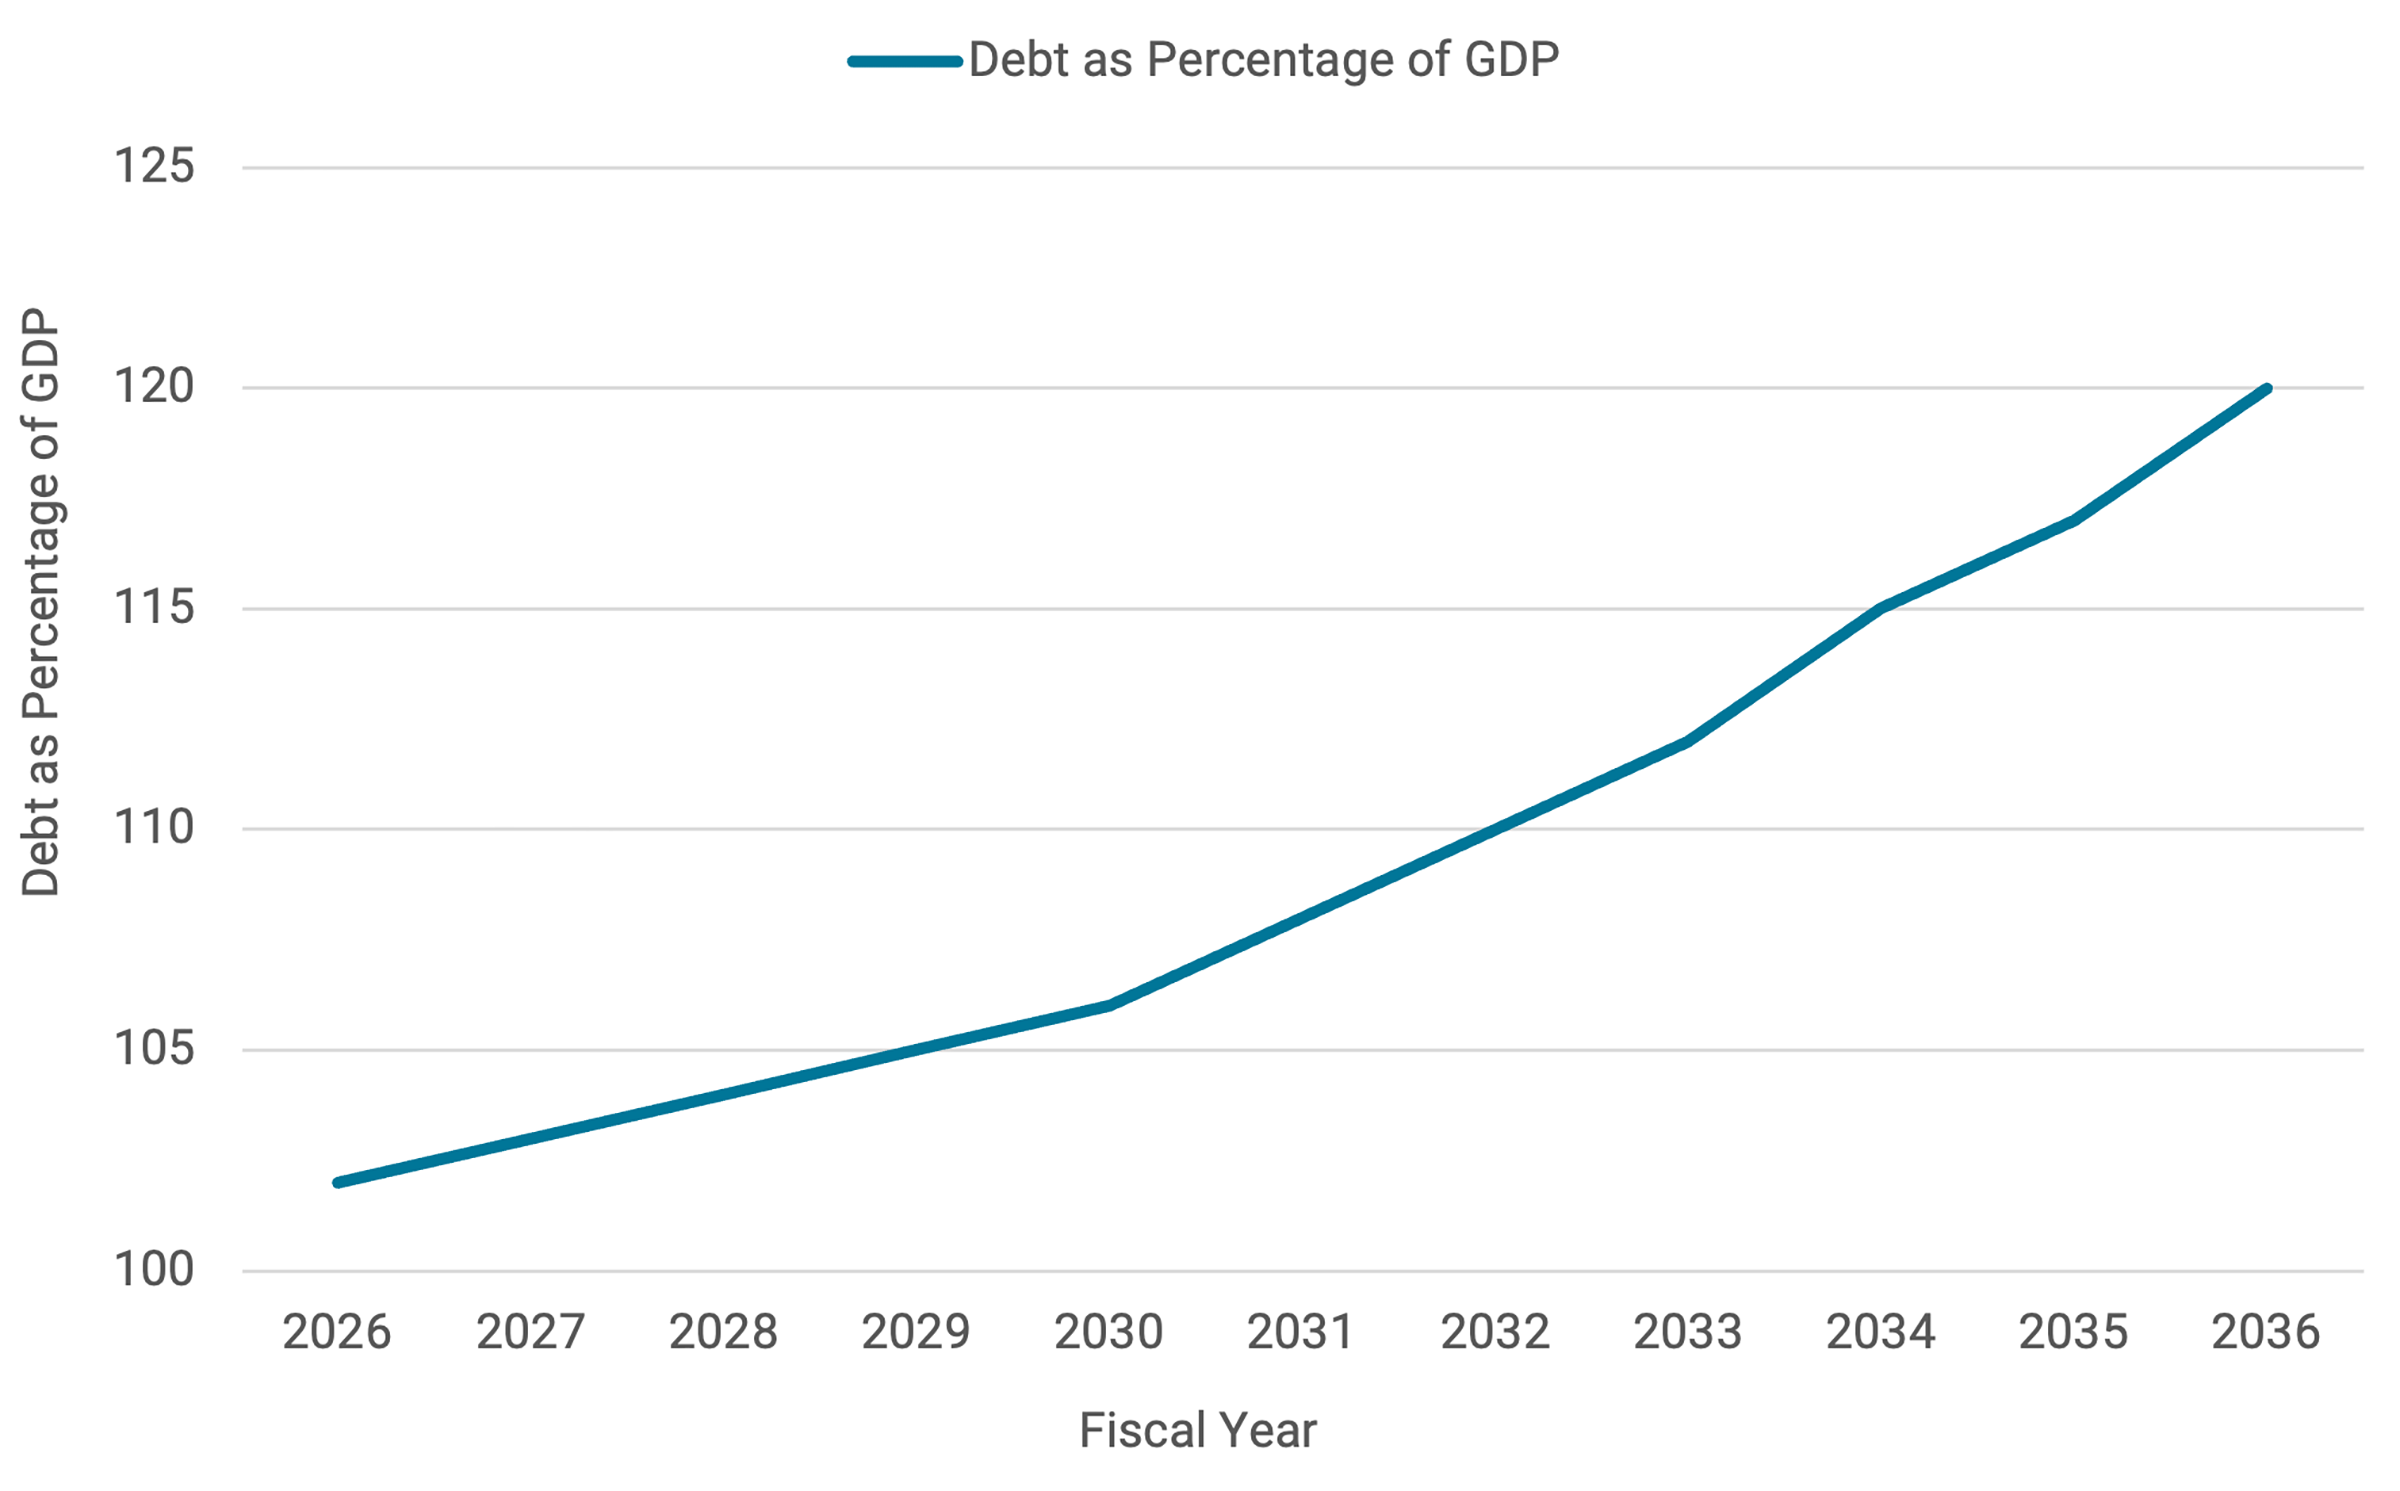
As shown in Figure 1, this path leads to a historic milestone — debt held by the public is projected to surpass its post-World War II record, rising from 101% of GDP in 2026 to 108% by 2030 and 120% by 2036.
Figure 1 — Debt as Percentage of GDP
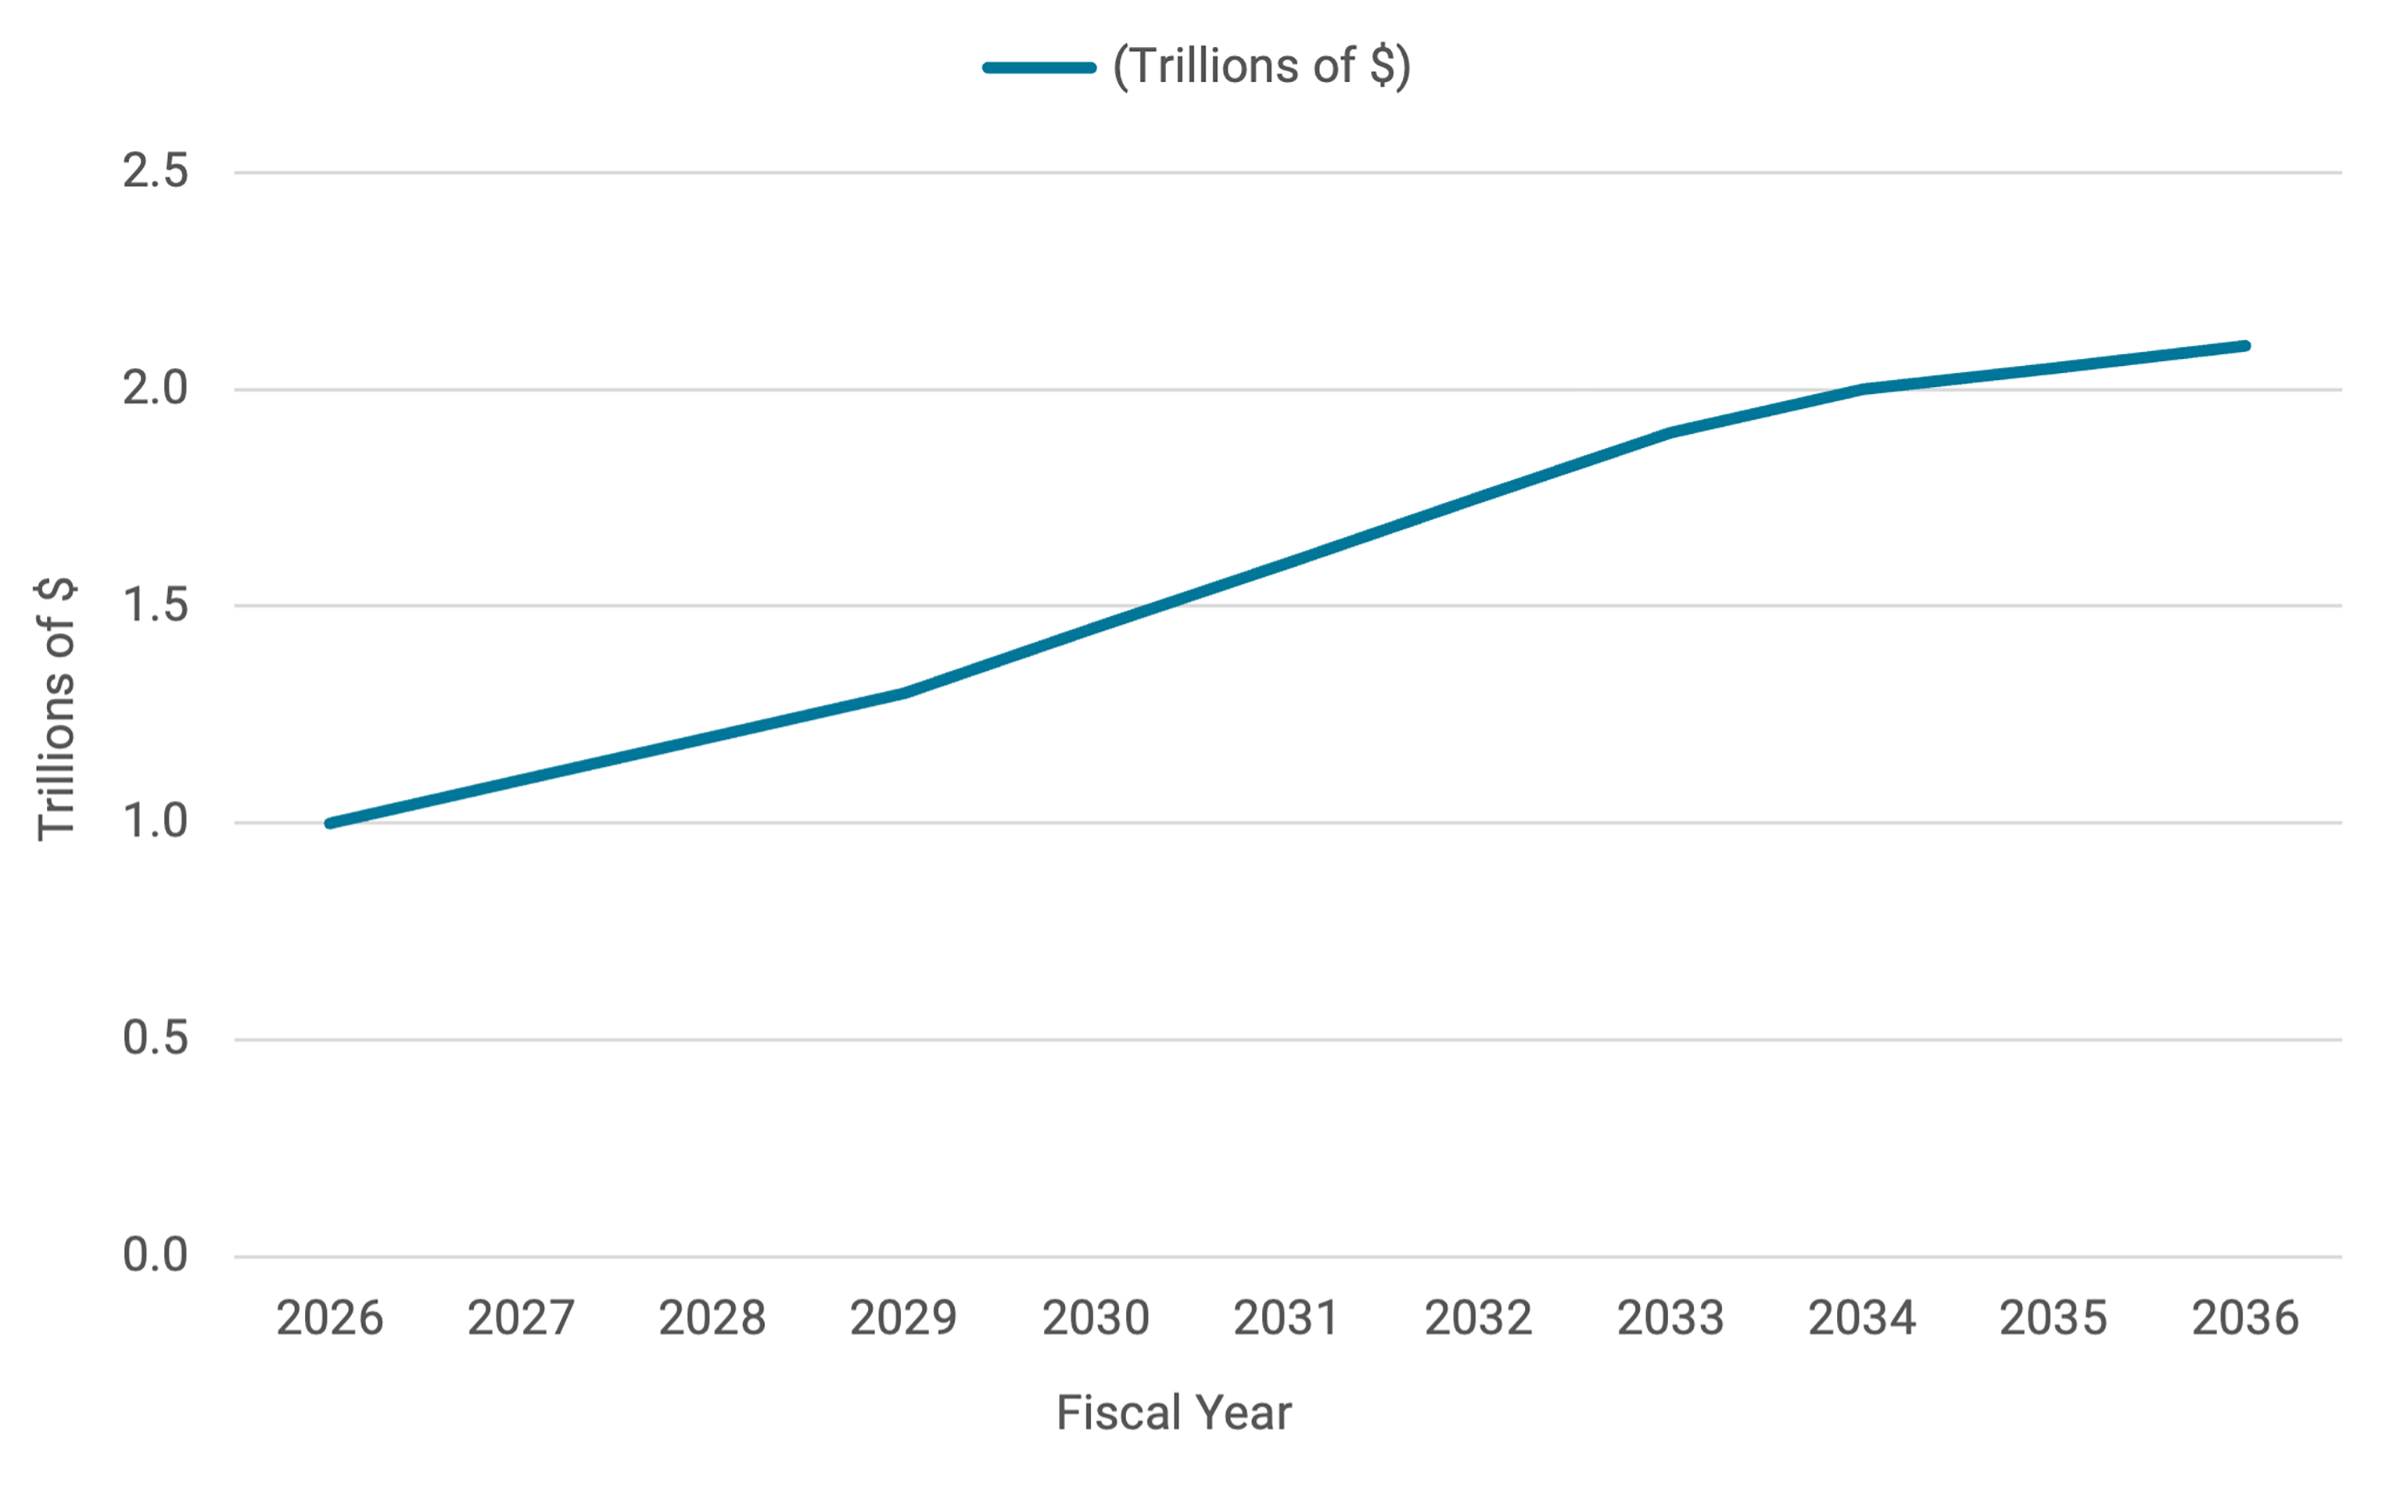
The rapid growth of interest payments on the national debt is problematic. Net interest outlays are the fastest-growing component of federal spending. As shown in Figure 2, they are expected to double from $1.0 trillion in 2026 to $2.1 trillion by 2036, or 4.6% of GDP.
Persistent deficits create budgetary pressures as high interest costs crowd out other federal priorities, such as infrastructure and national defense. If these costs are financed through higher taxes, they reduce private consumption and investment. In either case, the expense of servicing debt from past expenditures poses a significant challenge and influences current spending and revenue decisions.
To clarify the shifting fiscal landscape, the Congressional Budget Office provides an overview of the historical averages and future projections:
- Historical baselines (1976–2025): Federal revenues have averaged 17.3% of GDP, while outlays have averaged 21.2% of GDP.
- Total federal outlays: Projected to increase from 23.1% of GDP ($7.0 trillion) in 2025 to 24.4% of GDP in 2036, driven by increases in mandatory and net interest outlays.
- Mandatory outlays: Expected to increase by 1.3 percentage points, from 13.7% to 15.0% of GDP.
- Net interest outlays: Expected to increase by 1.4 percentage points, from 3.2% to 4.6% of GDP.
- Discretionary outlays: Projected to decrease by 1.4 percentage points, from 6.2% to 4.8% of GDP.
- Federal revenues: Projected to increase from 17.2% of GDP ($5.2 trillion) in 2025 to 17.8% of GDP in 2036.
- Deficits: Projected to increase from 5.8% of GDP in 2025 to 6.7% of GDP in 2036.
Figure 2 — Projected Net Interest Outlays (2026–36)
Several major policy shifts have significantly altered the budget and economic outlook since last year’s report was released in March 2025. In fact, the 2026 outlook is fundamentally different than most years. In the past, most outlooks were dominated by the familiar slow-moving forces: an aging population, rising health spending, and compounding interest expenses. These issues are still present in the current outlook. But the 2026 outlook is much more explicitly a baseline shaped by recent policy changes, uncertainty related to those policy changes, and potentially transformative technological changes.
The Impact of Taxes, Tariffs, and Spending
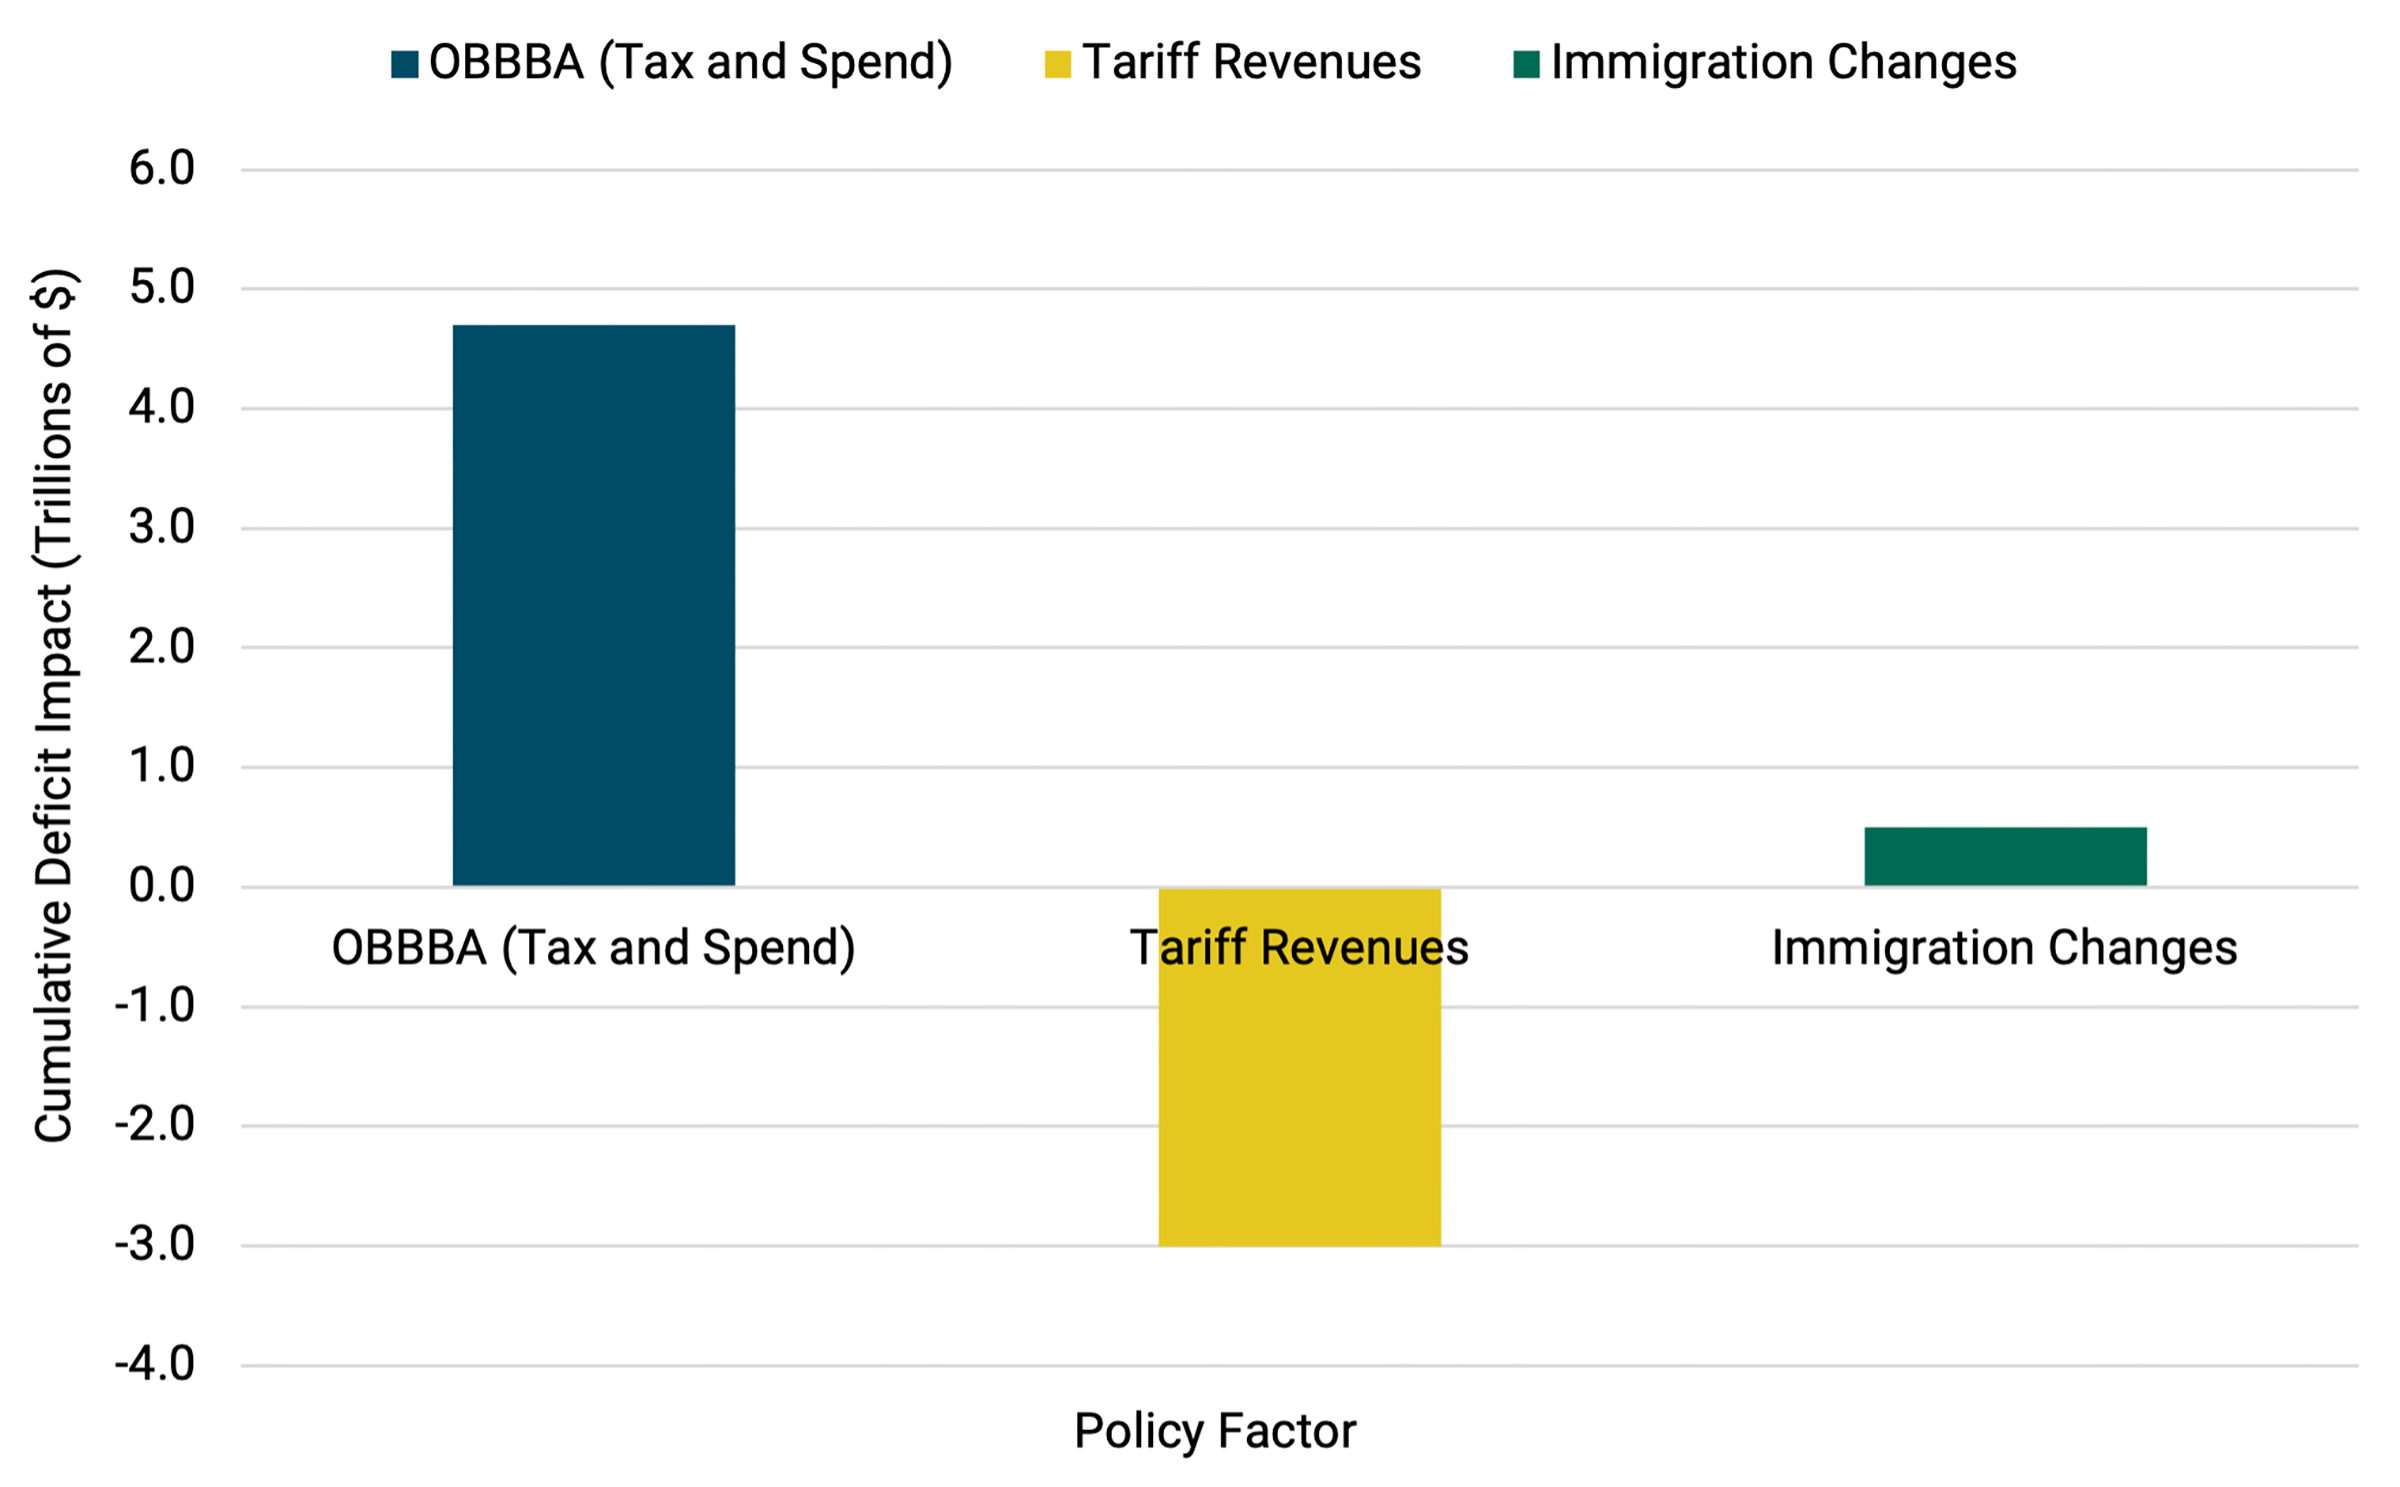
The policy changes impacted taxes, spending, tariffs, and immigration. One of the largest policy changes was the passage of the 2025 Reconciliation Act — also known as the One Big Beautiful Bill Act (OBBBA) — that will add $4.7 trillion to the cumulative deficit over the next 10 years through tax extensions, new tax provisions, and increased spending. To offset part of the increase in the deficit, the Trump administration adopted new tariff policies that were expected to generate roughly $3.0 trillion in additional revenue over the decade. Considerable uncertainty is associated with these policy changes.
For example, CBO originally estimated tariff changes would reduce deficits by about $3.0 trillion over 2026–35. However, the Supreme Court’s decision that the administration’s tariffs applied under IEEPA were illegal creates significant budget (and economic) uncertainty. CBO’s March 5 update states that, accounting for the ruling, projected deficits are now about $2.0 trillion larger over 2026–36 than in the February outlook. But ultimately this will depend on how and at what level the tariffs are implemented, which will have major budget and economic impacts.
Impacts of Artificial Intelligence
Another feature of this report that stands out is the inclusion of productivity gains from generative artificial intelligence (AI). For the first time, CBO has explicitly factored in productivity gains from generative artificial intelligence, estimating a 0.1% annual productivity boost and a 1% increase in total economic output by 2036. CBO notes that this is a potentially large source of uncertainty; even moderately higher growth over a 10-year window could considerably alter the projections. Private sector estimates vary:
- McKinsey & Company estimates generative AI could add 0.1–0.6% to labor productivity annually through 2040, depending on adoption speed.
- Goldman Sachs estimates AI could boost U.S. GDP growth by about 0.4 percentage points and eventually raise global GDP by up to 15% over the long term.
The CBO’s cautious estimate reflects the significant uncertainty surrounding AI’s economic impact. However, it provides a prudent baseline, given the need to observe how AI adoption unfolds.
The productivity outlook is generally positive, with CBO forecasting 2.2% real GDP growth in 2026, boosted by an increase in fiscal stimulus. However, structural constraints are expected to temper this momentum, returning growth to a 1.8% long-term average.
Impacts of Immigration
The effect of immigration on the budget and economic outlook is also a topic of considerable interest given the recent changes in immigration policy. CBO projects that changes to immigration policies will slow labor supply growth, resulting in a $0.5 trillion increase in the deficit due to a corresponding decline in tax receipts.
Regarding the consequences for productivity, the agency identifies two offsetting productivity channels, noting that added workers affect potential productivity through employment composition and innovation. The composition effect is negative because many new workers are younger and, on average, less educated than the existing labor force — this initially puts downward pressure on labor productivity growth. However, the outlook report also highlights how immigration raises productivity through innovation. In the analysis of the immigration surge, CBO found that those two factors offset one another over the budget window. Ultimately, immigration still raised the estimate of GDP by increasing the number of workers.
In CBO’s framework, immigration primarily shapes the labor force and total output. The effect on GDP per capita tends to be positive in the long term, especially when immigration is concentrated in working-age adults and innovation-heavy sectors, but it is much smaller than the effect on aggregate GDP. In the short term, the results are mixed, with negative impacts often associated with GDP per capita, average productivity, housing price pressure, local congestion, and wages for close substitutes. This creates substantial policy uncertainty in the baseline given the sweeping changes across the most recent administrations.
Other Factors
Other factors such as credit conditions, asset prices, consumer prices, wages, interest rates, monetary policy, and fiscal policy also add considerable uncertainty to the projections. CBO projects that inflation will not return to 2% until 2030, largely due to the impact of trade policies and demographic changes in the labor market. This is another important source of uncertainty because forecasting future inflation is difficult. The CBO projection on inflation is high compared to private sector forecasts — several have inflation back around 2% at the beginning of 2027.
Federal Trust Funds’ Solvency
The report also updates the timeline for solvency of major federal trust funds. The Highway Trust Fund is now projected to be exhausted by 2028, necessitating a new funding solution for national infrastructure. More critically, the Social Security Old-Age and Survivors Insurance Trust Fund is now projected to become insolvent by 2032, which is one year earlier than previously estimated.
This acceleration is driven by lower-than-expected payroll tax revenues resulting from reduced immigration and a smaller labor force, as well as the higher interest costs the government must pay to borrow from its own trust funds. Without legislative action to address this shortfall, retirees could face an immediate 23% reduction in benefits, and the size of the reduction would increase in the years after exhaustion. Policymakers may soon be forced to enact reforms to these programs or allow for significant disruptions.
Summary and a Roadmap to Fiscal Stability
The 2026 outlook describes a fiscal environment where interest obligations are becoming a dominant force in the federal budget. The combination of an aging population, rising borrowing costs, and specific legislative choices has placed the national debt on a path that exceeds all historical precedents. Addressing these challenges will likely require a comprehensive approach to both spending and revenue to ensure long-term economic stability and the preservation of essential public services.
To achieve a long-term stable outcome, any solution should prioritize economic growth, which precludes increasing marginal tax rates to reduce the fiscal deficits. Instead, the strategy should focus on the following pillars:
- Spending restraint: With current and future deficits driven by outlays exceeding historical averages, reform should begin by reining in spending growth — particularly mandatory outlays.
- Revenue through base broadening: Rather than raising marginal tax rates on capital or labor, revenue should come from reducing the volume and scale of tax expenditures — targeted tax breaks, such as deductions and credits that function as “spending through the tax code.” Reducing these expenditures lowers fiscal stimulus, giving monetary authorities greater flexibility to reduce interest rates, which may help bring down interest outlays.
- Market signaling and debt servicing: Demonstrating fiscal discipline through reduced outlays and tax expenditures would signal stability to the bond market. The resulting downward pressure on interest rates would lower net interest outlays without fueling inflation.
Restoring fiscal stability will likely require a shift toward growth-oriented tax and spending policies. Sustained GDP expansion is widely considered a key factor in achieving long-term fiscal health.
Comparing the 2025 and 2026 Reports
As discussed above, the 2026 outlook differs from the January 2025 report in several key aspects. These differences are related to the new policies that have been enacted under the Trump administration and changing technological trends:
- The 2025 Reconciliation Act (OBBBA).
- A new comprehensive tariff regime.
- A substantial reduction in net immigration.
- AI development and implementation.
Figure 3 shows how these factors have reshaped the fiscal landscape, adding $1.4 trillion to the projected 10-year deficit that was estimated 12 months ago. These changes may affect the composition of economic growth across 2025 and 2026. Moreover, changes in the debt and deficits may affect interest rates and inflation expectations. Finally, to understand the economic and budgetary impacts of the policies enacted under OBBBA it is important to consider the details of the policies. These issues are discussed below.
Figure 3 — Major Policy Drivers of the 10-Year Deficit Projection
Changes in Path and Composition of Growth
One of the most notable differences is the path and composition of economic growth. Last year, the budget office projected a steady but modest growth path at 1.8%; whereas the new 2026 forecast shows a much higher expansion in output in the near term. CBO projects that real GDP growth for 2026 will be 2.2%, which is 0.4 percentage points higher than the 1.8% projected in January 2025. This boost is largely attributed to the stimulative effects of the OBBBA tax cuts and spending increases. However, CBO warns that this short-term gain comes at the cost of higher long-term debt-service requirements. For example, in 2035 the debt projections under the 2026 report indicate a debt-to-GDP ratio of 120%, instead of 118% as projected for 2035 in the 2025 report.
While this long-term average growth rate remains identical in the 2025 and 2026 reports at 1.8%, the composition of that growth has shifted. In the 2025 report, the CBO attributed nearly four-fifths of that 1.8% growth to increases in labor productivity, with the remaining one-fifth coming from a growing labor force — bolstered largely by immigration. In the latest report, the labor force is projected to be smaller due to lower immigration levels. However, the CBO has maintained the 1.8% long-term average by accounting for a 10-basis point (0.1%) annual productivity boost from generative AI. In effect, the 2026 report assumes that technology will now achieve the gains the 2025 report attributed to a larger pool of human workers, including immigrants.
Inflation and Interest Rate Expectations
Inflation and interest rate expectations have also been revised. In the 2025 outlook, CBO projected overall personal consumption expenditures (PCE) inflation to be close to 2% in 2025, but not fully at target until 2027 The 2026 report has pushed that timeline back to 2030, citing the persistent upward pressure from new tariffs on imported goods and increased aggregate demand. Consequently, interest rates on 10-year Treasury notes are now projected to remain higher for longer, averaging 4.3% by late 2027, compared with last year’s report, which anticipated lower rates as inflation eased.
Effects of the 2025 Reconciliation Act
The 2025 Reconciliation Act represents a major overhaul of the federal tax and spending landscape. Its most significant change is the permanent extension of the 2017 Tax Cuts and Jobs Act (TCJA) provisions, which had been scheduled to expire at the end of 2025. This includes maintaining the lower individual income tax brackets, the larger standard deduction, and the 20% deduction for pass-through business income. By making these provisions permanent, the new law eliminates the sharp revenue spike the CBO had projected for 2026 and 2027 in its previous outlook.
Beyond simply extending old laws, the act introduces several new, targeted tax breaks that significantly affect the 10-year deficit.
- Service workers (tips and overtime): Establishes a temporary exemption from federal income tax on tips and overtime pay for certain workers through 2028.
- Families (Child Tax Credit): Increases the Child Tax Credit from $2,000 to $2,200 per child and expands refundability rules to provide greater direct support to lower-income households.
- Seniors (age 65+ deduction): Introduces a $6,000 deduction for individuals over 65, with a phase-out for higher-income earners.
- Children (Trump accounts): Launches a one-time $1,000 federal contribution for each U.S. citizen child born between 2025 and 2028 and allows any child under 18 to open an account.
The new legislation also addresses the contentious State and Local Tax (SALT) deduction by significantly — but temporarily — raising the cap. Under the TCJA, the SALT deduction was capped at $10,000; the new law increases this cap to $40,000 for most households through 2029, providing substantial relief to taxpayers in high-tax states. However, the cap is scheduled to revert to $10,000 level in 2030.
To partially offset these tax cuts and tax expenditures, the legislation includes several revenue raisers, such as the permanent elimination of clean energy vehicle credits and other renewable energy credits that were established under the previous administration.
Shifting Spending Priorities
On the spending side, the act shifts priorities toward national security and border enforcement while reducing spending on social safety net programs. The CBO notes that while the bill adds $150 billion for military spending and $150 billion to $170 billion for border security, it achieves nearly $1.4 trillion in savings through structural reforms to Medicaid, SNAP, and federal student loan programs. Specifically, the introduction of stricter work requirements and eligibility changes in Medicaid and SNAP accounts for the bulk of these spending reductions. Despite these cuts, the sheer scale of the tax extensions and new credits means the OBBBA still adds a net $4.7 trillion to the deficit over the next decade once increased interest costs are included.
New and Temporary Policy Additions
The 2025 Reconciliation Act introduced income thresholds to manage the cost of several provisions. These thresholds determine whether a household receives the full benefit, a partial amount, or no benefit at all. The following table outlines the specific income limits and phase-out ranges for the two most significant deduction changes in the new law.
Table 1 — OBBBA Tax Provisions Details
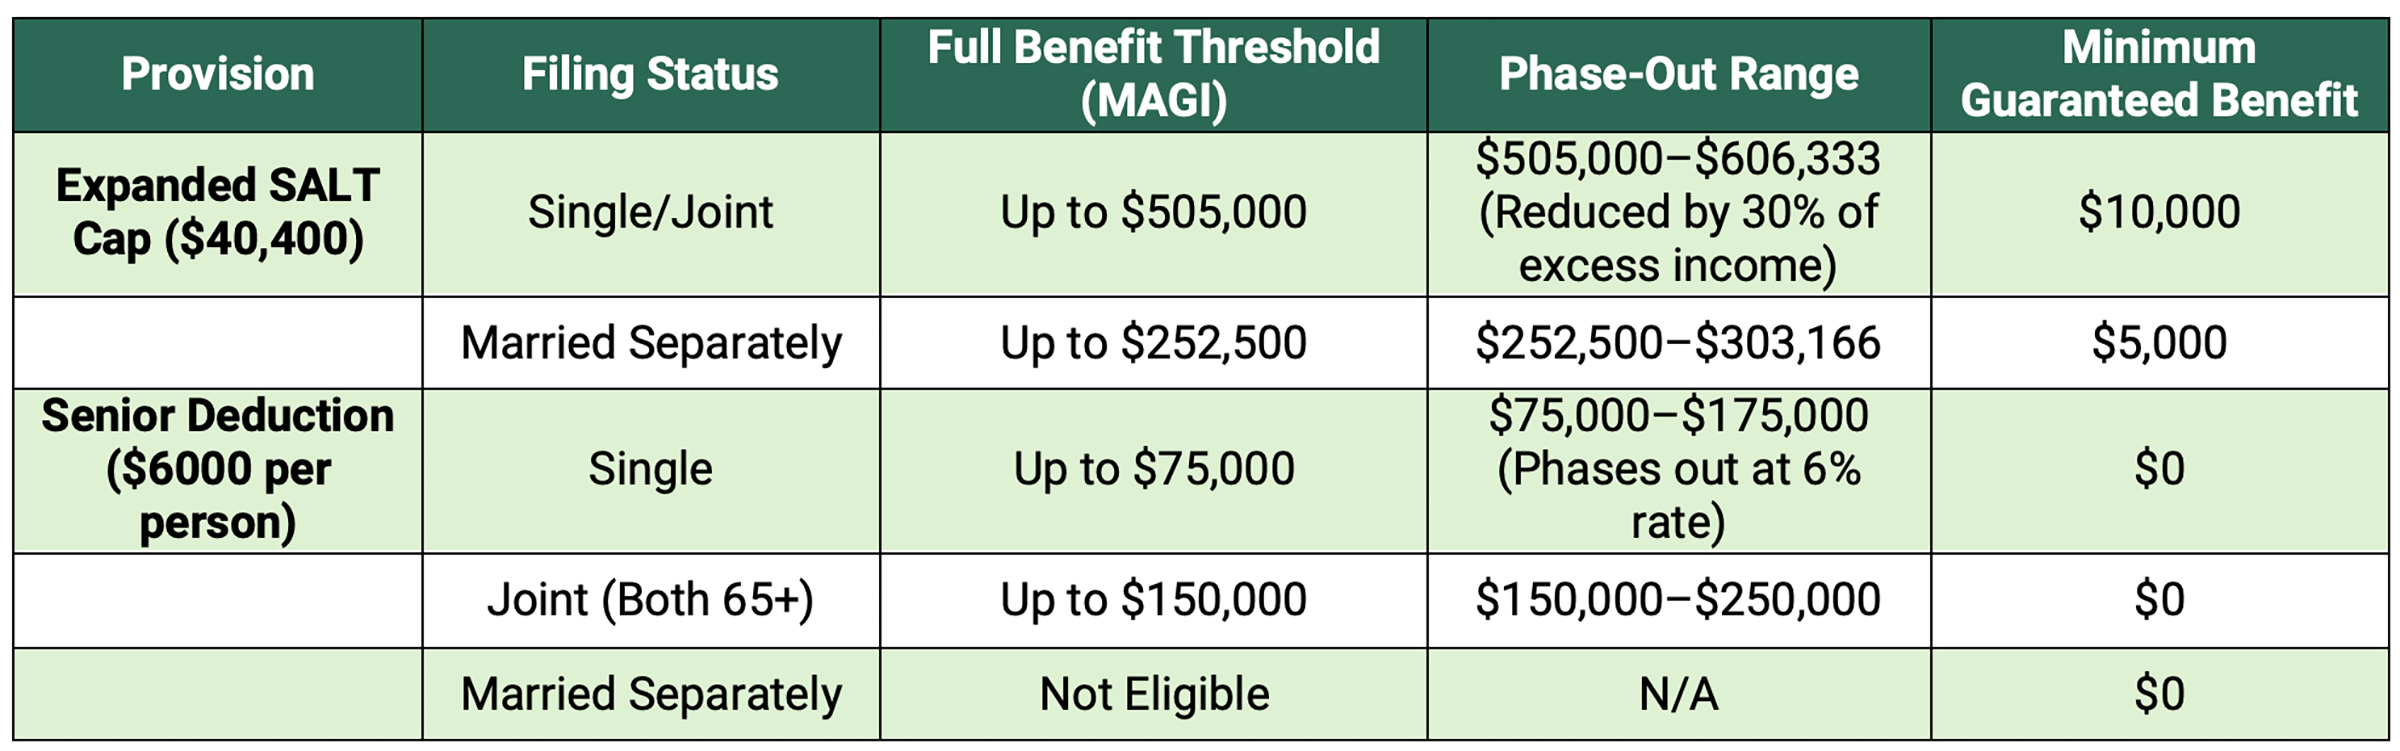
For the SALT deduction, the OBBBA effectively creates a floor, a guaranteed minimum deduction, rather than a total elimination. Even the highest earners in the 37% tax bracket — who may be completely phased out of the new $40,400 limit — are still guaranteed a $10,000 deduction, maintaining the status quo from the previous 2017 law. It is important to note that both the cap itself ($40,400) and the phase-out threshold ($505,000) are scheduled to increase by 1% annually through 2029.
The senior deduction is a bonus deduction that functions as a personal exemption and was designed to exempt Social Security payments from taxation for certain taxpayers. Unlike the SALT cap, which requires individuals to itemize, the $6,000 senior benefit is available to those who take the standard deduction. For a married couple in which both spouses are over 65, this allows for a combined deduction of up to $46,700 when paired with the standard deduction and the existing age-65+ additional deduction. However, this benefit is temporary and is currently scheduled to expire after the 2028 tax year.
The federal income tax deductions for tips and overtime introduced by OBBBA (Sections 70201 and 70202, respectively) are designed to provide relief to hourly and service-industry workers, though they function as income tax deductions rather than a total exemption from all taxes. These provisions are temporary, effective for the 2025 through 2028 tax years. The tip deduction allows workers in “customary” tipped occupations — such as waitstaff, bartenders, and salon workers — to deduct up to $25,000 of their tipped income from federal taxable income.
To qualify the tips must be voluntary cash or charged tips. Mandatory service charges or automatic gratuities generally do not qualify, unless the customer has a clear option to modify them. The deduction begins to phase out once the worker’s Modified Adjusted Gross Income (MAGI) exceeds $150,000 ($300,000 for joint filers). For every $1,000 a worker earns over that limit, their deduction is reduced by $100. Tip income is still subject to payroll taxes.
The overtime provision allows hourly employees to deduct the premium portion of their overtime pay from their taxable income — specifically, the additional pay required by the Fair Labor Standards Act (FLSA). Under a standard time-and-a-half scenario, only the “half” portion of overtime is deductible. For example, for a worker earning $20 per hour and working overtime at $30 per hour can deduct only the extra $10 per hour.
The maximum annual deduction is $12,500 for single filers and $25,000 for married couples filing jointly. The phase-out begins at $150,000 MAGI for single filers ($300,000 for joint filers) and phases out completely at $275,000 ($550,000 for joint filers). Overtime earnings remain subject to payroll taxes, and the deduction applies only to weekly overtime (over 40 hours) required by federal law — not daily overtime or special holiday pay mandated by certain states.
Conclusion
In summary, the 2026 outlook highlights a fiscal environment in which interest obligations are an increasingly dominant component of the federal budget. An aging population, rising borrowing costs, and recent legislative decisions have intensified the fiscal challenges facing the United States. Although the national debt has been on an unsustainable trajectory for over a decade, the latest policy changes are projected to further widen the fiscal gap.
While increased economic growth may offset some of the additional debt being accumulated, it is important to consider potential changes in the composition of that growth. CBO projects that, under current policies, GDP growth will be driven more by advances in technology than by increases in the supply of labor. Given demographic trends in the U.S., including an aging population and declining birth rates, this shift will be a critical factor in mitigating the debt overhang.
Addressing these challenges will require a comprehensive approach to reforming spending and revenue policies. Such reforms should aim to maximize economic growth, support long-term fiscal stability, and preserve essential public investment and services.
This publication was produced by Rice University’s Baker Institute for Public Policy. Wherever feasible, the material was reviewed by outside experts prior to release. Any errors or omissions are solely the responsibility of the author(s).
This material may be quoted or reproduced without prior permission, provided appropriate credit is given to the author(s) and Rice University’s Baker Institute for Public Policy. The views expressed herein are those of the individual author(s) and do not necessarily represent the views of Rice University’s Baker Institute for Public Policy.


