
The Property Tax Debate
The City of Houston’s property tax levels remain a topic of ongoing debate. Central to the discussion is a 2004 voter-approved city charter amendment that limits the amount of property tax revenue the city can increase each year without voter approval. Critics contend that this limit has significantly restricted property tax revenue. During last year’s budget deliberations, several City Council members urged Mayor John Whitmire’s administration to invoke the charter’s emergency clause to raise the tax rate and close the budget gap.
Advocates for repealing the limit often suggest that the city has lost substantial revenue that would have otherwise been available. These estimates typically assume the property tax rate would have remained constant without the cap — a scenario that does not account for the state’s property tax limit, which also constrains revenue growth. According to a presentation by the city’s Finance Department at a council committee meeting last year, the cap has reduced revenue by an estimated $2.2 billion since it became binding in 2015 (Table 1).
Table 1 — Adopted Budget Versus Charter Cap, FY 2015–25

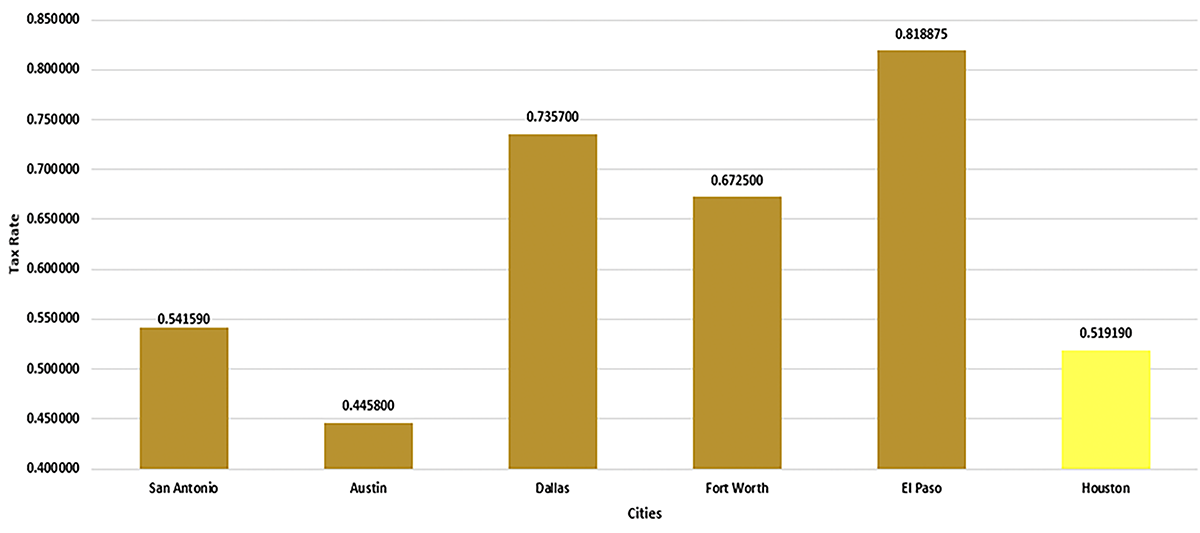
A common argument for repealing the cap is that Houstonians pay less in property taxes than residents in other major Texas cities. As shown in Figure 1, also from the city’s Finance Department presentation, Houston’s property tax rate is notably lower than that of most comparable cities across the state.
Figure 1 — Property Tax Rate Comparison, 2023 Tax Year
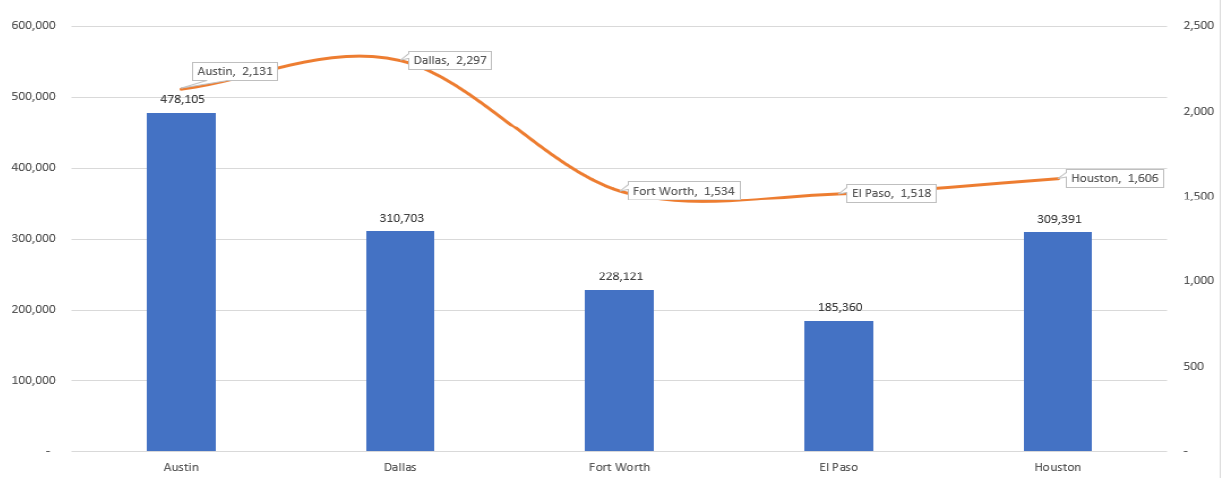
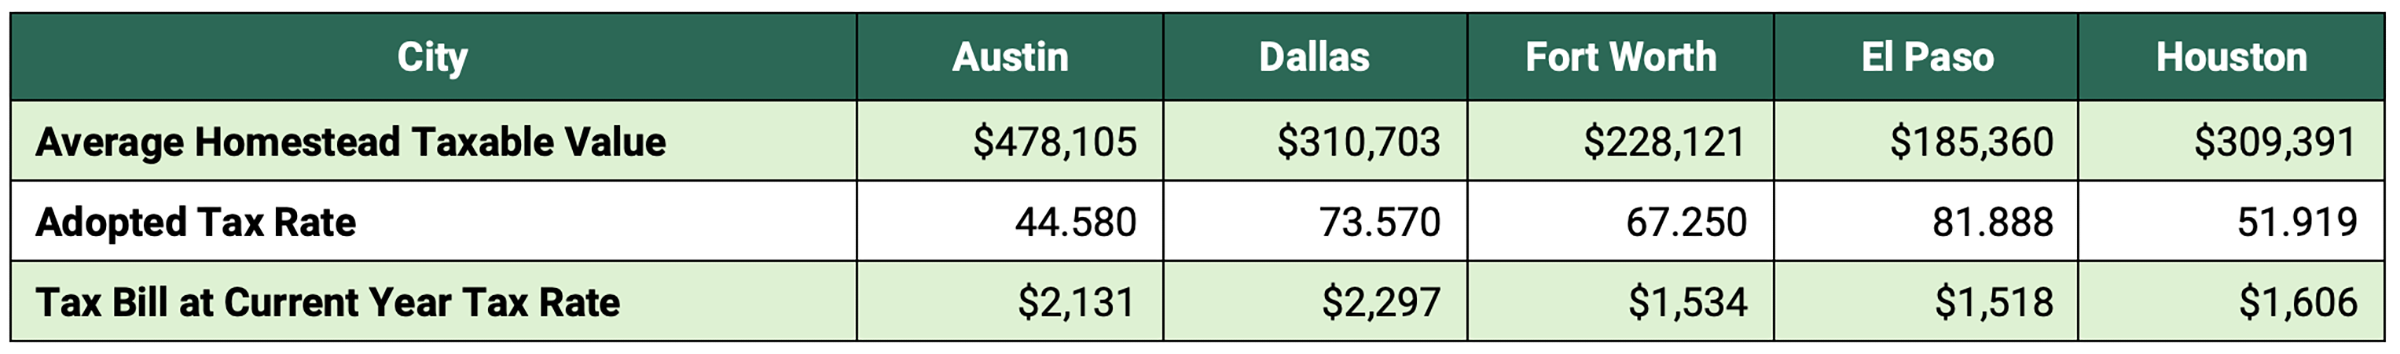
The presentation also compares the average property tax paid on a homestead across cities. As shown in Figure 2, Houston’s average homestead property tax is significantly lower than in Austin or Dallas but is generally comparable to Fort Worth and El Paso.
Figure 2 — Average Homestead Property Tax Comparison
Limitations of Common Property Tax Comparisons
However, these comparisons are incomplete and may be misleading. Several important factors — outlined in the following section — are not fully reflected in the analyses above:
- Property types.
- Income and ability to pay.
- Political constraints.
1. Focusing on Homesteads Alone
Focusing solely on homesteads fails to capture the full scope of Houston’s property tax base. According to the Harris County Appraisal District’s 2023 Jurisdictional Recap Report, single-family residences account for only about 40% of the city’s total taxable value — and not all qualify for a homestead exemption. For example, rental properties are ineligible. As a result, analyses limited to homesteads omit approximately two-thirds of the city’s property tax impact.
All property types, including rental, commercial, and industrial properties should be included in tax burden comparisons. Property taxes are a cost of doing business and are ultimately borne by someone — whether consumers, employees, shareholders, or property owners. Regardless of how the cost is distributed, the burden still rests with city taxpayers.
2. Adjusting for Ability To Pay
Per Capita Tax Burden
The relative burden of property taxes should be evaluated in relation to residents’ ability to pay. A 2024 brief found that from 2015–24, Houston’s property tax growth outpaced the combined rate of inflation and population growth by 1.3 percentage points. A common benchmark for assessing ability to pay is per capita personal income (PCPI), using data from the 2023 American Community Survey (ACS) conducted by the U.S. Census Bureau.
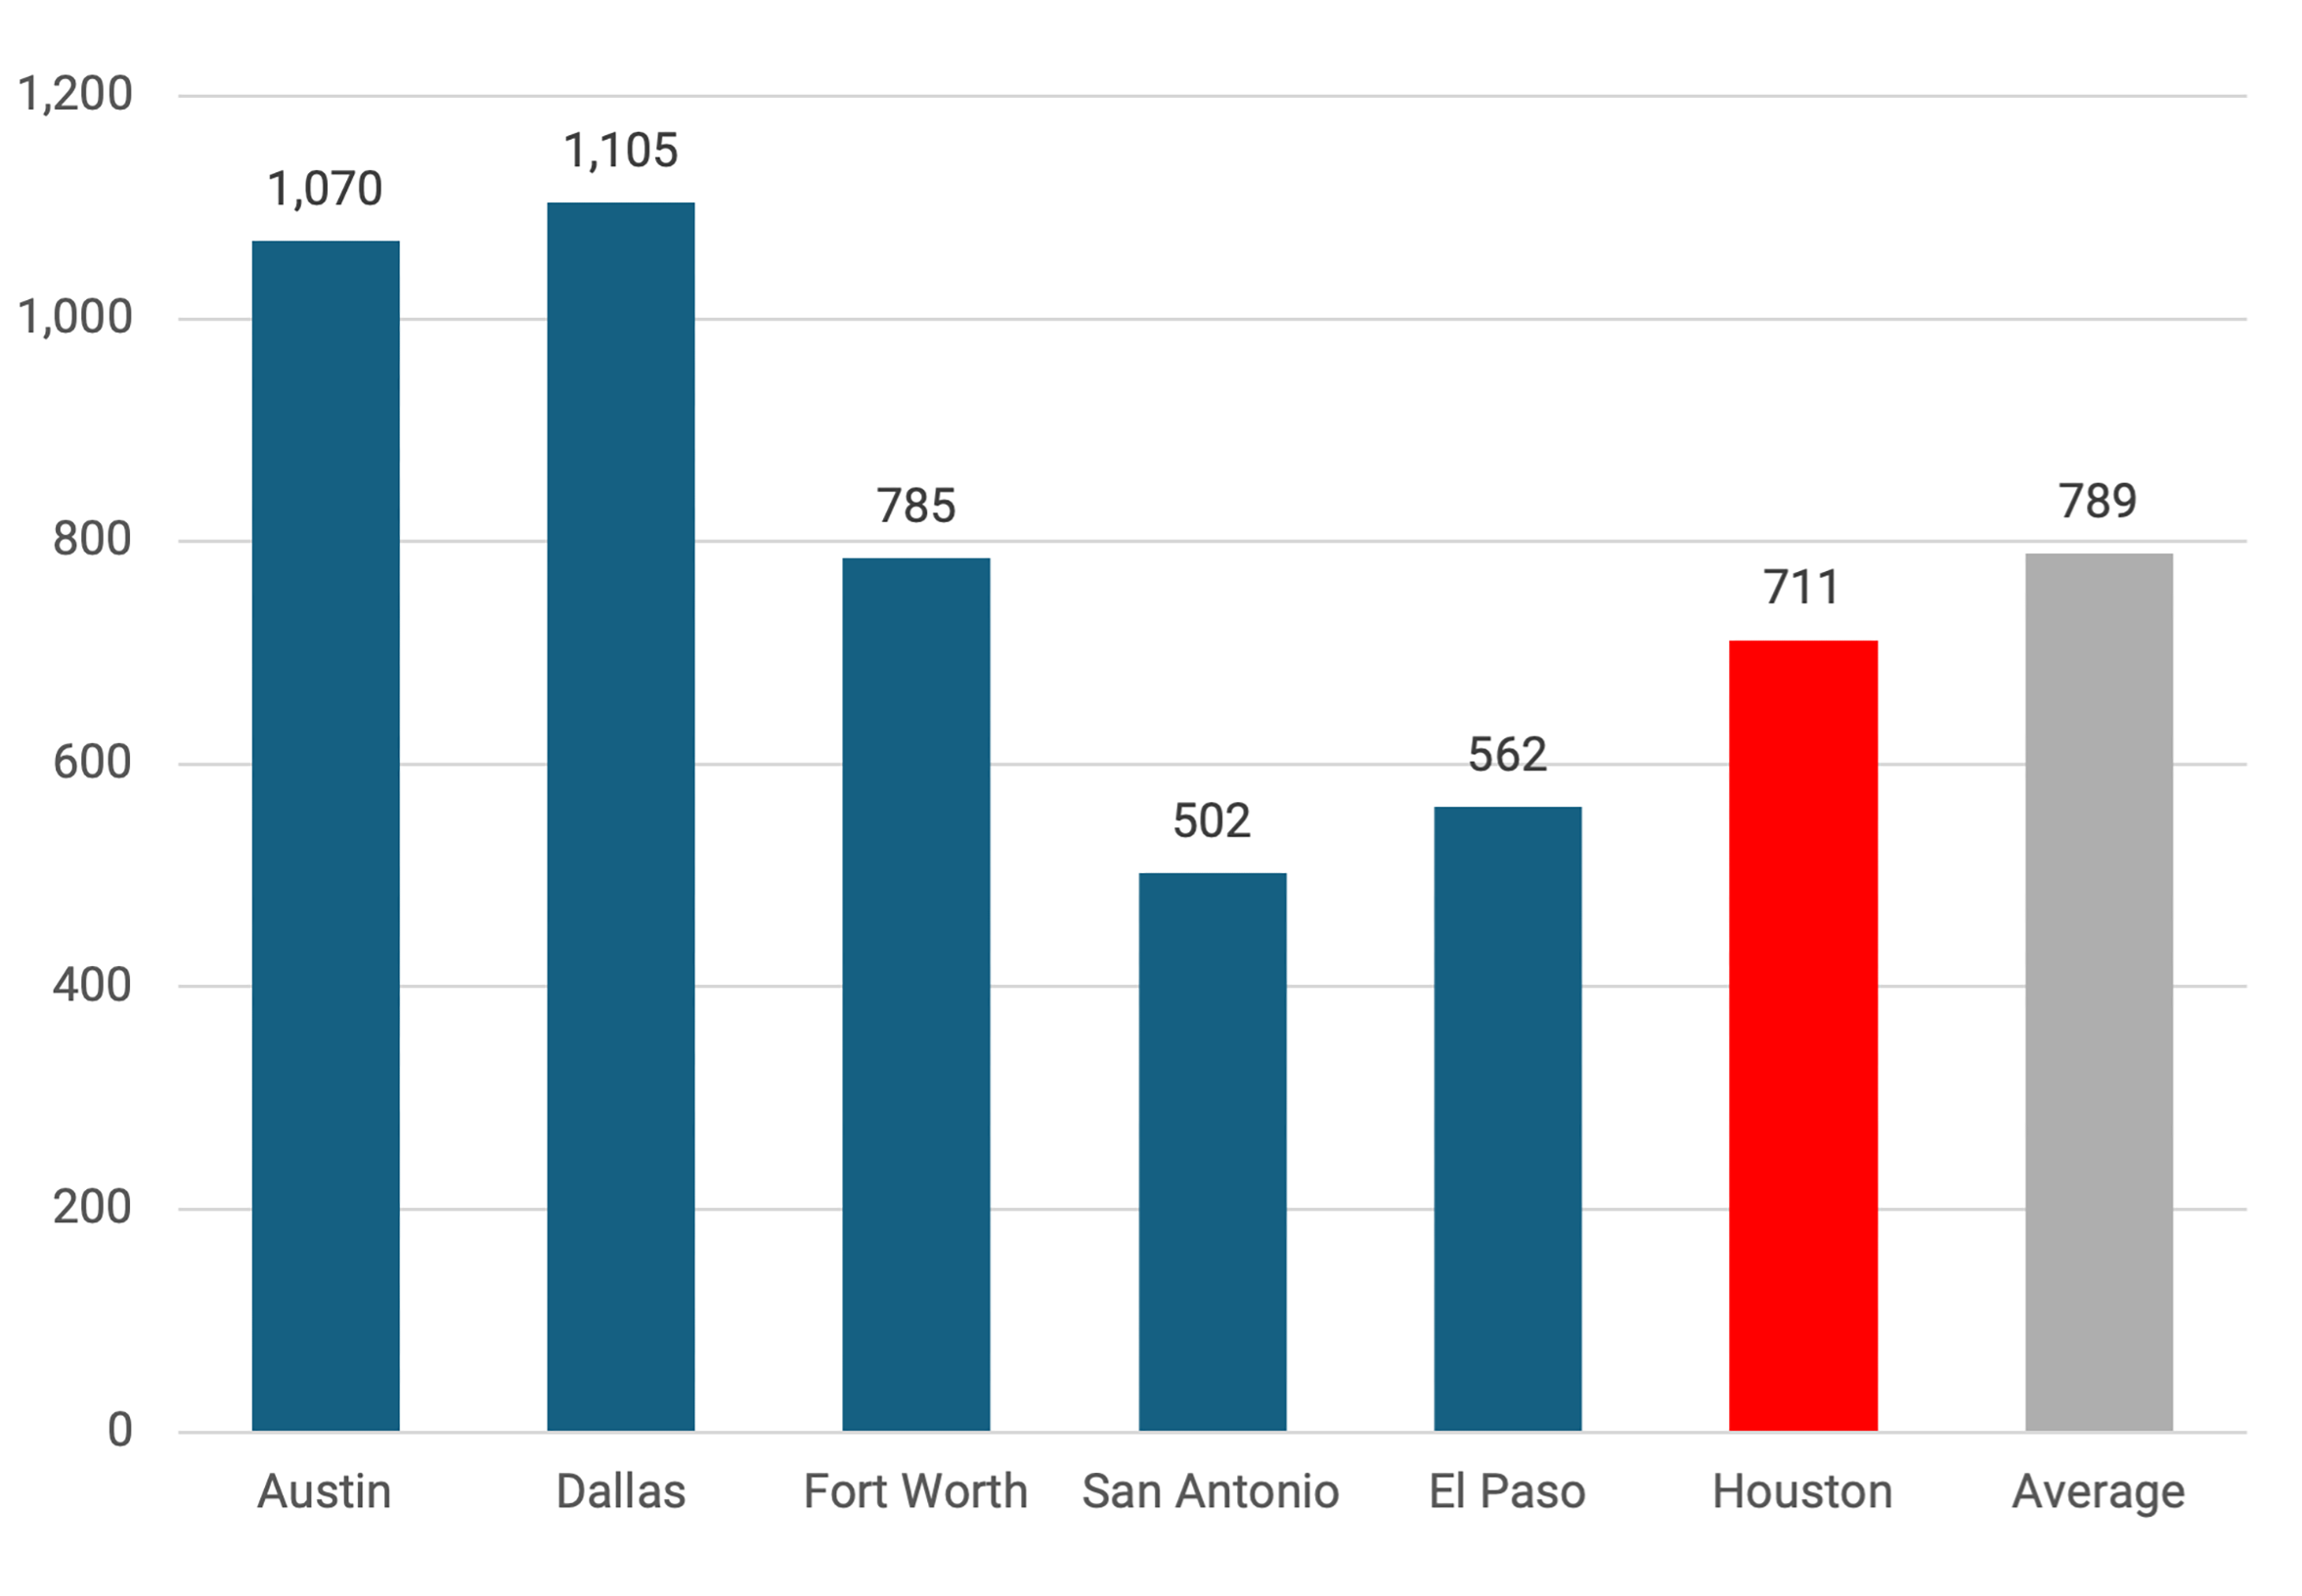
To compare Houston with other major Texas cities, data were compiled for Austin, Dallas, El Paso, Fort Worth, and San Antonio. Total property tax levies and population figures — drawn from each city’s Annual Comprehensive Financial Reports (ACFR) and the ACS — were used to calculate per capita levies.[1] This analysis shows that Houston’s per capita property tax burden is roughly in line with the average across these cities.
Figure 3 presents a different picture than Figure 1. While El Paso has the highest property tax rate and Austin the lowest, the per capita tax levy is higher in Austin and lower in El Paso. This underscores that tax rates alone can be misleading — they do not fully account for differences in income, property values, or population and may not reflect the true burden on taxpayers.
Figure 3 — Per Capita Property Tax Levy in Major Texas Cities
Taxpayers’ Income
However, the per capita levy alone does not account for differences in income levels. To provide a more meaningful comparison, the per capita levy was also calculated as a percentage of per capita personal income, using data from the ACS. This analysis shows that Houston’s ratio is roughly in line with the average for the five comparison cities. Austin, Houston, El Paso, and San Antonio fall within a narrow range, while Dallas and Fort Worth have higher ratios.
Figure 4 — Per Capita Property Tax Levy as a Percentage of per Capita Personal Income

3. Political and Economic Factors
Although the other cities face no local restrictions on raising tax rates (aside from the state-imposed limits in place since 2020), they still fall within a narrow range alongside Houston. This suggests that political and economic factors — not just legal limits like Houston’s 2004 voter-approved cap — also constrain how much cities can raise property taxes. Cities must remain competitive with neighboring communities in terms of their overall tax and services packages. Additionally, state leaders’ ongoing efforts to reduce property taxes reflect Texans’ preference for tax limits. Houston’s own behavior supports this: The city regularly lowered its tax rate before the charter cap applied, and last year, it did not raise the rate despite being legally permitted to do so under the emergency exception.
Conclusion
As outlined in the Center for Tax and Budget Policy’s review of Houston’s most recent ACFR, the city faces serious fiscal challenges. It will need to either reduce expenditures or raise new revenue to offset the substantial federal aid received in recent years, which provided only temporary relief to budget issues. At the same time, the city should address the longstanding underinvestment in infrastructure maintenance and improvements. While increasing the property tax burden may be part of the solution, there appear to be limits to how much more can reasonably be asked of Houstonians. Any revenue increases should be pursued transparently — through direct taxpayer approval at the ballot box — and should be paired with meaningful efficiency gains in the use of existing taxpayer funds.
Note
[1] Population data for each city is from the 2023 American Community Survey (ACS) series S0201: Selected Population Profile in the United States, and per capita income is from the 2023 ACS series DP03: Selected Economic Characteristics. Due to the lack of 2024 Annual Comprehensive Financial Reports (ACFR) releases, property tax levy calculations for San Antonio use the fiscal year-end (FYE) of Sept. 30, 2023, and for El Paso, the FYE of Aug. 31, 2023.
This publication was produced on behalf of Rice University’s Baker Institute for Public Policy. Wherever feasible, the material was reviewed by external experts prior to its release. Any errors are the responsibility of the author(s) alone.
This material may be quoted or reproduced without prior permission, provided appropriate credit is given to the author(s) and Rice University’s Baker Institute for Public Policy. The views expressed herein are those of the individual author(s) and do not necessarily represent the views of Rice University’s Baker Institute for Public Policy.


