
Every three years, the Federal Reserve releases detailed survey data on households’ assets and liabilities, providing one of the best indications of the state of wealth inequality in the United States. This data—the Survey of Consumer Finances (SCF)—showed a persistent rise in wealth inequality between 1992 and 2016. Data from the 2019 SCF, however, showed a small but striking reversal of this trend, as wealth inequality fell for the first time in nearly three decades.1 This was the first release of the data since the passage of the 2017 tax reform, commonly known as the Tax Cuts and Jobs Act (TCJA), prompting interest in whether the tax reform could have caused the decline in wealth inequality.
The TCJA, which is mostly set to expire by 2026, contains several provisions that changed the way households can deduct expenses related to certain activities, like owning homes, paying state and local taxes, and making charitable contributions. These tax deductions disproportionately benefitted higher-income households and, to a large extent, corresponded to the value of taxpayers’ homes. By imposing limitations on these deductions, the TCJA effectively reduced regressive housing subsidies, potentially decreasing relative home valuations for higher-income households. Consequently, because housing comprises a large share of wealth for many U.S. households, the effect of the tax changes on relative home values may have tipped the scale of wealth inequality.
This issue brief studies the recent decline in wealth inequality, with a particular focus on housing. The results show how the observed decline in wealth inequality coincided with similar patterns in the housing market. These patterns align with the theoretical implications of the 2017 tax reform, supporting a causal relationship between the TCJA and the decline in wealth inequality. These findings enhance the understanding of contemporary tax reform and provide a useful context for policymakers, as they weigh their options to address several pending fiscal issues.
Housing Subsidization and the TCJA
The TCJA instituted several influential changes in the tax code, particularly as they relate to tax deductions. Taxpayers can generally choose to reduce their taxable income by either the standard deduction—a flat amount unrelated to any economic activity—or the sum of their itemized deductions, which depends extensively on economic activity. Because of this design, the availability and effectiveness of itemized deductions grows with the level of economic activity, and this tends to correlate positively with household income. The TCJA nearly doubled the standard deduction from $6,500 to $12,000 for individuals ($13,000 to $24,000 for married couples), reducing the share of households benefitting from itemized deductions and dampening the corresponding economic incentives. Further, the TCJA capped the deduction of taxes paid to state and local governments at $10,000 (previously unconstrained) and reduced the maximum deductibility of interest from $1,000,000 to $750,000 of a mortgage loan. These reforms had several important effects, particularly as they relate to the progressivity of the housing subsidies.
Figure 1 — Average Housing Deductions by AGI
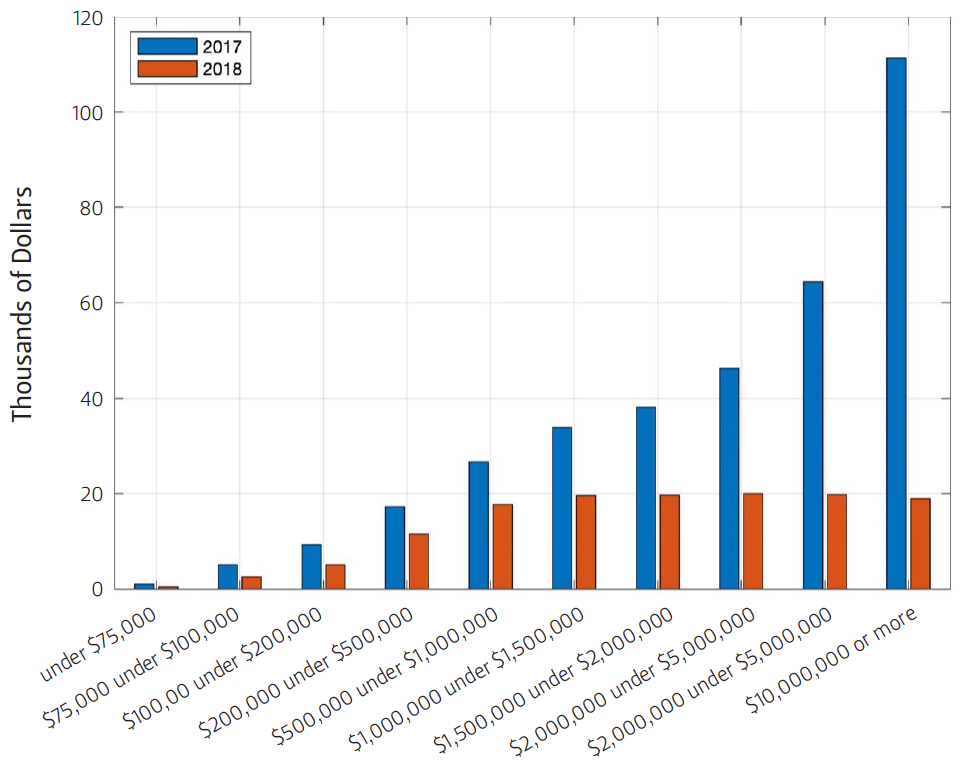
The combination of these reforms—expanding the standard deduction, capping the state and local tax (SALT) deduction, and reducing the mortgage interest cap—reduced subsidies related to home ownership and home valuation in a way that disproportionately raised the effective costs of home ownership for higher-income households. Figure 1 shows, using IRS data, how the size of housing-related deductions changed with adjusted gross income (AGI).2 The average housing deduction, as defined in this application, combines average real estate and property taxes with the mortgage interest deduction by AGI group.3 The graph shows that higher AGI groups experienced larger relative declines in their average housing subsidies. Moreover, because marginal tax rates increase with income, higher-income households generally incurred larger relative reductions in housing subsidies, compared to the change in the deductions.4
TCJA and the Wealth Distribution
At the aggregate level, financial wealth comprises a large share of capital in the United States, but for many households, their home is one of the largest components of their wealth. As a result, shifts in relative home values can affect the distribution of wealth.5 Economic theory would predict that since the 2017 tax reform reduced housing subsidies more extensively for higher-income households, home valuations for those households should have declined, relative to home valuations for lower-income households. Figure 2 shows exactly this shift between 2016 and 2019, as the share of total U.S. housing wealth declined for higher-income households. In particular, the top income quintile experienced a moderate decline in the share of housing wealth, while the bottom 40% of households, who were not as inclined to benefit from itemized deductions, experienced a relative improvement in the distribution of housing wealth.
Figure 2 — Change in Housing Distribution by Income
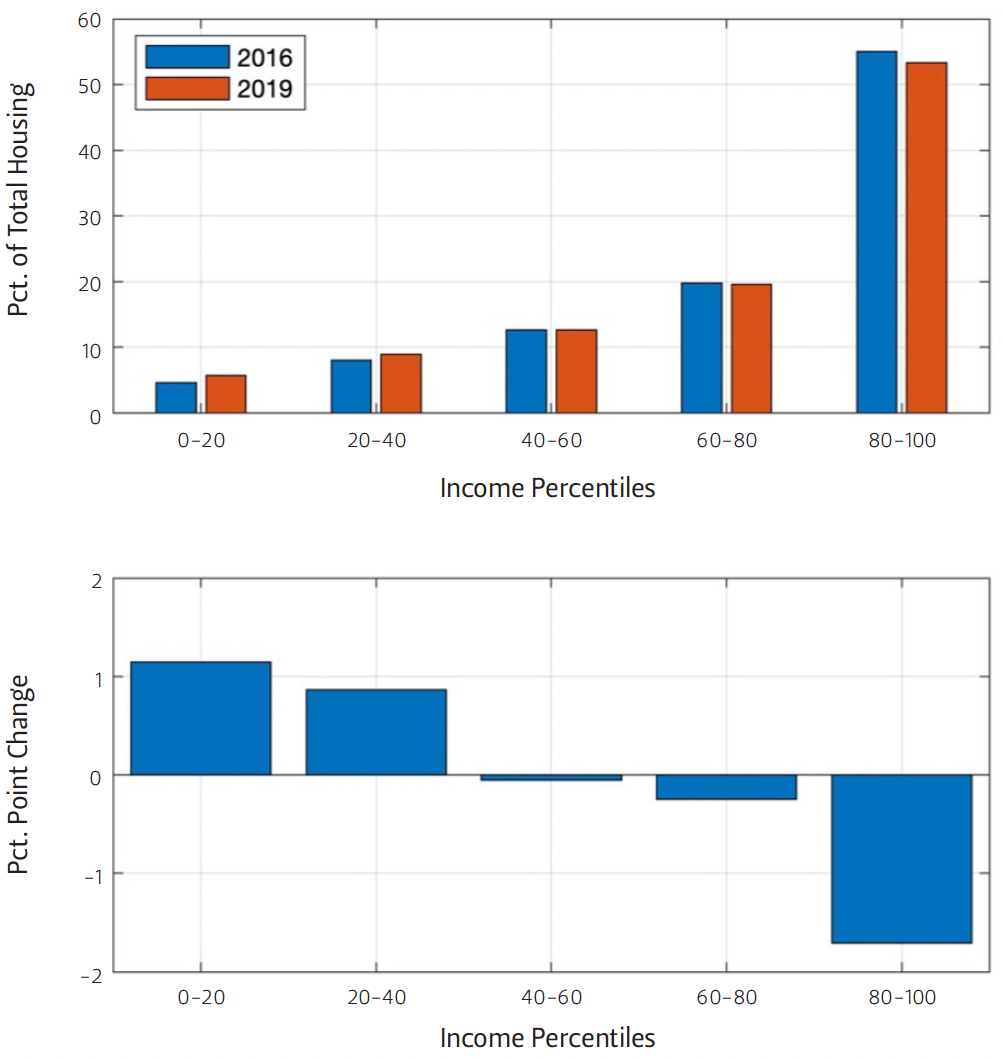
Figure 1 illustrates how the TCJA changed the regressivity of housing subsidies, and Figure 2 demonstrates how the share of housing wealth subsequently changed with income. The passage of the TCJA also coincided with the first decline in U.S. wealth inequality in nearly three decades. Considering the historical relationship between the concentration of housing wealth and total wealth helps to evaluate a causal link between these observations.
Figure 3 — Wealth Gini Coefficient (Top Graph) and Housing Gini Coefficient (Bottom Graph)
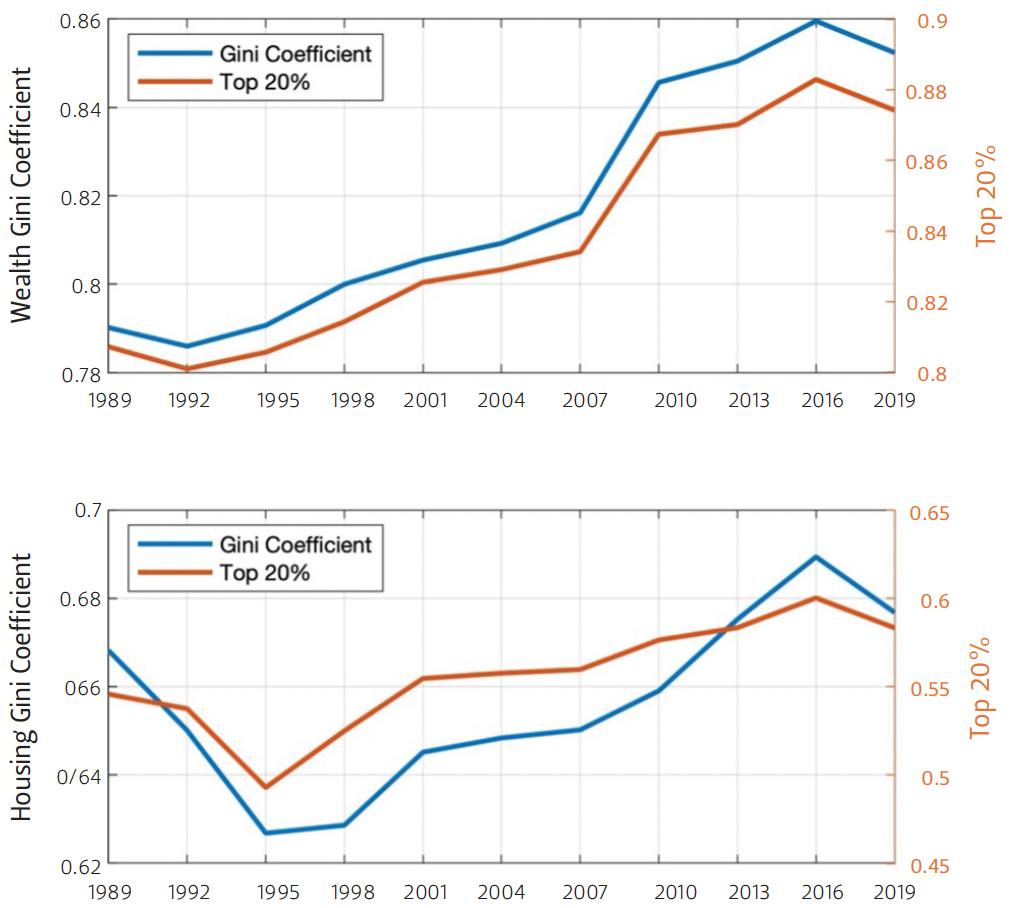
Wealth inequality is typically measured by the Gini coefficient, which quantifies the relative level of concentration at the top of any distribution. Figure 3 presents data from the SCF to show how the Gini coefficient for total wealth (top) and home valuations (bottom) have changed since the inception of the data in its current form in 1989. Both the wealth and the housing series are largely affected by the respective shares held by the top 20% of households, and with the exception of a single observation, both series have always moved in the same direction. Most notably, both series indicated a contraction in inequality between 2016 and 2019. Consequently, if the 2017 tax reform caused a relative appreciation of housing by lower-wealth households, it likely contributed to the decline in wealth inequality measured in the 2019 SCF.
Outlook for Tax Reform
Although the TCJA contained a number of provisions that had differential impacts across the income distribution, the limitation of tax deductions (in isolation) clearly increased the overall progressivity of federal income taxation. Moreover, evidence presented in this brief suggests that the reforms may have contributed to the first reduction in wealth inequality in nearly three decades. Under current law, the limitations of deductions implemented in the TCJA are set to expire by 2026, but some indications suggest reform may come sooner.
Congressional majority party representatives in both the Senate and the House, as well as representatives from the executive branch, have indicated an intent to reform the tax code. Treasury Secretary Janet Yellen specifically expressed a commitment to easing the SALT deduction cap, citing geographical inequities resulting from the reform.6 Recent estimates from the Tax Policy Center, however, show that the current SALT cap resolved more inequities than it created. In particular, if the SALT cap were removed, almost 96% of the gains would accrue to the top 20% of income earners, with 57% of the gains accruing to the top 1%.7 Such a move could also reverse the decline in wealth inequality by reinstating regressive housing subsidies corresponding to the deductibility of property and real estate taxes. In contrast, fully eliminating the deduction, as well as the mortgage interest deduction, could further reduce economic inequality.
Conclusion
The 2019 SCF data indicated a historic reversal of rising U.S. wealth inequality. Although the change could have happened for several reasons, the observed decline coincided with the theoretical implications of the TCJA. Under current laws and current proposals favored by the majority party, certain elements of the TCJA, including the limitation of the SALT deduction, would eventually be undone. This could trigger a rise in wealth inequality, reversing the decline following the implementation of the TCJA.
As policymakers explore options to address several unresolved fiscal issues, including rapidly rising federal debt and the pending expiration of the TCJA, they may seek to extend, expand, or eliminate certain elements of the recent tax reform. If policymakers wish to reduce wealth inequality, easing the SALT deduction cap and expanding the mortgage interest deduction could work against that goal. Doing so would narrow the tax base, requiring higher marginal tax rates to offset the tax losses—a known inefficiency in the economics of taxation. Alternatively, policymakers might choose to build on the provisions in the TCJA, continuing to limit regressive tax deductions—particularly those related to housing—and maintain a broad income tax base to prevent these deductions from exacerbating wealth inequality.
Finally, the extensive literature on wealth inequality attributes its persistent rise in the United States to certain factors like globalization, market concentration levels, and the duration of business cycle expansions. While these factors may somehow relate to inequality, economists must reconcile them vis-à-vis the recent data and the historical implications of regressive subsidies in the federal tax code. If society seeks to understand the causes of U.S. wealth inequality, researchers must dedicate more effort to understanding the implications of tax policy.
Endnotes
1. For an overview of the change in wealth inequality, see Jorge Barro, Decline in U.S. Wealth and Income Inequality Between 2016 and 2019. Issue brief no. 11.04.20. Rice University’s Baker Institute for Public Policy, Houston, Texas, https://www.bakerinstitute.org/research/decline-us-wealth-and-income-inequality-between-2016-and-2019/.
2. This value is per tax filer, as opposed to per itemizing tax filer.
3. Since the SALT cap obscures the relative contribution of each of its components, the limited deductions are included in the place of real estate and property taxes in 2018. This provides a maximum possible benefit of housing subsidies in that year.
4. While estimates of the actual housing subsidy would be ideal to study, average marginal tax rates in corresponding AGI groups are difficult to infer from the aggregate data provided by the IRS.
5. “Net worth gains in 2020 were the largest for the least wealthy,” FRED Blog, July 19, 2021, https://fredblog.stlouisfed.org/2021/07/net-worth-gains-in-2020-were-the-largest-for-the-least-wealthy/.
6. Laura Davison, “Yellen Pledges to Work With Congress on Ways to Ease SALT Cap,” Bloomberg, March 23, 2021, https://www.bloomberg.com/news/articles/2021-03-23/yellen-pledges-to-work-with-congress-on-ways-to-ease-salt-cap.
7. Christopher Pulliam and Richard V. Reeves, “The SALT tax deduction is a handout to the rich. It should be eliminated not expanded,” Up Front (blog), Brookings, September 4, 2020, https://www.brookings.edu/blog/up-front/2020/09/04/the-salt-tax-deduction-is-a-handout-to-the-rich-it-should-be-eliminated-not-expanded/.
This material may be quoted or reproduced without prior permission, provided appropriate credit is given to the author and Rice University's Baker Institute for Public Policy. The views expressed herein are those of the individual author(s), and do not necessarily represent the views of Rice University's Baker Institute for Public Policy.


