About the Map

Layers and Data Sources
Layer Name | Geometry | Description | Data Period | Update Date | Data Source |
Hydrogen, CCS, and Mining | |||||
Operating Hydrogen Pipelines | Line | Active hydrogen pipeline with status, operator, type, and capacity details. | 2024 | 10/3/2024 | |
Hydrogen Facilities | Point | Hydrogen facilities with status, operator, type/color, and technology details. | 2023 | 9/20/2023 | |
CCUS Projects | Point | Carbon capture, utilization facilities with status, capacity and country details. | 2024 | 10/21/2024 | |
Mining Properties | Point | Active mining sites with details on operator, development stage, primary commodity, and mine type. | 2024 | 10/11/2024 | |
Power Plants | |||||
Power Plants - All and By Fuel | Point | Existing power plants with operator, fuel type and capacity details. Bubble color is assigned by fuel type and the size of the bubble indicates the power plant nameplate capacity: | 2024 | 10/21/2024 | |
• Oil & Gas | |||||
• Solar | |||||
• Wind | |||||
• Hydro | |||||
• Geothermal | |||||
• Coal | |||||
• Nuclear | |||||
• Biomass | |||||
Oil and Gas | |||||
Oil and Gas Fields | Point | Existing oil and gas fields by type. | 2024 | 10/21/2024 | |
Refineries | Point | Active and announced conventional and renewable refineries with status. | 2024 | 10/21/2024 | |
Natural Gas Storage | Point | Active and announced natural gas storage facilities with status. | 2024 | 10/21/2024 | |
Gas Processing Plants | Point | Active, announced and planned gas processing plants with status. | 2024 | 10/21/2024 | |
LNG Facilities | Point | LNG facilities by status with operator and gas origin details. | 2023 | 9/20/2023 | |
Crude Pipelines | Line | Crude oil pipelines with status, operator, type, and capacity details. | 2023 | 9/20/2023 | |
Refined Product Pipelines | Line | Refined product pipelines with status, operator, type, and capacity details. | 2023 | 9/20/2023 | |
Natural Gas Pipelines | Line | Natural gas pipelines with status, operator, type, and capacity details. | 2023 | 9/20/2023 | |
Demographics | |||||
Europe Country Boundaries | Polygon | Europe NUTS 0 Demographics and Boundaries provides country-level demographic, economic, and boundary information for Europe. | 2023 | 12/9/2023 | |
GDP per Capita | Polygon | Europe NUTS 0 Demographics and Boundaries provides country-level demographic, economic, and boundary information for Europe. | 2023 | 12/9/2023 | |
Percentage of Population over 60 | Polygon | Europe NUTS 0 Demographics and Boundaries provides country-level demographic, economic, and boundary information for Europe. | 2023 | 12/9/2023 | |
Political Layers | |||||
MMD Boundaries for DE and IT | Data | Multi-Member Districts boundaries for Germany and Italy. See the section below for detailed sources and methodology. | 2024 | 11/8/2024 | The Constituency-Level Elections Archive (CLEA); Bundesanstalt Statistik Österreich. |
National Parliament Single-Member Districts by Political Group | Data | Latest national parliament election results for select European countries. See the section below for detailed sources by country and methodology. | 2024 | 11/8/2024 | The Constituency-Level Elections Archive (CLEA); Boundary Commission for England © Crown copyright 2024. |
National Parliament Multi-Member Districts by Political Group | Data | Latest national parliament election results for select European countries. See the section below for detailed sources by country and methodology. | 2024 | 11/8/2024 | Esri, Michael Bauer Research GmbH 2023, Bundesanstalt Statistik Österreich, Eurostat; The Constituency-Level Elections Archive (CLEA); Center for Energy Studies. |
MEPs by Simplified Political Groups_1979_2024 | Data | Europe Parliament Election (1979-2024) seats data by country. | 2024 | 11/8/2024 | |
Political Methodology
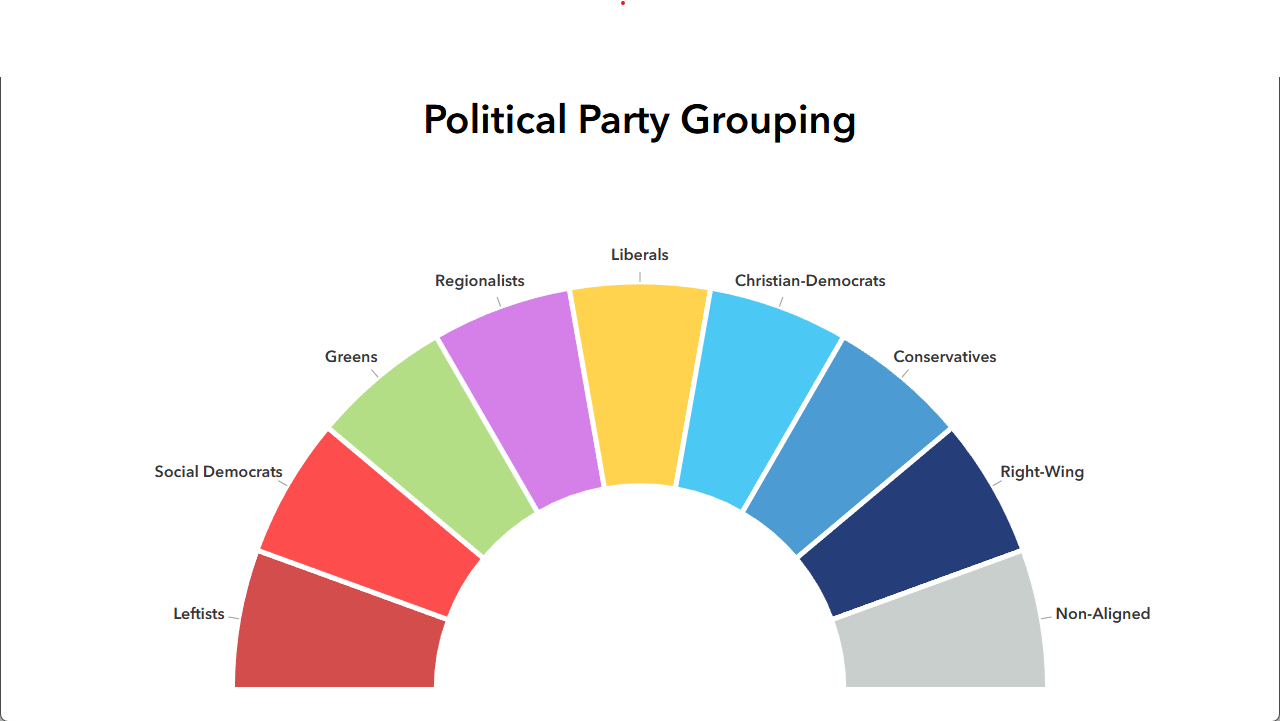
Lower house single-member constituencies in each national legislature included in the map are colored by the associated European Parliament political group of the current member’s national political party. For lower house multi-member constituencies, a donut chart is displayed that depicts the proportions of each associated political group.[1] For ease of identifying general trends, each group is organized into eight broad ideological families: leftists (The Left in the European Parliament in dark red), social democrats (Progressive Alliance of Socialists and Democrats in light red), greens and regionalists (The Greens in green and the European Free Alliance in purple), liberals (Renew Europe in yellow), Christian democrats (European People’s Party in light blue) and conservatives (European Conservatives and Reformists in blue), and far right groups (Europe of Sovereign Nations and Patriots for Europe in dark blue).[2] Non-attached parties or members of parliament (Non-Inscrits) and parties with no clear relationship with a European Parliament political group are depicted in gray. Upper house seats are not mapped.
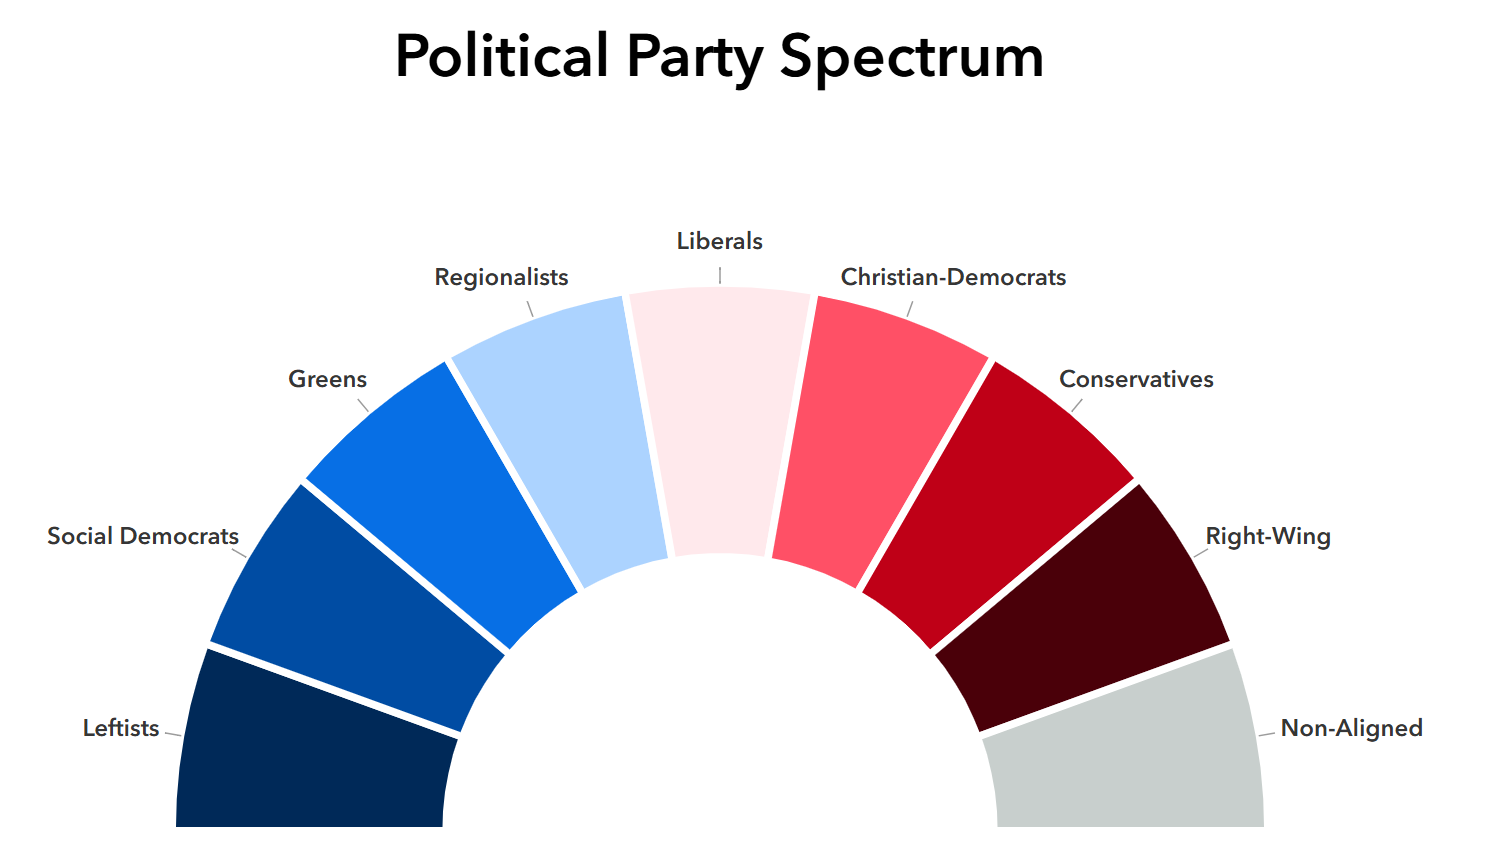
Included in the map is an alternative, simplified political symbology more familiar to users from the United States. The colors of each party group are displayed using a simple two-color gradient, from blue (on the ideological left) to red (on the ideological right) with white in the middle (in the ideological center).
Parties in the United Kingdom are categorized with the last affiliated group before Brexit. Parties in other non-EU countries are categorized with a European Parliament political group if their party is an associate member or a member of an international group associated with one of the party groups. The map displays party seats and party affiliation at the time of election and does not account for individual members of parliament that have left their party, joined a new party, or otherwise been replaced.
Geographic Sources
Kollman, Ken, Allen Hicken, Daniele Caramani, David Backer, David Lublin, Joel Selway, and Fabricio Vasselai. 2019. GeoReferenced Electoral Districts Datasets. Produced and distributed by Ann Arbor, MI: Center for Political Studies, University of Michigan, http://www.electiondataarchive.org.
ESRI Living Atlas, Esri.
Election Sources
National election data by country: Austria,[3] Belgium,[4] Czechia,[5] Denmark,[6] Estonia,[7] Finland,[8] France,[9] Germany,[10] Italy,[11] Ireland,[12] Latvia,[13] Luxembourg,[14] the Netherlands,[15] Poland,[16] Romania,[17] Slovakia,[18] Sweden,[19] Switzerland,[20] the United Kingdom,[21] Iceland,[22] and Norway.[23]
[1] Countries that have both single-member constituencies and multi-member constituencies, Germany and Italy, the single-member constituencies are displayed on the map and the charts of the multi-member constituencies are displayed on the districts’ centroids.
[2] Kaiser, Wolfram and Jürgen Mittag, “Seventy years of transnational political groups in the European Parliament: Origins and trajectories,” Briefing: European Parliament History Series, (European Parliament History Service, 2023) https://www.europarl.europa.eu/RegData/etudes/BRIE/2023/757568/EPRS_BRI(2023)757568_EN.pdf.
Political groups not listed in one of these eight families were added to the group that members or member parties joined in a later parliament. Parties that no longer have representation in the European Parliament are grouped with the last family they were a member of, except in cases of expulsion.
[3] Austria: https://www.bundeswahlen.gv.at/2024/nr/
[4] Belgium: https://elections2024.belgium.be/en/results-figures?el=CK&id=CKR00000
[5] Czechia: https://www.volby.cz/pls/ps2021/ps?xjazyk=EN
[6] Denmark: https://www.dst.dk/valg/Valg1968094/other/Fordelingen-af-mandater-ved-FV2022.pdf
[7] Estonia: https://www.err.ee/k/rk-valimised-2023
[8] Finland: https://tulospalvelu.vaalit.fi/EKV-2023/en/lasktila.html
[9] France: https://data.assemblee-nationale.fr/acteurs/deputes-en-exercice
[10] Germany: https://www.bundeswahlleiterin.de/en/bundestagswahlen/2021/gewaehlte.html
[11] Italy: https://elezionistorico.interno.gov.it/
[12] Ireland: https://data.oireachtas.ie/ie/oireachtas/electoralProcess/electionResults/dail/2020/2020-05-01_33rd-dail-general-election-results_en.pdf & https://www.irishtimes.com/election2020/results-hub
[13] Latvia: https://sv2022.cvk.lv/pub/velesanu-rezultati
[14] Luxembourg: https://elections.public.lu/en/elections-legislatives/2023.html
[15] Netherlands: https://data.overheid.nl/dataset/electionslag-tweede-kamer-2023; MPs elected on the GroenLinks-PvdA list are split into GroenLinks and Partij van de Arbeid.
[16] Poland: https://sejmsenat2023.pkw.gov.pl/sejmsenat2023/en/dane_w_arkuszach
[17] Romania: https://parlamentare2020.bec.ro/wp-content/uploads/2020/12/com_1423.pdf
[18] Slovakia: https://volby.statistics.sk/nrsr/nrsr2023/en/mandaty_strany.html
[19] Sweden: https://resultat.val.se/val2022/RD?r=S
[20] Switzerland: https://www.elections.admin.ch/en/ch/
[21] United Kingdom: https://commonslibrary.parliament.uk/research-briefings/cbp-10009/ and https://boundarycommissionforengland.independent.gov.uk/2023-review/