
Author(s)

The Congressional Budget Office (CBO) recently released its updated federal debt projection to account for the surge in spending corresponding to the COVID-19 pandemic.1
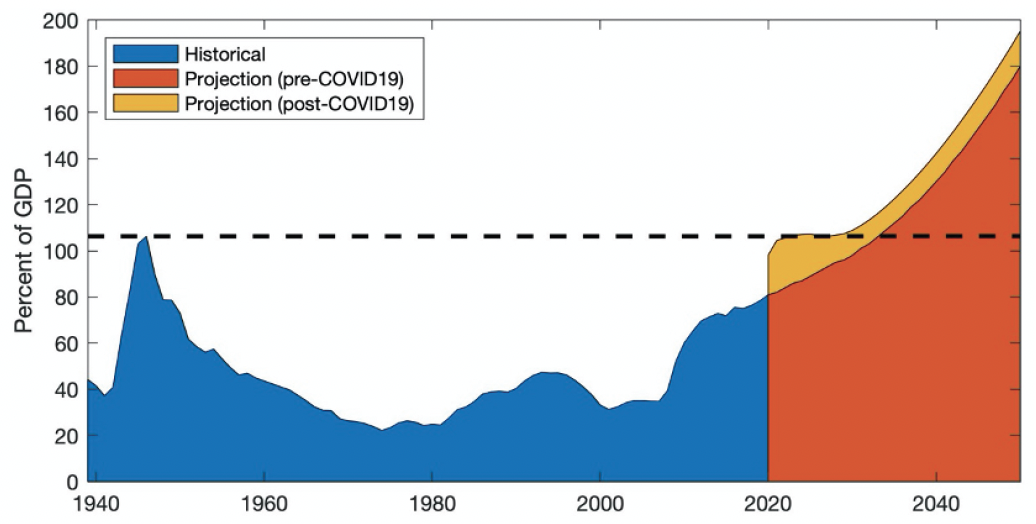
Before the pandemic, the CBO had projected that in 2033, the U.S. would eclipse its historical debt peak of 106% of GDP reached in 1946. Aggressive debt-financed fiscal policy aimed at sustaining output throughout the pandemic narrowed that time horizon by an entire decade. The CBO currently expects U.S. federal debt to reach unprecedented levels in 2023 and continue on a steeper trajectory thereafter.
In many ways, the U.S. faces a similar fiscal situation today as it did in the aftermath of World War II. In both cases, the federal government experienced a surge in debt-financed spending to combat a growing crisis. Citizens then were just as far removed from the Great Depression as we today are removed from the Great Recession. Interest rates in both cases were low, relative to historical values, creating a financial market environment that facilitated heightened debt growth.
As policymakers seek to put current and projected debt growth into perspective, it may seem instinctive to consider the 1946 peak as a point of reference. Despite many similarities in the circumstances, however, several indications suggest that the surge in federal debt today will be very different from the last.
The Federal Reserve
The Great Depression exposed the ignorance of economists at the time. The field of economics itself was in its infancy—particularly with regard to understanding business cycles and the effects of fiscal and monetary policy. Policymakers knew enough, though, to understand that the central bank could influence interest rates on government debt by altering the supply of money. Lacking political independence at the time, the Federal Reserve experienced pressure to suppress interest rates during the first and second World Wars, effectively creating artificial liquidity in U.S. federal debt markets.2
World War II came with a particularly hefty price tag to Americans. A surge in debt-financed federal spending induced a circumstantial rise in economic output, equivalent to massive fiscal stimulus in ordinary economic times. Without a monetary policy response to offset this sharp rise in output growth, the economy experienced a surge in inflation at the onset of the war. Then, at a time when stabilization policy would have recommended a monetary contraction, the Federal Reserve instead expanded the money supply to suppress U.S. Treasury yields for the duration of the war.3 This move effectively financed the war using inflation, which eroded the real value of the federal debt stock.
Figure 1 — Historical and Projected Debt-To-GDP Ratio (1939-2050)
At the time, Federal Reserve chairman Marriner Eccles was reluctant to use expansionary monetary policy to create an accommodative financial market environment, but weighed against the cost of financing a major war, the central bank chose inflation as the lesser of two evils.4 Nevertheless, the ability of outside policymakers to influence the decisions of the Federal Reserve exposed a weakness in its institutional design. This led to the Treasury-Federal Reserve Accord of 1951, which established the central bank’s independence, insulated it from political pressure, and allowed it to focus on maintaining price stability.5
The Federal Reserve today still benefits from political independence, and the result is reflected in modern price stability. For the past few decades, monetary policymakers have successfully contained inflation and maintained it near their 2% annual target.
Figure 2 — Inflation, Interest Rates, and Federal Debt (1940s and 2010s)
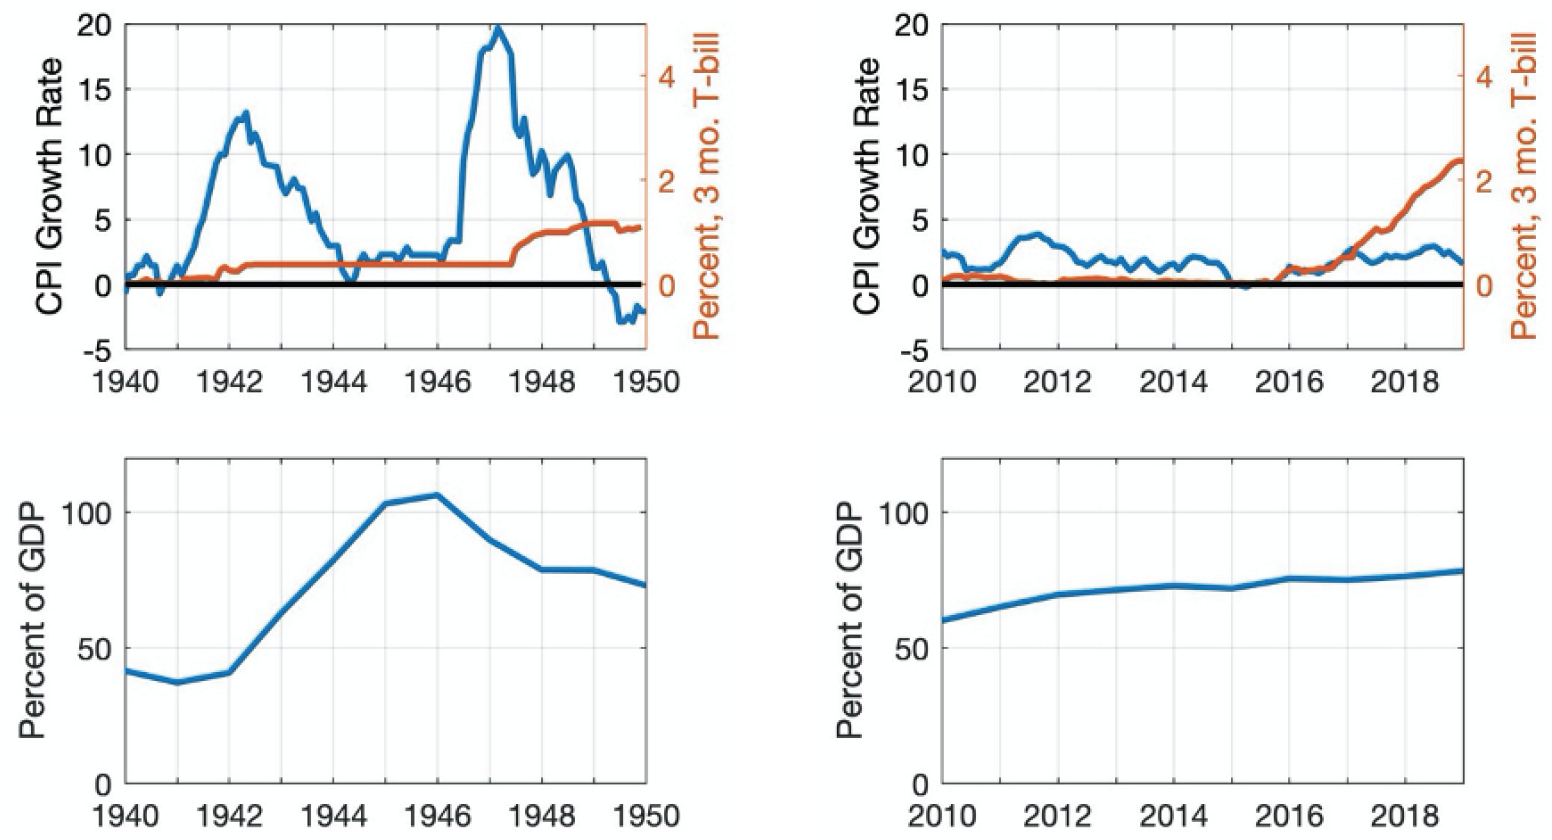
Sources Bureau of Labor Statistics (for CPI), Board of Governors of the Federal Reserve System (for three-month U.S. treasury yields), and OMB (for debt-to- GDP ratio), all accessed via FRBSL (6).
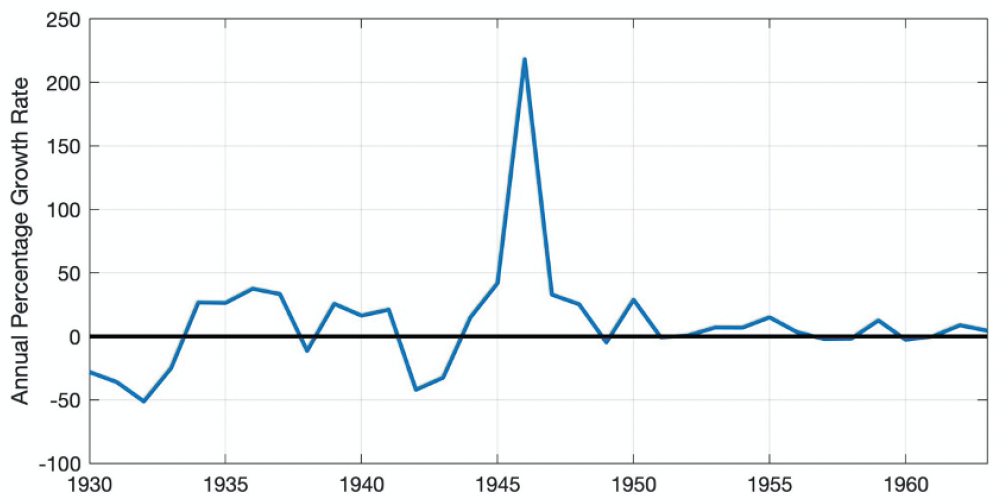
Figure 3 — Private Investment Growth (1930-1963)
Because of its political insulation, the Federal Reserve remains committed to focusing on its dual mandate of price stability and full employment. Consequently, it is unlikely to use monetary policy as a mechanism to maintain low interest rates for the purpose of accommodating growth in debt-financed government spending.
While instances of high inflation plagued the Federal Reserve in the 1940s, avoiding a deflationary episode poses a greater challenge today. The U.S. and other nations around the world were experiencing historically low interest rates as the pandemic started, leaving the Federal Reserve with a narrow range for interest rate reduction to counteract the recession. As a result, the Federal Reserve can likely maintain accommodative monetary policy throughout the pandemic without causing a surge in inflation like that of the 1940s. By doing so, interest rates can remain low, dampening the adverse consequences of the recent government spending surge.
Domestic Savings
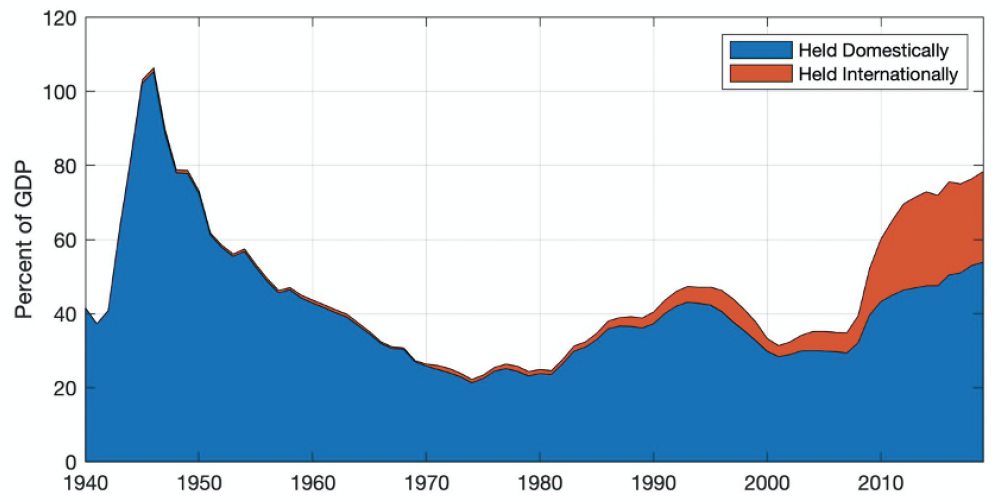
Figure 4 — Domestic and Foreign Holdings of U.S. Federal Debt (1939-2019)
Although the Federal Reserve can guide interest rates in the near-term, there is little monetary policy can do to sustainably influence trends in the real interest rate—i.e., the interest rate net of inflation. Since the 1980s the real interest rate has been steadily declining. This persistent trend puzzled economists for several years, even prompting former Federal Reserve Chairman Ben Bernanke to write a four-part series in 2015 titled, “Why are Interest Rates So Low?”7 Around the same time, several economists were already exploring natural factors, including demographic changes. Economist Lawrence Summers proposed a concept known as the Secular Stagnation Hypothesis—a theory predicated on an aging population as a major factor contributing to declining interest rates.8 This theory suggests that an upward shift in age distribution generates an increase in the share of the population near the peak of lifetime wealth. This, in turn, creates an abundance of capital, relative to the size of the economy, causing a decline in interest rates.
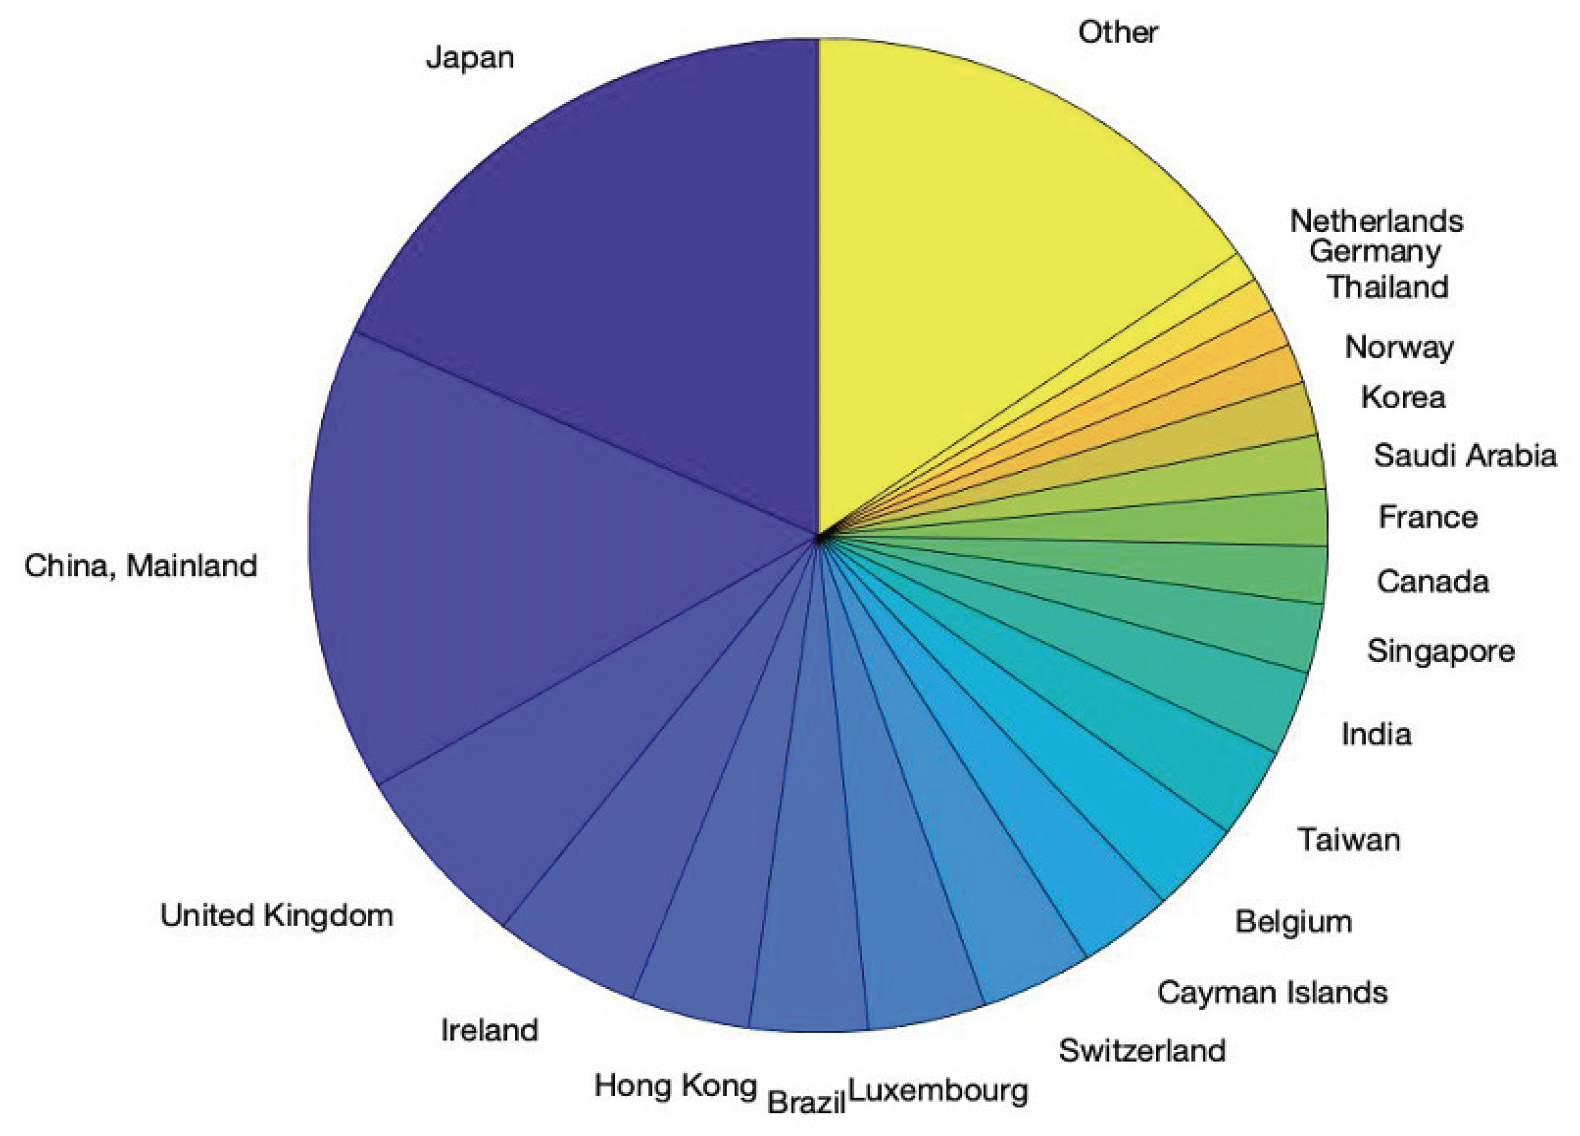
Figure 5 — Distribution of U.S. Debt Holdings by Foreign Country (August 2020)
If, in fact, age demographics are driving the decline in interest rates, then population projections suggest the trend will continue.9 If this results in persistent interest rate declines, then the government can continue to grow debt while potentially sustaining low interest payments.10 This stands in stark contrast to the economy of the 1940s, when the U.S. was on the verge of a population surge commonly known as the baby boom. As the early baby boom cohorts entered the labor force, the economy grew faster than total savings, causing a surge in interest rates in the 1970s-1980s. Had policymakers not taken steps to reduce the debt stock in the aftermath of World War II, the U.S. economy likely would have experienced an extreme shortage of capital, causing interest rates to soar even higher, prompting greater fiscal austerity at a time of historically high tax rates.
The reliance on government debt to finance World War II redirected a large share of capital away from the private sector. Then, a relative decline in government debt following the war sent a surge of capital back to the private sector, generating massive private investment growth that contributed to heightened economic growth of the 1950s.11 Although it may seem natural to infer that a reversal in government debt today might lead to a similar surge in private investment and corresponding economic growth, such an outcome is unlikely. The primary reason is the relative abundance of capital both domestically and internationally, commonly known as the global savings glut.
Another major factor influencing the economy’s responsiveness to debt in the aftermath of the pandemic is the surge in household savings.12 The U.S. economy was already experiencing an abundance of capital in the time leading up to the pandemic, causing a low interest rate environment. Although the savings surge corresponding to the onset of the pandemic may just be transitory, at a minimum it will ensure the economy’s near-term insulation from the adverse consequences of heightened debt growth.
International Capital Flows
Perhaps the biggest difference between U.S. government debt accumulation today and that of the 1940s is the involvement of international investors. International capital market liberalization over the years expanded access to foreign capital, allowing the government to reach beyond domestic resources. That resource was not readily available to the U.S. government in the 1940s. When the federal debt share hit its historic peak in 1946, less than 1% of it was owned by foreign governments. Soaring debt with almost no capital inflows put a strain on the domestic economy at the time. Under normal circumstances, tighter capital markets would have driven up domestic interest rates, but the Federal Reserve instead allowed inflation to erode a share of existing debt. Still, the impact of the debt surge was evident in domestic private investment.
Extensive access to international capital markets today allows the government debt stock to grow while insulating private capital markets. In 2019, foreign investors held 31% of all U.S. debt—far in excess of the trivial share held in 1946. Although the debt-to-GDP ratio in 2019 was 81%, the share held by domestic investors was only 54% of GDP. By contrast, in 1946, domestically held government debt was 105% of GDP—nearly twice the level held by domestic investors in 2019. This indicates why government debt growth today is unlikely to strain private investment like it did during World War II.
Although foreign purchases of U.S. federal debt dampen the impact of government debt growth, it also makes the U.S. accountable to foreign governments in ways it did not during the 1940s. Japanese and Chinese investors alone currently hold one-third of all foreign-held U.S. government debt. As of August 2020, Japan holds the largest share at roughly $1.3 trillion, while China holds about $1.1 trillion. To put this into perspective, accommodative monetary policy in the aftermath of the COVID-19 pandemic raised the Federal Reserve’s holdings of U.S. government debt by about $3 trillion—more than twice that of the largest foreign holdings. Consequently, although the impact of any one country’s investment in U.S. debt holdings remains limited, it serves the interest of the U.S. government to create a hospitable environment for foreign capital.
Conclusion
In the aftermath of the COVID-19 pandemic, the U.S. incurred a surge in government debt, causing it to trend toward levels unseen since World War II. In the coming years, debt is projected to eclipse that peak and enter into an era of unprecedented government debt levels. Though that might seem problematic, several factors are likely to prevent near-term government debt growth from weakening private investment, as it did in the mid 1940s. In particular, domestic and international capital is likely to continue growing in the coming decades, keeping interest rates low and insulating the domestic economy from the adverse consequences of government debt growth.
Unlike the fiscally accommodative monetary policy of the 1940s, the efforts of the Federal Reserve today to avoid deflation coincide with the goals of financing fiscal stimulus amid a pandemic. If current monetary policy results in heightened inflation above the Federal Reserve’s target rate, however, then the central bank’s political independence would likely ensure a return to contractionary monetary policy, ultimately leading to heightened interest rates. In this scenario, interest payments would escalate, and the federal government would be driven into fiscal austerity. A similar situation could result from a decline in foreign capital inflows.
Rather than continuing to rely on a combination of favorable circumstances, the U.S. could reduce its risk exposure by narrowing the deficit. While such a measure may not result in significant gains in economic growth, the move could mitigate the adverse consequences associated with the sudden implementation of fiscal austerity. Though we may not know exactly how close we are to such an outcome, the debt surge corresponding to the pandemic likely brought us a few years closer to it.
Endnotes
1. “The 2020 Long-Term Budget Outlook,” Congressional Budget Office, 2020.
2. Robert L. Hetzel, “From WWII to the Treasury-Fed Accord,” Federal Reserve History, Federal Reserve Bank of St. Louis, November 2013.
3. Daniel Sanches, “The Second World War and Its Aftermath,” Federal Reserve History, Federal Reserve Bank of St. Louis, November 2013.
4. Jessie Romero, “Treasury-Fed Accord,” Federal Reserve History, Federal Reserve Bank of St. Louis, November 2013.
5. Robert L. Hetzel and Ralph Leach, "After the Accord: Reminiscences on the birth of the modern Fed," FRB Richmond Economic Quarterly 87, no. 1 (2001): 57-64.
6. The inflation measure used here is the “Consumer Price Index for All Urban Consumers: All Items in U.S. City Average.”
7. Ben Bernanke, “Why Are Interest Rates So Low?” Brookings Institution, March 30, 2015.
8. Lawrence H. Summers. “Accepting the Reality of Secular Stagnation,” International Monetary Fund, Finance & Development 57, no. 1 (March 2020).
9. Jonathan Vespa, Lauren Medina, and David M. Armstrong, “Demographic Turning Points for the United States: Population Projections from 2020 to 2060,” U.S. Census Bureau, 2020.
10. Jorge Barro, “Long-term Sustainability of U.S. Government Debt Growth,” Issue brief no. 08.19.19, Rice University’s Baker Institute for Public Policy, Houston, Texas.
11. Cecil Bohanon, “Economic Recovery: Lessons from the Post-World War II Period,” Mercatus Center Policy Briefs, September 2012.
12. Jorge Barro, “The Stock Market, the Economy, and Economic Policy Response to the COVID-19 Pandemic,” Baker Institute Report no. 10.15.20, Rice University’s Baker Institute for Public Policy, Houston, Texas.
This material may be quoted or reproduced without prior permission, provided appropriate credit is given to the author and Rice University’s Baker Institute for Public Policy. The views expressed herein are those of the individual author(s), and do not necessarily represent the views of Rice University’s Baker Institute for Public Policy.


