
Author(s)

In early 2020, the novel coronavirus began spreading throughout the United States, causing the worst health crisis in over a century. Willful social distancing and government-mandated restrictions heavily constrained consumer spending, leading to a sharp decline in economic activity. The U.S. economy began an unprecedented contraction, and the unemployment rate surged. Between late February and late March, each of the three major stock indexes lost roughly one-third of their respective values.
Macroeconomic data released in the early months of the pandemic revealed the severity of the decline. Between February and April, the unemployment rate surged from 3.5% to 14.7%.1 Gross domestic product (GDP) in the second quarter of 2020 fell by an annual rate of 32.9%—its sharpest decline on record.2 Even as the disappointing data continued flowing in, however, the stock market began a remarkable recovery. By the end of April, each of the major indexes had erased more than half of their declines, with the NASDAQ composite recovering nearly 70% of its losses.3 In May, the economy began showing some signs of stabilization. The unemployment rate fell to 13.3%, and by August, it would improve to 8.4%. By the end of August, the S&P 500 and the NASDAQ had fully recovered their losses, and the Dow Jones was within 5% of its pre-pandemic peak. Despite the rapid stock market improvement, however, scores of Americans are still unemployed with no end to the pandemic in sight. The strong stock market rebound provided relief for many, but for others, it was cause for concern.
The perceived disconnect between the stock market and the economy caused many to question whether the aggressive fiscal and monetary policy response to the pandemic had left some households behind. The monetary response even raised concerns that the Federal Reserve may be serving a purpose beyond its congressional mandate.
The Stock Market and the Economy
The stock market is not the economy, to be sure. In fact, a recent publication by the Federal Reserve Bank of St. Louis finds that there is very little connection between their respective growth rates.4 The stock market should, however, reflect macroeconomic fundamentals. According to standard corporate finance theory, these fundamentals include values like projected dividends, the interest rate, and the value of companies at the end of their lives, or their terminal values. Implicit in each of these factors are the underlying risks corresponding to adverse outcomes and corporate viability. Studying these factors in the aftermath of the pandemic illustrates why the stock market recovery jumped out ahead of the broader macroeconomic recovery and how government policy influenced that outcome.
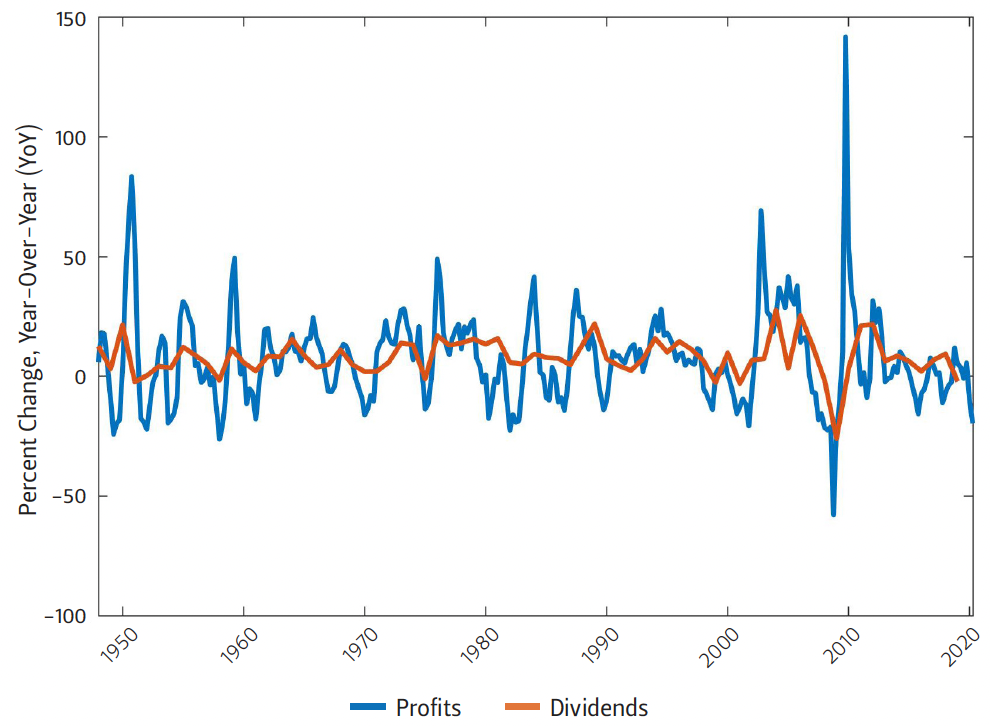
Dividends reflect the strength of underlying corporate profitability. Expected profits, in turn, reflect projected output demand and the ability of firms to cover their costs. At the onset of the pandemic, output demand crashed with the growth rate of consumer spending falling nearly 20 percentage points in the first two months. Data from the first half of 2020 show a 23% drop in profits and an 18% drop in cash flows over that period. These indicators signaled a fast deterioration of corporate viability that was reflected in corporate valuations.5
Macroeconomic downturns generally introduce heightened credit risk, and this pandemic-induced recession was no exception. The decline in output demand and the corresponding decline in cash flow increased the likelihood of rising default rates. Because creditors usually absorb the remaining assets of a firm following their bankruptcy, terminal corporate values effectively diminish after corporate default. This rise in default risk at the onset of the pandemic was evident in corporate valuations.
Figure 1 — Profit (Before Taxes) and Dividend Growth (1948–2020)
Credit markets reveal the extent to which risk played a role in the stock market decline and the corresponding recovery. When corporate default likelihood increases, creditors demand a greater rate of return to compensate them for that risk. The difference between Moody’s Baa medium- grade corporate bonds yields and the 10-year U.S. Treasury yield—a proxy for the risk-free interest rate—reveals this market risk premium commonly known as the yield spread. Figure 2 shows how the yield spread rose sharply between late February and late March, indicating a surge in systemic risk. The yield spread reached a peak on March 23—exactly the same day that the major indexes reached a trough.
It was not happenstance that financial markets rebounded when they did. Around the same time, the Federal Reserve used a variety of unconventional policy tools to initiate an aggressive expansion of credit and liquidity to a range of borrowers that included households, businesses of every size, nonprofit organizations, and municipal governments.6 The result was a significant reduction in systemic risk that stabilized financial markets and initiated the recovery.
Figure 2 — Credit Risk and Equity Markets (Jan–Aug 2020)
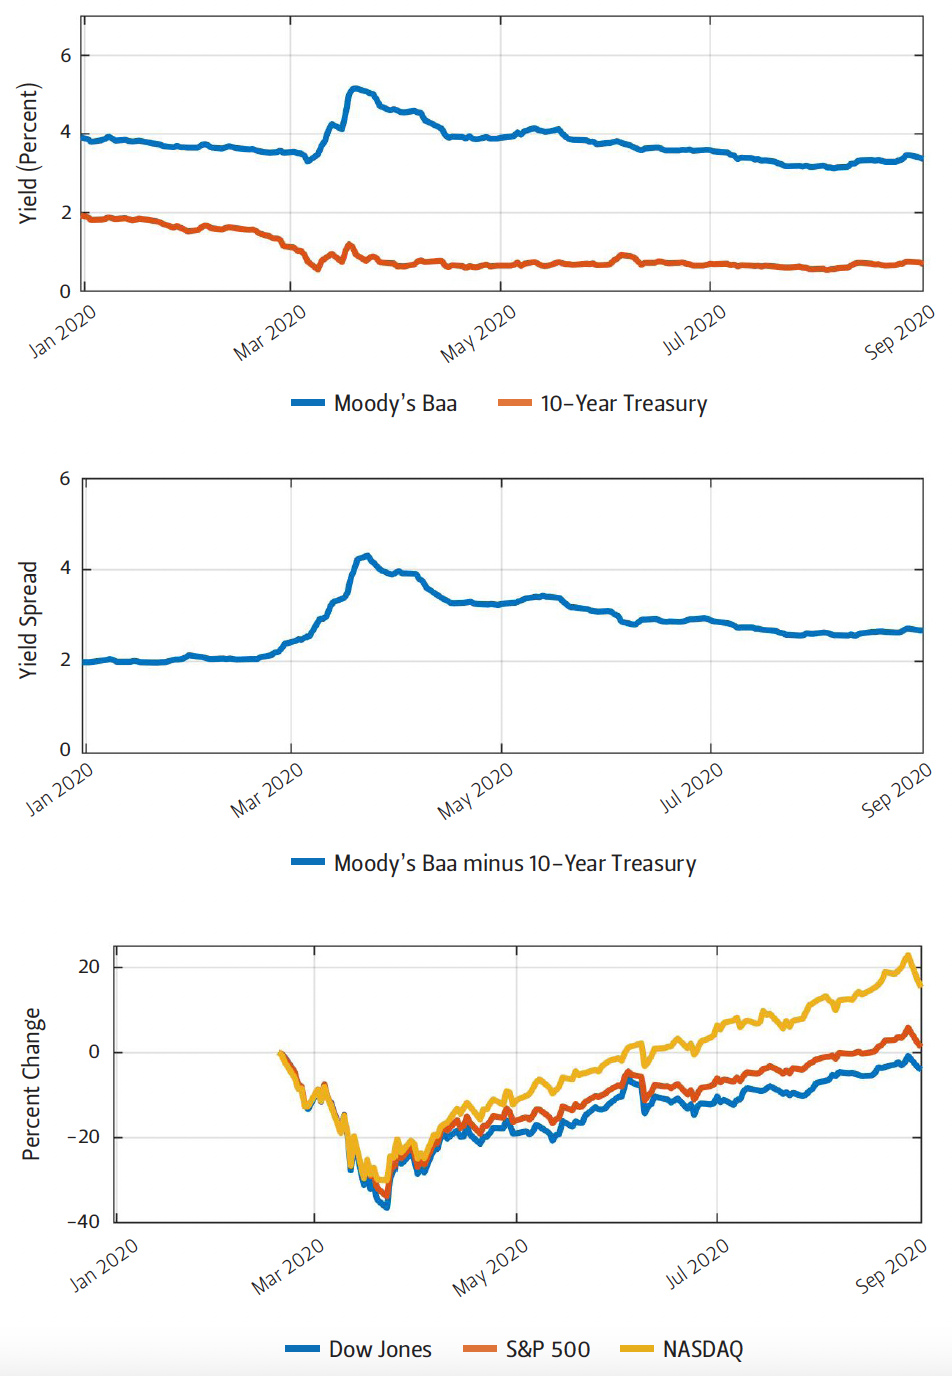
Notes The top graph shows Moody’s Baa and 10-Year Treasury bond yields. The middle graph
shows Moody’s Baa minus 10-Year Treasury Bond yield. The bottom graph shows the change in the
three major stock indexes, relative to February 19, 2020.
In addition to the monetary policy response, the federal government enacted a fiscal expansion aimed at supporting output demand and sustaining corporate cash flows. A massive fiscal stimulus package in the form of means-tested transfer payments and enhanced unemployment insurance helped to support output demand. On the cost side, the federal government funded several credit programs administered by the Federal Reserve that helped businesses meet their financial obligations. These actions limited downside risk and likely narrowed the duration of the recession, expediting the recovery of corporate profitability.
Finally, corporate valuations over this time period were likely affected by the decline in interest rates. The top graph of Figure 2 shows how the 10-year Treasury yield fell sharply at the onset of the pandemic. Unlike expected profits and terminal valuations, stock prices move inversely with the interest rate. As a result, the decline in the interest rate likely dampened the stock market downturn and contributed to its recovery.
Conventional Monetary Policy and the Savings Surge
Figure 3 — Federal Reserve Assets (Jan–Aug 2020)
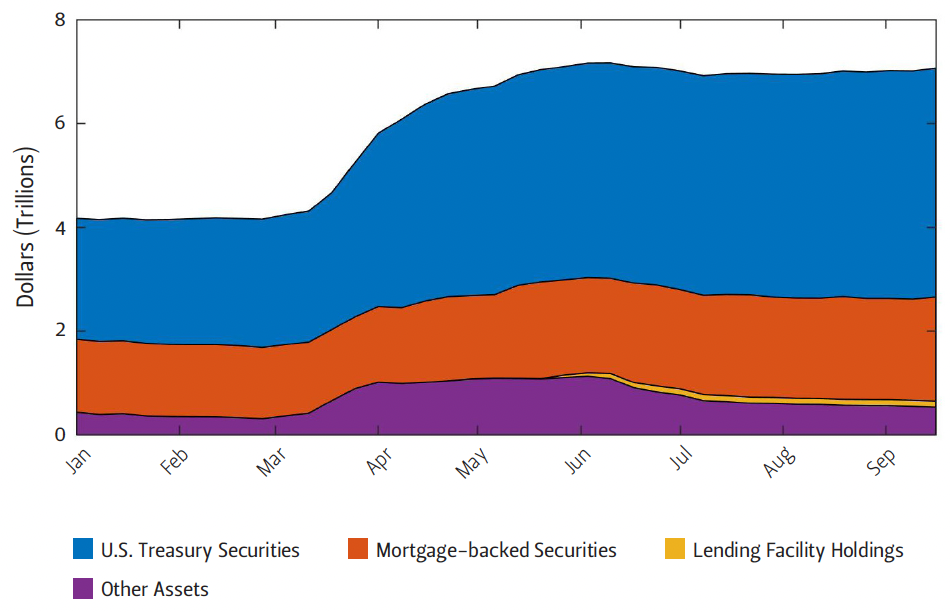
The Federal Reserve also conducted standard monetary policy by purchasing large shares of U.S. Treasury bills. In the first two quarters of 2020, U.S. federal debt held by Federal Reserve banks rose from $2.6 trillion to $4.6 trillion, reflecting aggressive expansionary monetary policy aimed at adding liquidity to financial markets and driving down interest rates. Figure 3 highlights the magnitude of the total monetary policy response by showing how the Federal Reserve’s balance sheet increased by roughly $3 trillion.
While expansionary monetary policy at the onset of the pandemic drove down interest rates, a rise in savings likely also contributed to the decline. Efforts to mitigate the spread of the coronavirus heavily constrained certain types of consumer expenditures, like restaurant dining and travel. The total fall in consumption exceeded the fall in income—in part because of the fiscal stimulus—causing a surge in savings.
Figure 4 — Interest Rates and Deposit Growth (2018–2020)
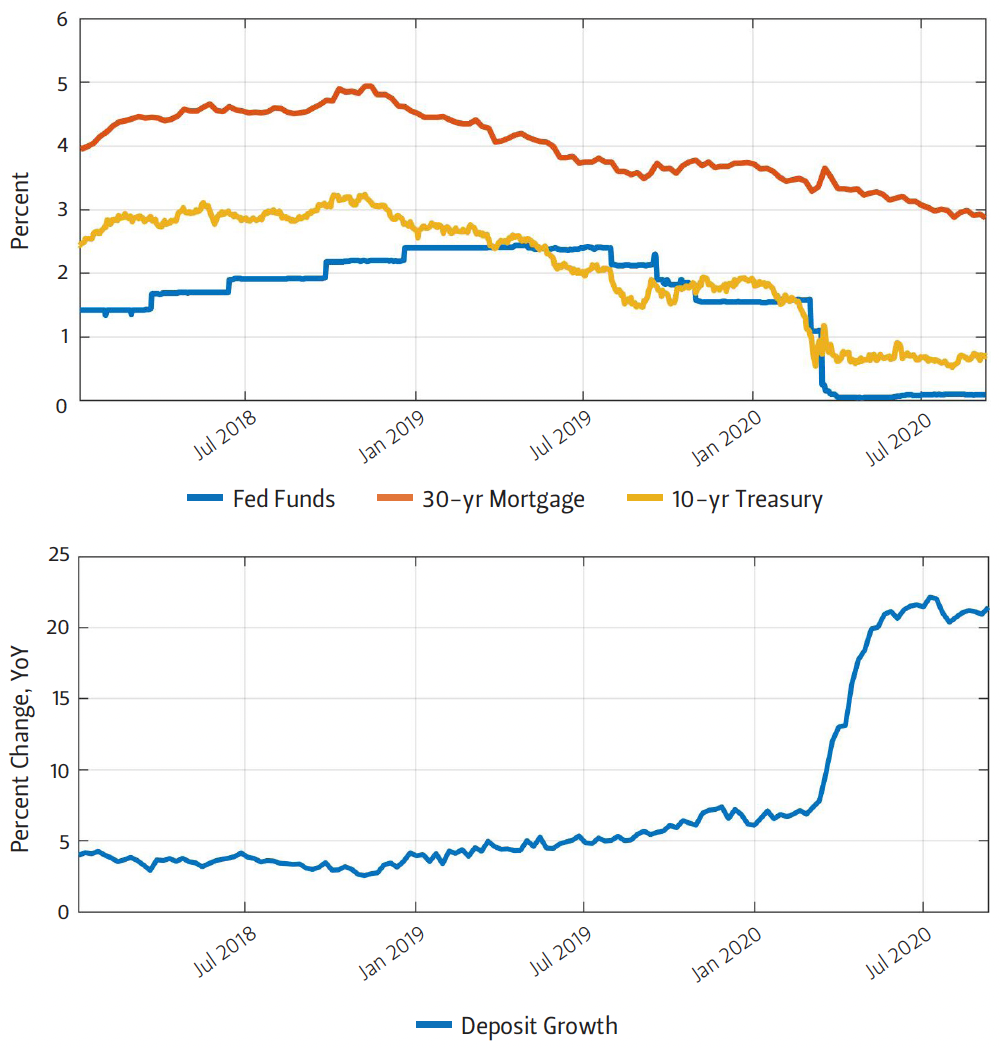
Figure 4 highlights the impact that a rise in savings had on interest rates over several months leading up to the pandemic. Between November 2018 and the start of the 2020 calendar year, the growth rate of bank deposits surged from 2.5% to 6.5%. Mortgage rates and the 10-year Treasury yield immediately moved inversely to the growth rate of deposits, even as the federal funds rate—the Federal Reserve’s target interest rate—continued to rise. Then, at the onset of the pandemic, a rise in savings and expansionary monetary policy flooded the market with capital, generating a significant decline in interest rates and supporting a strong recovery.
Figure 5 — Deposit Growth During Recessions (1973–2020)
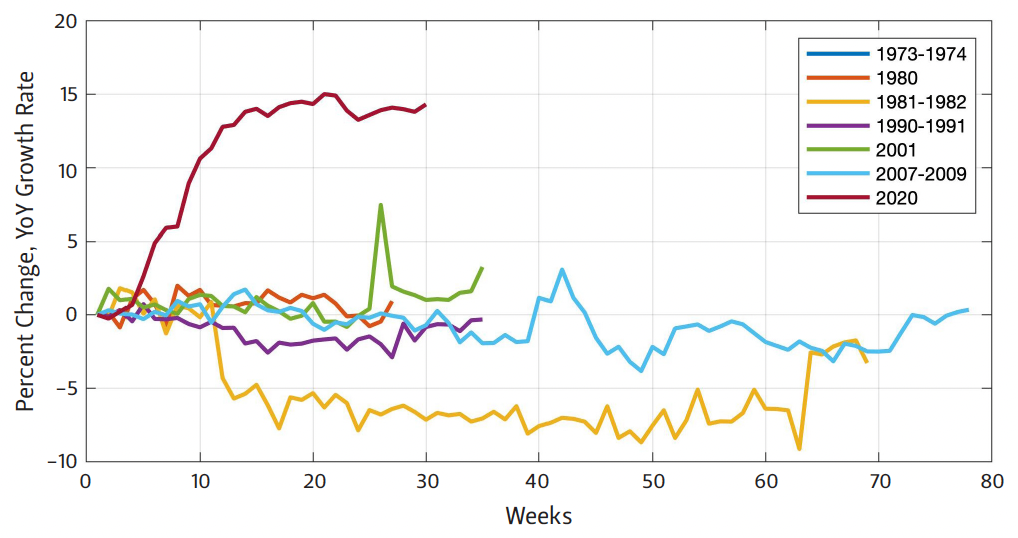
Figure 5 shows just how unusual this recession was with regards to its impact on savings. The graph shows the growth rate of deposits in every recession since the early 1970s. In several cases, the value remained mostly flat throughout the recession, and in some cases, it even declined. During the pandemic of 2020, however, deposit growth soared and remained elevated well into the recession, contributing to a decline in interest rates. Efficiency in financial markets ensures that a broad range of asset prices, including stocks and bonds, maintain some level of risk-adjusted parity. As a result, this unusual surge in savings likely contributed to a stock market rebound well in advance of historical recoveries.
Macroeconomic Policy Evaluation
The expansionary policy measures taken by the federal government and the Federal Reserve avoided an unmitigated financial collapse, limiting damage in other areas of the economy. Between the onset of the pandemic and August 2020, the U.S. federal government increased spending by roughly $3 trillion, while the Federal Reserve’s balance sheets grew by nearly the same amount—in part reflecting their administration of fiscal stimulus.7 The benefit of hindsight now presents the opportunity to begin evaluating the broad macroeconomic policy response. Dimensions of policy analysis include the near-term financial market and labor market recovery, as well as the long-term costs of the intervention. Understanding whether the policy response left some households behind also requires special consideration of the distributional impact of the combined monetary and fiscal response.
Fiscal Policy
Much of the initial fiscal policy debate focused on the magnitude and duration of stimulus, as well as the targeted beneficiaries. Coordination between both political parties resolved many of these concerns to pass a $3 trillion spending package that consisted of three phases.8 The first phase provided $8.3 billion in domestic health care spending and aid to developing countries. The second phase authorized roughly $100 billion in employee-related expenses, including emergency paid sick and family leave, as well as food assistance programs and grants to state unemployment insurance funds. Finally, the third phase, known as the Coronavirus Aid, Relief, and Economic Security (CARES) Act, allocated over $2 trillion in aid and fiscal stimulus to businesses and households.9
Provisions in the CARES Act allocated $500 billion to the Exchange Stabilization Fund—a fund established by law in 1934, originally designed to stabilize exchange rates.10 The CARES Act repurposed the fund as a mechanism to supply credit to eligible businesses and local governments. Of the original $500 billion, the U.S. Treasury was authorized to provide $46 billion in loans directly to companies in the airline industry and businesses critical to national security. The remaining $454 billion would fund several facilities administered by the Federal Reserve to form credit channels to the eligible establishments. Because this share of the stimulus package came in the form of loans, its impact on the federal budget is limited to any unrecovered share of the loan package. As of September 2020, however, the Federal Reserve reported that it expects no losses in any of these programs.11
Figure 6 — Job Separations and Chapter 11 Bankruptcy Filings (2011–2020)
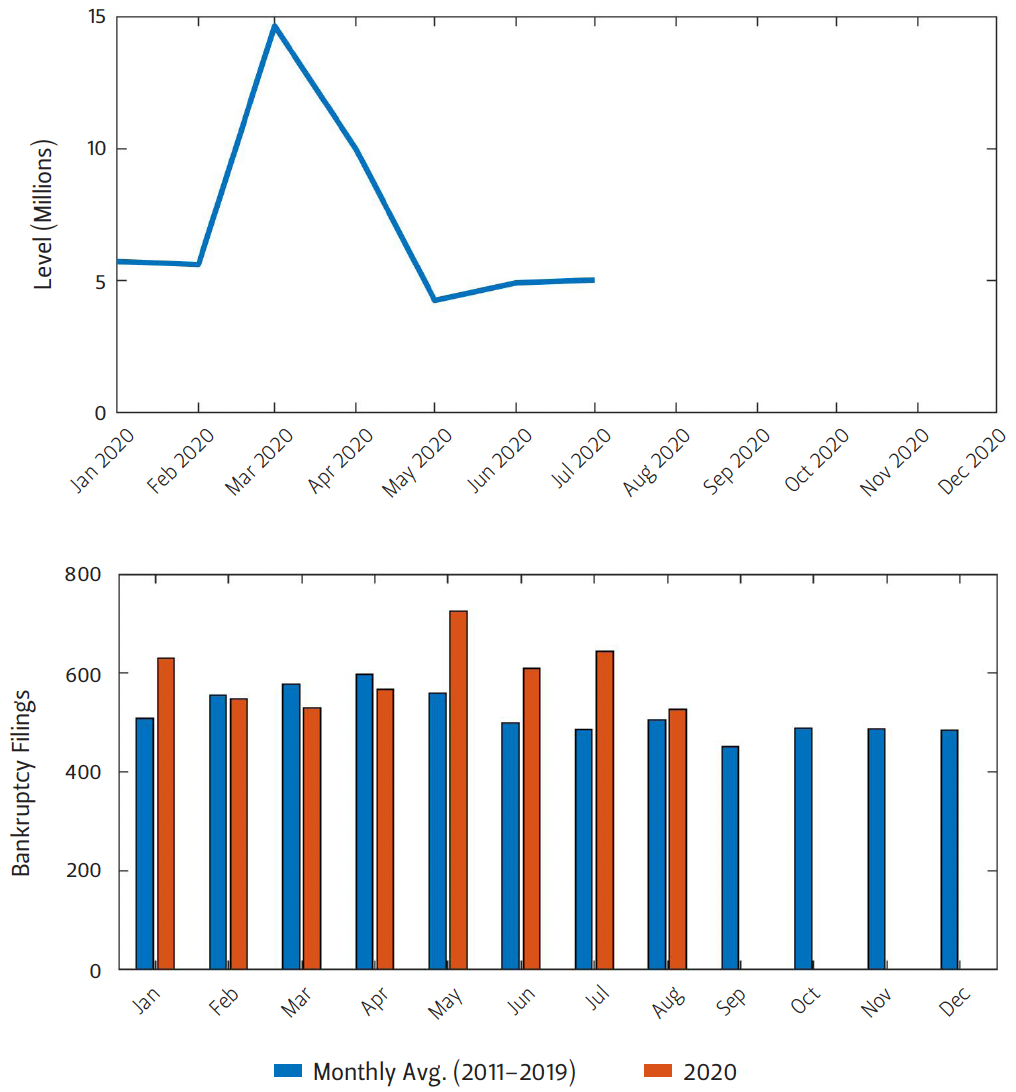
The CARES Act also funded the Paycheck Protection Program—a fund dedicated to sustaining small businesses through forgivable loans. This program allocated $659 billion in business aid specifically targeted to support payroll costs, though the funds could be used by businesses to cover other expenses as well.12 Although bankruptcies and job separations increased in the first half of 2020, the combined policies of the federal government and the Federal Reserve likely sustained many businesses and organizations through the early months of the pandemic and prevented a greater economic downturn. Moreover, the early data shown in Figure 6 indicate that bankruptcies and job separations may have stabilized.
Through a series of transfer payments and enhanced unemployment benefits, the CARES Act dedicated $560 billion directly for households. The transfer payments consisted of $1,200 for single filers whose gross income in 2018 or 2019 was below $75,000, and the payment was phased out for single filers earning between $75,000 and $99,000.13, 14 These payments also included an additional $500 per child for qualifying households. This means-tested design of the transfer payments specifically targeted the stimulus to low-income households. The unemployment insurance enhancement added $600 per week to regular benefits issued by state governments before July 31, 2020.15 Regular unemployment insurance was also extended by 13 weeks. Because unemployment benefits are typically designed to replace a fraction of wage income, the flat-dollar enhancement increased replacement rates more for lower-income households, and in many cases, compensated unemployed job seekers in excess of their lost wages.16
Figure 7 — Family Income Distribution by Month (Jan–August 2020)
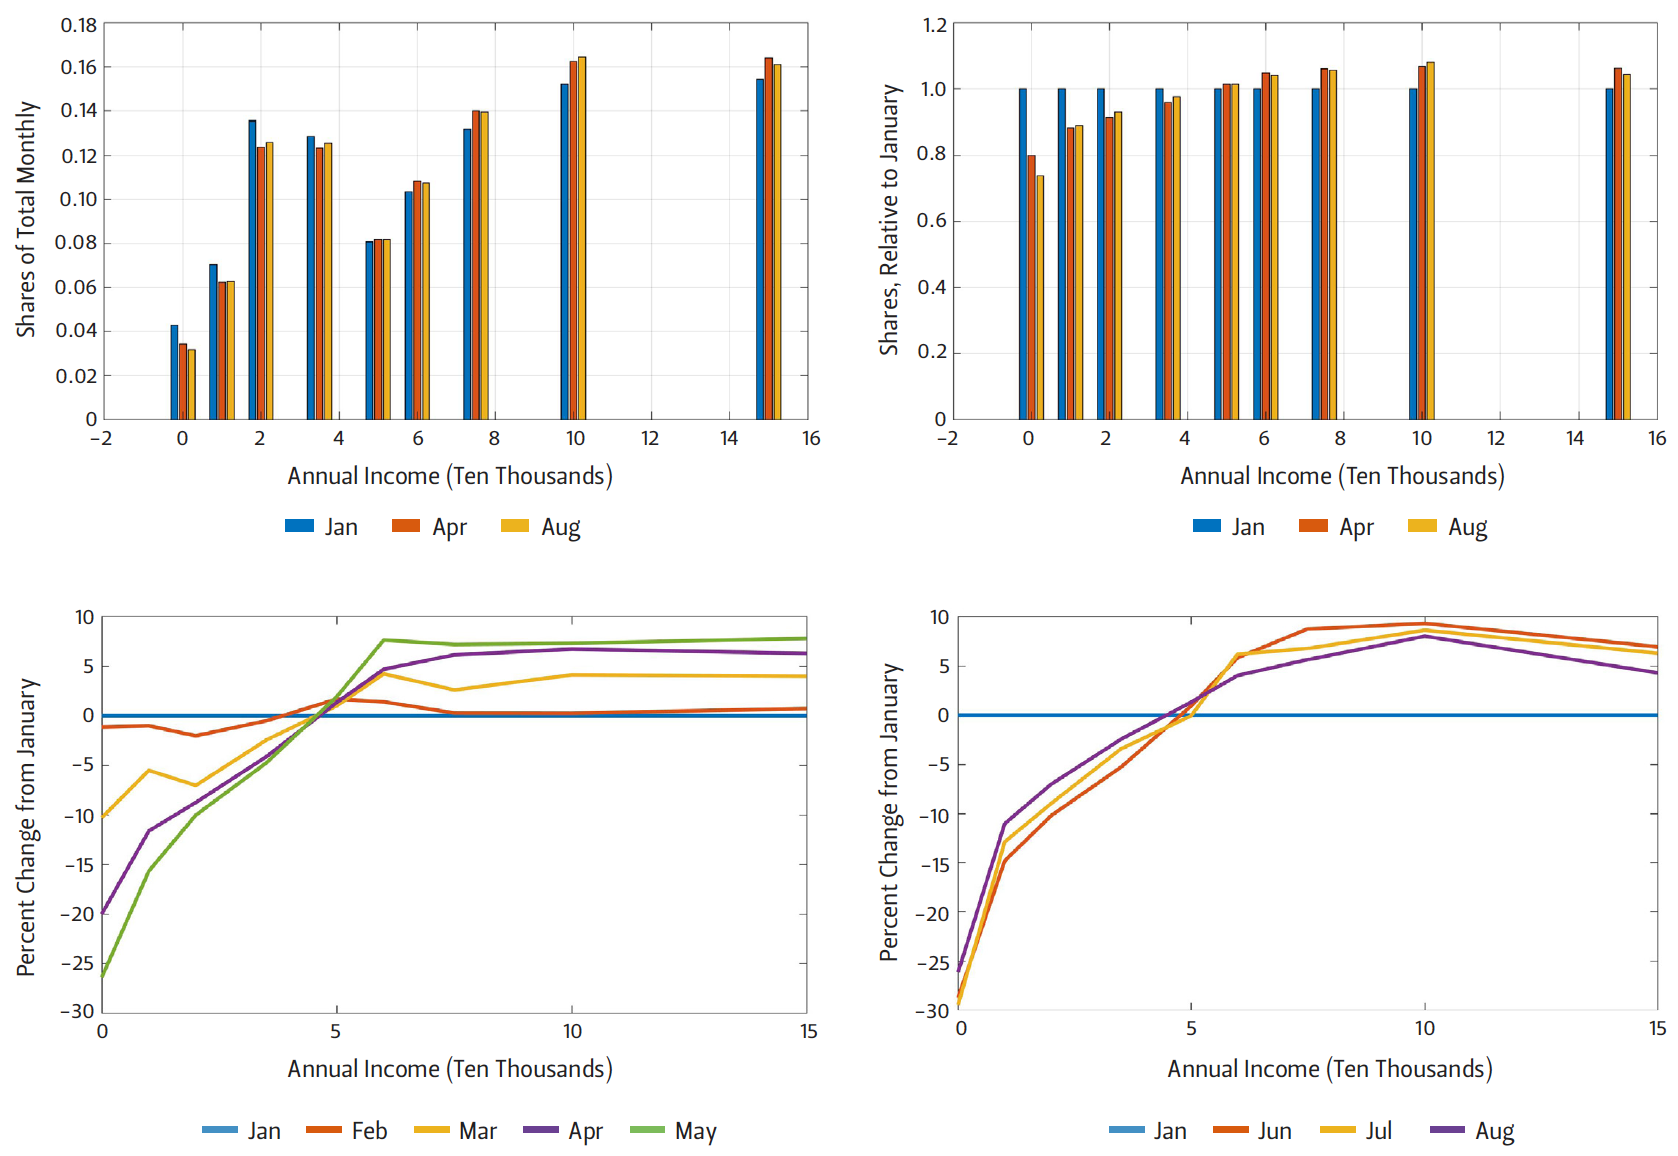
Notes Some income intervals were combined for improved for improved visibility. Since the top interval represents all income over $150,000, bars were placed
at the lower bounds of the combined intervals.
The monthly Current Population Survey indicates how the federal response impacted the income distribution. The monthly survey reports annual family income in specified intervals. The top left graph of Figure 7 shows this distribution for January, April, and August 2020. The top right graph shows the same income bins normalized to January 2020. Finally, the bottom graphs represent the values in the top right graph as percentage changes from January for the months of February through May (left) and June through August (right). The data show a clear upward shift in the income distribution at low-income levels that persisted through the first five months of the year, with large gains starting in March. Then, the distribution settled in June and began reverting slightly in the subsequent months.
The improvement in the income distribution, particularly at lower-income levels, makes sense, considering that the stimulus payments were means-tested. The enhanced unemployment benefits would have also disproportionately benefitted lower-income groups, since lump-sum enhancements likely improved the annual income for many of those beneficiaries, rather than simply replacing a share of lost wages. These outcomes are consistent with other research findings that the fiscal stimulus significantly benefitted low-income groups, likely even reducing the poverty rate.17
Early in the legislative process, enhanced unemployment benefits appropriated in the CARES Act stoked concerns about disincentivizing people to search for jobs, which could lead to a prolonged labor market recovery. A nearly immediate reversal in the unemployment rate in May 2020 with sustained employment gains in the subsequent months, however, quickly put those concerns to rest. That the federal government could enhance unemployment benefits and issue stimulus payments while reducing the unemployment rate and improving the income distribution speaks to the success of the fiscal response.
Monetary Policy
The Federal Reserve’s response received criticism for prompting a stock market recovery at a time when many still appeared to be reeling from the economic downfall of the pandemic. Concerns grew over the perceived divergence between the stock market recovery and the broad macroeconomic recovery with particular consternation that monetary policy might amplify a growing wealth gap.
Financial markets experience fluctuations in the natural progression of business cycles. When the government intervenes in financial markets—presumably in an effort to limit extreme downside risk—it may create moral hazard in the financial system by effectively subsidizing risk. In particular, if investors anticipate interventions during market downturns, then such government responses can encourage investors to take on excessive risk. In addition to the distributional concerns of financial market support, the possibility of cultivating perverse investment incentives compounded the Federal Reserve’s criticism at the onset of the pandemic. The analysis above indicates that the Federal Reserve’s actions likely did support financial markets, which, in the judgement of its policymakers, was needed to dampen the broad macroeconomic downturn.18 Determining whether this was an appropriate response requires a deeper look into the Federal Reserve’s congressional mandate, as well as its legal capacity to conduct monetary policy through unconventional channels.
The Federal Reserve was created by the Federal Reserve Act of 1913.19 Although its purpose would evolve over time, the central bank currently adheres to an amendment to the bill passed in 1977 that specified its role is “to promote effectively the goals of maximum employment, stable prices, and moderate long term interest rates.”20 This set of objectives, commonly referenced as the Federal Reserve’s dual mandate, narrowed its focus and held it accountable to Congress along these specific dimensions. Consequently, the Federal Reserve’s response to the financial market turmoil at the onset of the pandemic raises the question of whether financial market stability lies within the scope of its mandate.
In the 1930s, following the financial market collapse of the Great Depression, Congress passed several pieces of legislation permitting the Federal Reserve’s direct interaction with a broad range of non-financial institutions in times of financial turmoil. This provision, summarized in Section 13(3) of the Federal Reserve Act, created the legal capacity to form several lending channels established in the aftermath of the Covid-19 pandemic.21 Operating under the scope of this provision, the Federal Reserve supplied credit to several types of institutions, leading to a reduction in systemic financial market risk. Still, the legal authority did not guarantee that such actions would serve its mandate.
The Federal Reserve’s use of unconventional monetary policy during the 2008 financial crisis raised questions of whether direct extension of credit to non-financial institutions served the interest of the central bank’s mandate. In response, Congress made several modifications to clarify the Federal Reserve’s legal framework, but, still, nothing granted it the explicit objective to support broad financial market stability. As a result, the Federal Reserve’s unconventional policy at the onset of the pandemic resurfaced criticism that those actions supported financial markets without a specific mandate to do so. Finally, in May 2020, the Federal Reserve expressed confidence in its decisions, stating: “Promoting financial stability is a key element in meeting the Federal Reserve's dual mandate for monetary policy regarding full employment and stable prices. In an unstable financial system, adverse events are more likely to result in severe financial stress and disrupt the flow of credit, leading to high unemployment and great financial hardship.”22
Conclusion
While the stock market may not be the economy, the two remain closely connected through market fundamentals. In the early months of the pandemic, a sharp decline in economic activity prompted a surge in financial market risk and a corresponding decline in the stock market. Decisive action taken by monetary and fiscal policymakers mitigated the macroeconomic and financial market downturn at a time when the policy response had no clear model. Data going into the final months of 2020 indicate a persistent improvement, but the recovery has a long road ahead.
In mitigating the economic impact of the pandemic, the federal government incurred a surge in debt that will need to be repaid. Policymakers will eventually need to reduce spending or raise taxes to offset this debt growth. In the meantime, the government and the economy at large will continue benefitting from historically low interest rates. Similarly, expansionary monetary policy by the Federal Reserve could result in heightened inflation. Because of the possibility of a deflationary episode, however, the central bank likely welcomes the inflation risk to the upside.
Even with the benefit of hindsight, it would be hard to look back at the initial fiscal or monetary response and find much room for improvement. The Federal Reserve may continue facing criticism for growing the wealth gap, but without their aggressive financial market response, adverse outcomes could have spread to other areas of the economy, disproportionately impacting low-income households. Moreover, viewing the actions of the Federal Reserve in isolation obfuscates the broad government response that included extensive fiscal stimulus directed at low-income households. Consequently, criticism that the broad economic policy response left some income groups behind would be largely misdirected.
Endnotes
1. BLS (Bureau of Labor Statistics), “The Employment Situation—April 2020,” BLS News Release, May 8, 2020, https://www.bls.gov/news.release/archives/empsit_05082020.pdf.
2. BEA (Bureau of Economic Analysis), “Gross Domestic Product, 2nd Quarter 2020 (Advance Estimate) and Annual Update,” BEA News Release, July 30, 2020, https://www.bea.gov/news/2020/gross-domestic-product-2nd-quarter-2020-advance-estimate-and-annual-update.
3. Author’s calculations.
4. “The stock market is not the economy,” FRED Blog, August 19, 2019, https://fredblog.stlouisfed.org/2019/08/the-stock-market-is-not-the-economy/.
5. According to BEA data accessed via FRBSL.
6. Jeffrey Cheng, Dave Skidmore, and David Wessel, "What’s the Fed doing in response to the COVID-19 crisis? What more could it do?" Brookings, July 17, 2020, https://www.brookings.edu/research/fed-response-to-covid19/.
7. “Policy Responses to Covid-19,” International Monetary Fund, last updated September 25, 2020, https://www.imf.org/en/Topics/imf-and-covid19/Policy-Responses-to-COVID-19.
8. Jorge Barro and John Diamond, “Coronavirus Fiscal Aid Measures,” Baker Institute Blog, March 31, 2020, https://bakerinstituteblog.blogs.rice.edu/2020/03/31/coronavirus-fiscal-aid-measures/.
9. “The CARES Act Works for All Americans,” U.S. Department of the Treasury, 2020, https://home.treasury.gov/policy-issues/cares.
10. Marc Labonte, Baird Webel, and Martin A. Weiss, “Treasury’s Exchange Stabilization Fund and COVID-19,” Congressional Research Service Report, April 10, 2020, https://crsreports.congress.gov/product/pdf/IF/IF11474.
11. “Periodic Report: Update on Outstanding Lending Facilities Authorized by the Board under Section 13(3) of the Federal Reserve Act September 7, 2020,” Federal Reserve Board of Governors, September 7, 2020, https://www.federalreserve.gov/publications/files/pdcf-mmlf-cpff-pmccf-smccf-talf-mlf-ppplf-msnlf-mself-mslpf-nonlf-noelf-9-8-20.pdf.
12. “The CARES Act Provides Assistance to Small Businesses,” U.S. Department of the Treasury, 2020, https://home.treasury.gov/policy-issues/cares/assistance-for-small-businesses.
13. All values doubled for joint filers.
14. “The CARES Act Provides Assistance to Workers and their Families,” U.S. Department of the Treasury, 2020, https://home.treasury.gov/policy-issues/cares/assistance-for-american-workers-and-families.
15. “Unemployment Insurance Relief During COVID-19 Outbreak,” U.S. Department of Labor, 2020, https://www.dol.gov/coronavirus/unemployment-insurance.
16. Nicholas Petrosky-Nadeau and Robert G. Valletta, “Did the $600 Unemployment Supplement Discourage Work?” Federal Reserve Bank of San Francisco Economic Letter, September 21, 2020, https://www.frbsf.org/economic-research/publications/economic-letter/2020/september/did-600-dollar-unemployment-supplement-discourage-work/.
17. Jeehoon Han, Bruce D. Meyer, and James X. Sullivan, “Income and poverty in the COVID-19 pandemic,” Brookings Papers on Economic Activity, Conference Drafts, June 25, 2020, https://www.brookings.edu/wp-content/uploads/2020/06/Han-et-al-conference-draft.pdf.
18. “Monetary Policy Report—June 2020,” Board of Governors of the Federal Reserve System, 2020, https://www.federalreserve.gov/monetarypolicy/2020-06-mpr-summary.htm.
19. “Federal Reserve Act,” Board of Governors of the Federal Reserve System,
https://www.federalreserve.gov/aboutthefed/fract.htm.
20. Aaron Steelman, “The Federal Reserve’s “Dual Mandate”: The Evolution of an Idea,” Federal Reserve Bank of Richmond, Economic Brief, December 2011, 11-12, https://www.richmondfed.org/publications/research/economic_brief/2011/eb_11-12.
21. “Federal Reserve: Emergency Lending,” Congressional Research Service Report, March 27, 2020, https://fas.org/sgp/crs/misc/R44185.pdf.
22. “Financial Stability Report—May 2020,” Board of Governors of the Federal Reserve System, 2020, https://www.federalreserve.gov/publications/2020-may-financial-stability-report-purpose.htm.
This material may be quoted or reproduced without prior permission, provided appropriate credit is given to the author and Rice University’s Baker Institute for Public Policy. The views expressed herein are those of the individual author(s), and do not necessarily represent the views of Rice University’s Baker Institute for Public Policy.


