
Author(s)

Beginning in March 2020, the United States and Mexico began dealing with a surge of COVID-19 cases. Since then, the virus has proven to be a difficult challenge for both countries, largely due to its contagious and unpredictable nature. Some individuals infected with the virus have no symptoms but can still infect other people. Others experience numerous symptoms, including a fever, body aches, a dry cough, a sore throat, the loss of appetite, and the loss of smell.1 In other cases, the virus causes severe symptoms and can turn into pneumonia, leaving the infected individual with neurological problems and/or gastrointestinal problems. In the worst of cases, the virus proves to be fatal. The shared borderlands between the United States and Mexico have been hit hard by COVID-19. The pandemic has, in fact, radically changed life on the borderlands. Most “borderlanders” have had to dramatically adjust their daily routines in response to authorities’ efforts to contain the spread of the virus. This has included limiting cross-border mobility extensively.
On March 21, 2020, the United States and Mexico agreed to restrict non-essential travel over the border. These restrictions were meant to be temporary but have been extended every month and will likely remain in effect until at least the spring of 2021. Because the border economy is heavily dependent on cross-border trade and consumption, the economic impact of reduced cross-border mobility cannot be underestimated. In effect, the restrictions have already had significant effects on the economies of counties situated on the U.S.-Mexico border. Many of these border counties depend on tourists, who spend their money buying goods and services, staying at hotels, going across the border for entertainment, and eating at restaurants.
In this issue brief, I analyze the impact of these travel restrictions on the tourism industry of U.S. border counties, as many of them depend on Mexicans entering the U.S. and spending billions of dollars each year. Specifically, I focus on counties in Texas that have a port of entry with Mexico and estimate the economic impact of the restrictions in these areas from March 21 to November 21 (eight months).
COVID-19 and Border Crossing
COVID-19 containment measures have had extensive negative impacts on economies around the globe, including unprecedented declines in demand and mass layoffs. Many countries entirely halted their economies to prevent the spread of the virus. In these cases, businesses across all sectors had to close, causing many people to lose their jobs and sources of income.
Figure 1 — Unemployment Claims as a Share of Sector Employment in Texas
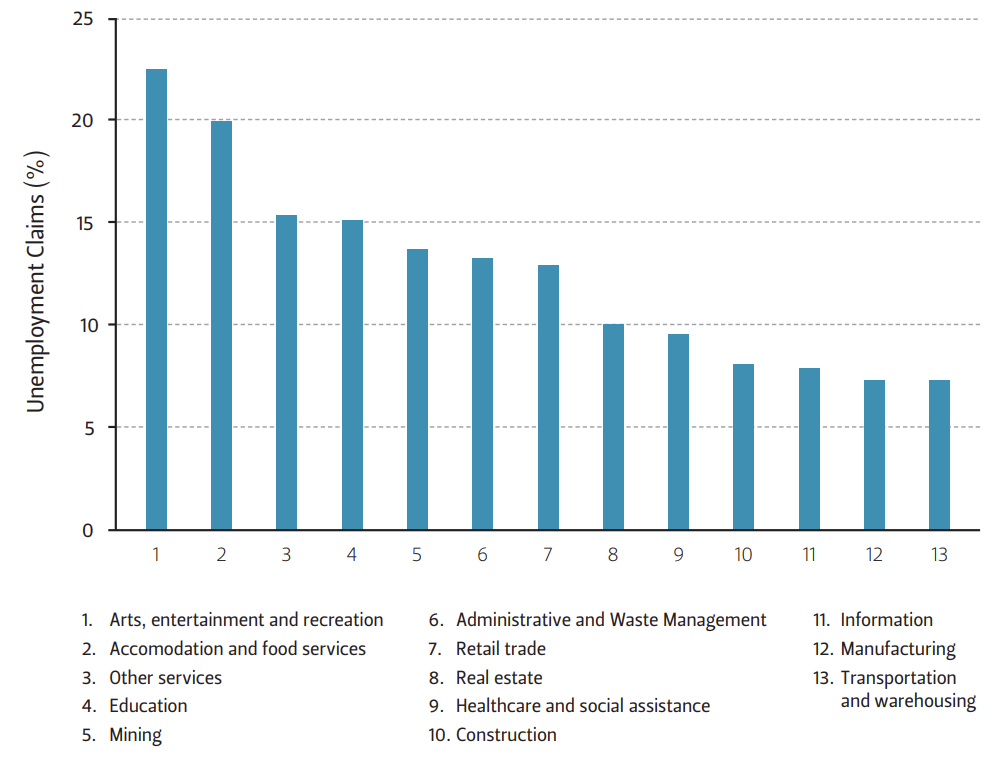
Source Federal Reserve Bank of Dallas, https://www.dallasfed.org/research/economics/2020/0507.
In Texas, the containment measures have most severely impacted the service sector, putting downward pressure on wages and prices. Other sectors that have been affected include arts and recreation, hospitality (e.g., restaurant workers, hotel employees, etc.), retail, and health care (Figure 1). A record of more than 3.6 million Texans have filed for unemployment insurance from mid-March through midOctober.2 The outlook for job growth in Texas at the end of 2020 is expected to be down by approximately 622,600 jobs (-4.8%) compared to 2019 numbers.3 Further, the Texas economy had its first contraction since 2009 due to the pandemic and the downturn in the oil industry caused by overcapacity and the global oil price war in March 2020. Overall economic activity in Texas started to improve in May and June, but the resurgence of COVID-19 in July and October reversed the economic gains from those months.4 Along the Texas-Mexico border, economic activity has also remained stunted due to restrictions aimed at containing the spread of the virus.
Figure 2 — Pedestrian Crossings (Index 2000 = 100)
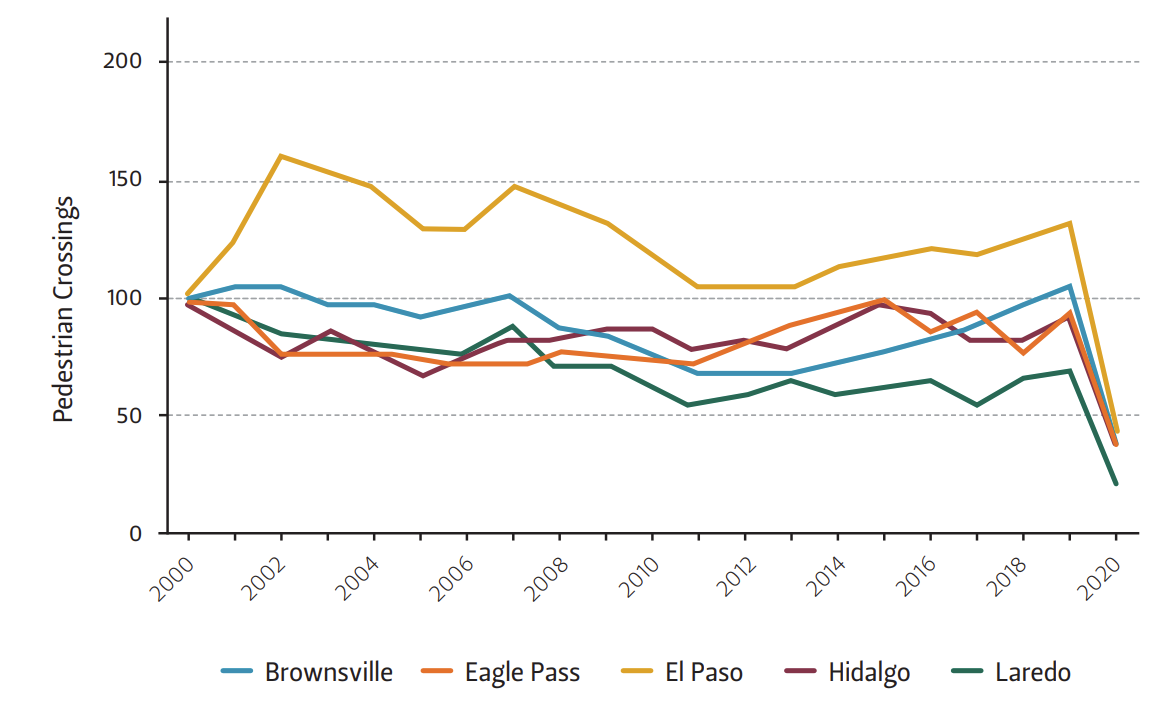
Source U.S. Bureau of Transportation Statistics.
Related to these trends, border-crossing data during the pandemic shows levels well below normal. Traffic at the border ports of entry stopped in March, and while activity began to increase in May, it remains low (Figures 2 and 3).
The limited traffic along the Texas-Mexico border is having major impacts on retail sales in the border region. Mexican nationals are a vital part of the economies along the border due to their robust purchases of goods and services at the retail level—not only by those who live along the border, but also by Mexicans coming from interior cities, such as Chihuahua, Monterrey, Torreón, and many others. The fact that they cannot cross the border has curtailed retail sales. In this brief, I estimate that Texas’ slowdown in the service industry, as well as in the retail sector, is due, in part, to the restrictions on cross-border mobility.
Figure 3 — Personal Vehicle Crossings (Index 2000 = 100)
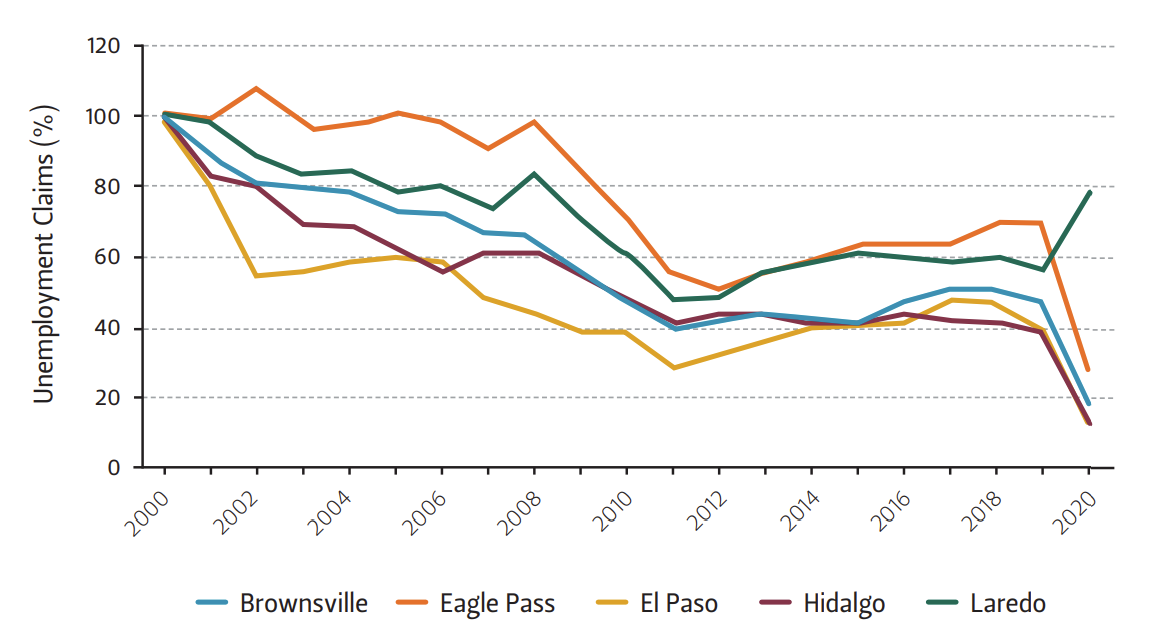
Source U.S. Bureau of Transportation Statistics.
The Bureau of Transportation Statistics (BTS) provides border crossing data for the U.S.-Mexico border. The data provides the number of passengers in personal vehicles, trucks, trains, and busses, as well as pedestrians entering the United States. This data is collected at ports of entry by the U.S. Customs and Border Protection. Using BTS data, the number of passengers and pedestrians crossing at the Texas-Mexico border in 2019 is compared to data from April to September 2020.5 This information provides a glimpse of the scale of the reduction in tourism since the border was partially closed due to the pandemic.
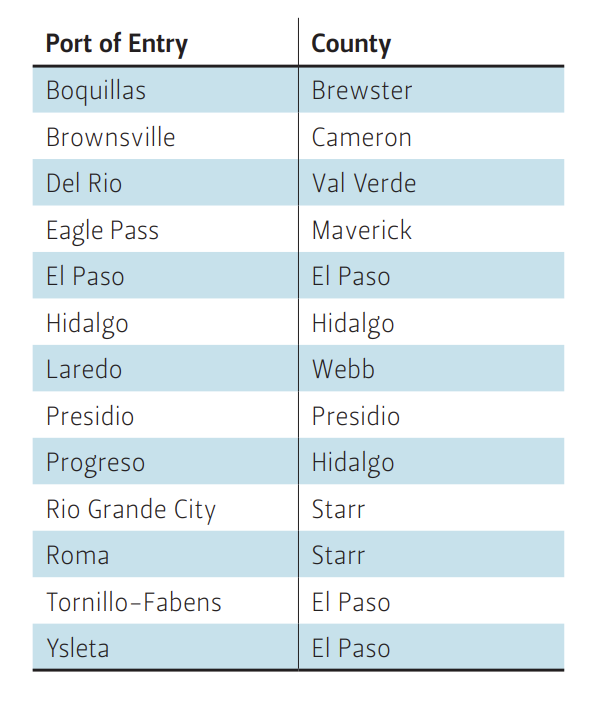
There are 13 ports of entry on the Texas-Mexico border corresponding to nine counties (Table 1). Given the information from the BTS for these ports of entry, on average there was a reduction in border-crossing passengers and pedestrians of approximately 62% from April to September 2020 compared to 2019 (Figure 4). This percentage represents a good estimate of the reduction of Mexican tourists on the Texas-Mexico border, resulting from the ban on non-essential travel. Specifically, this has a major impact on the retail sector in these counties. Many Mexican nationals cross the Texas-Mexico border on a tourist visa to buy goods and services or even to buy lunch, and all of these counties are losing out on those retail sales.
Figure 4 — Pedestrian and Passenger Crossings
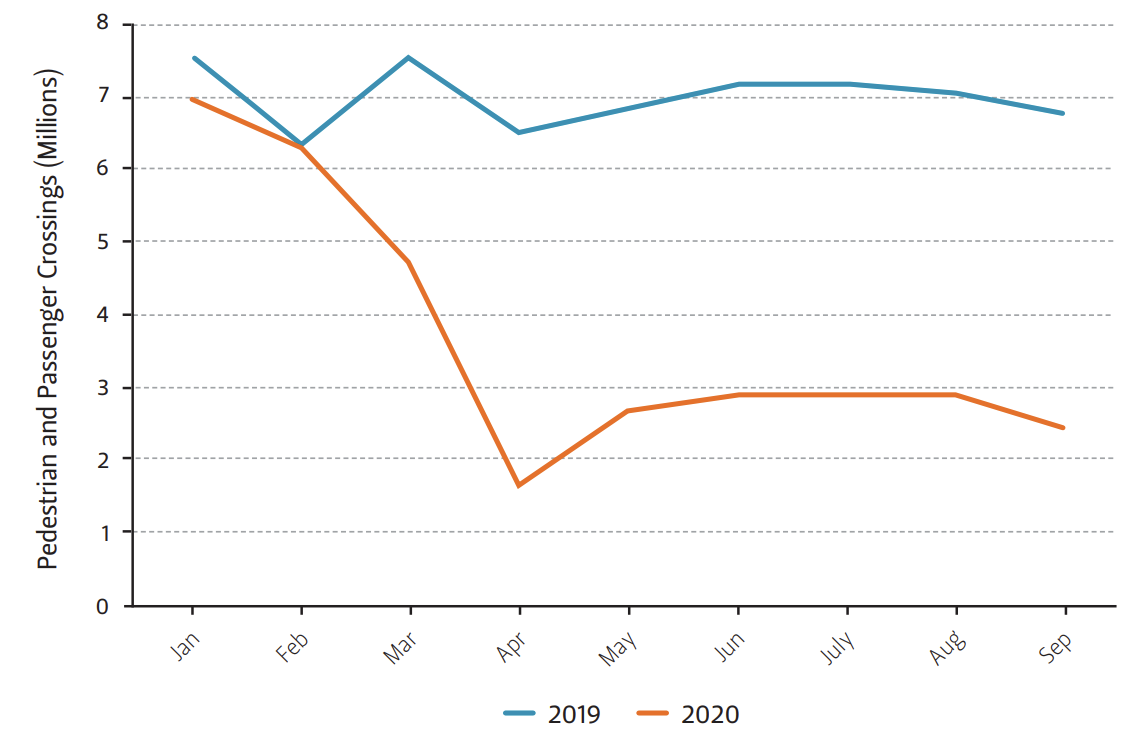
Table 1 — Ports of Entry and County
Retail Sales and Mexican Tourism on the Texas-Mexico Border
Along the Texas-Mexico border, more than 230,000 people cross the ports of entry into the United States every day to work, study, shop, vacation, or dine at local restaurants. This figure represents 45% of all people who cross the U.S.-Mexico border. Most of these people are Mexicans, who represent a major source of business for the counties on the border of Texas.
Mexicans not only shop at stores in these border communities, they also serve as an export industry for these counties. This retail export industry is important to the economies of these border regions, as it allows businesses to thrive and provides employment for many workers.
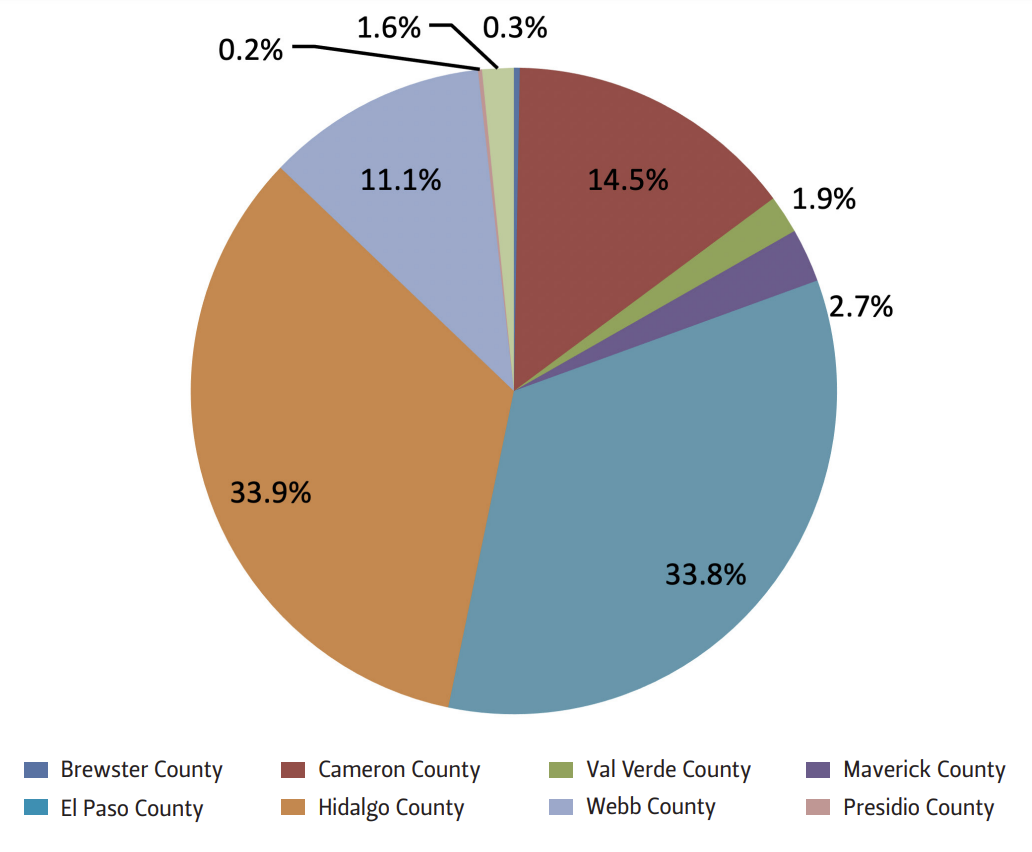
Retail stores in the Texas border counties know the importance of the potential market they have on the Mexican side of the border. This retail trade represents a significant part of the economy of these border counties. The distribution of the total retail sales in the nine counties on the border shows that Cameron County, El Paso County, Hidalgo County, and Webb County had the most retail sales in 2019 (Figure 5). This distribution is almost unchanged since 2002, with only Hidalgo County seeing a 4% increase in 2019.
Figure 5 — Nominal Retail Sales, 2019
Source Texas Comptroller of Public Accounts.
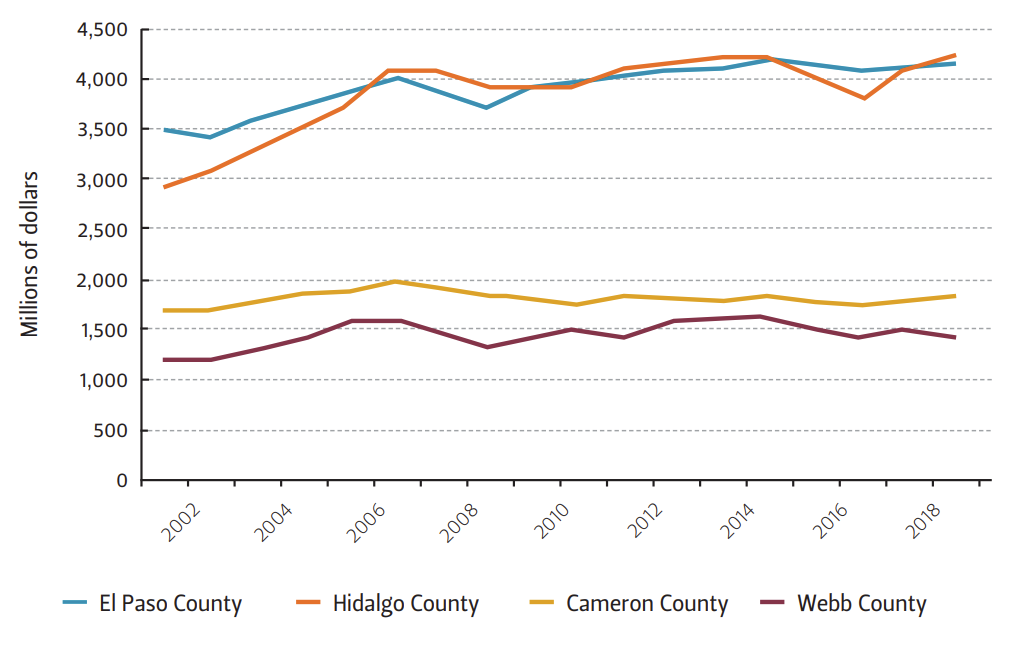
Retail sales for all nine counties show growth from 2002 to 2019. Over the past five years, retail sales of almost all of these counties have remained nearly constant. Figure 6 shows the real retail sales for the top four counties along the Texas-Mexico border. The real growth rate of retail sales from 2002 to 2019 for El Paso County was 21%, and for Hidalgo County was 43%. A percentage of these retail sales correspond to Mexican nationals who have been affected by the non-essential travel restrictions.
Figure 6 — Real Retail Sales, 2002–2019 (2015 = 100)
Texas is one of the largest generators of tourism in the United States, and the Texas economy benefits significantly from tourism revenue. Texas generated an estimated $83 billion in 2019 through direct travel spending, which generated indirect and induced effects in other sectors for a total economic impact of $169 billion.6 The tourism industry also fosters job creation. In 2019, it supported 1.3 million jobs in Texas (almost one of every 10 jobs), and employment grew by 2.9%.7
The counties on the Texas-Mexico border support the tourism sector of Texas and its economy through Mexican tourists. The nine counties analyzed in this paper are distributed in the following tourist regions: Big Bend, South Texas Plain, and the Gulf Coast. The Big Bend tourism region generated $3.9 billion in direct travel spending in Texas, and its share of employment in the region was 3.5% in 2018.8 The South Texas Plain tourism region generated $11.4 billion in direct travel spending, and its share of employment in the region was 5.2% in 2018.9 The Gulf Coast tourism region produced a direct travel spending of $21.3 billion, and its share of employment in the regions was 3.7% in 2018.10
Mexico is the largest source of international visitors to Texas and its border counties. They arrive mainly by car to visit Texas.11 Due to the pandemic, restrictions on non-essential travel over the U.S.-Mexico border were imposed and affected Mexican tourists planning to enter the United States. Because of this, the economies of the border counties in Texas have been affected, as Mexican tourists have not been purchasing goods and services in those counties since the end of March, meaning that the retail and hospitality sectors are likely the most affected by this prohibition. To calculate these impacts on the border counties, I estimate the total amount of retail spending by Mexican nationals that is exported to Mexico. Then, I use the reduction in tourists in border counties who crossed at ports of entry to the United States (62%). Applying this figure to the total amount of retail spending by Mexican nationals provides the total amount that counties are losing due to the non-essential travel restrictions. In the next section, I estimate the amount that Mexican nationals export from the retail sector.
Texas Border Gains From Retail Sales to Mexican Nationals
Mexican nationals cross the border to purchase goods and services every day, supporting the retail sector of Texas border counties. To estimate the share of retail spending by Mexican nationals, I follow the methodology of Phillips and Manzanares to estimate net exported retail sales in 2019 for the nine border counties that have a port of entry in Texas.12 Their model assumes that individuals spend a fixed proportion of their income on retail sales.13 Phillips and Coronado refine this methodology by decomposing personal income, but both models produce reasonable results.14
Phillips and Manzanares first calculate retail sales as a fraction of personal income in Texas. Then, for each location, they multiply this figure by the total personal income to obtain an estimate of retail sales bought by the local population. Finally, they subtract local sales from total sales to estimate net exported retail sales.
Using information from the Texas Comptroller of Public Accounts and the Federal Reserve Bank of St. Louis, I estimate that retail sales as a fraction of personal income in Texas were 34.6% in 2019. For each of the border counties with a port of entry, I multiply this percentage by their total personal income and obtain the retail sales purchased by the local population. Then, I subtract this latter amount from the total retail sales to get the net exported retail sales by Mexican shoppers. If the value of net exported retail sales is negative, that implies local shoppers spend more outside their local economy than non-local shoppers. I found that the net exported retail sales were $4.8 billion in 2019. This figure represents approximately 0.92% of Texas’ overall retail sales.
In 2019, Hidalgo County was the largest net exporter of retail sales, totaling almost $3.1 billion. That represented 28.1% of its total retail sales. Webb County followed with $579 million in exported retail sales, representing 16.1% of total retail sales. El Paso County came in third, exporting $552 million to Mexican shoppers and representing 5%. Cameron County registered $506 million or 16% of total retail sales.
Using the net exporter of retail sales and the percentage of reduced tourism obtained above, I can estimate the total impact of the non-essential travel restriction in the border counties of Texas due to the pandemic.
Multiplying the reduction of Mexican tourists (62%) by the net exporter retail sales ($4.8 billion) and adjusting to the 8-month travel restriction, I estimate that the reduction in retail sales for the border counties is around $1.9 billion.15
Impact of the Reduction of Mexican Shopping on the Texas-Mexico Border
To analyze the economic impact of the reduction of Mexican shopping on the Texas-Mexico border, an IMPLAN model is used. IMPLAN helps analyze economic impacts of specific policies or a change in a specific economy. It utilizes a top-down approach that incorporates different national databases such as the U.S. Census Bureau and the U.S. Bureau of Economic Analysis. This model allows for identifying direct, indirect, and induced economic effects in various sectors after the change or policy is included. Direct effects refer to the initial changes in affected industries— in this case, the retail sector due to the reduction of Mexican tourism ad shopping. Then, the multipliers estimate the changes in related economic sectors that will also be affected by the reduction of tourists, generating the indirect effects. The change in employment levels due to direct and indirect effects will impact household incomes in the border counties of Texas, and this is known as induced effects. The sum of these three types of effects represents the total impact on the counties along the Texas-Mexico border of the restrictions on non-essential travel.
Using IMPLAN, the impacts of this travel restriction on the gross domestic product (GDP) of the nine border counties and on the taxes collected by the state of Texas are examined. The percentage of net exporter retail sales, with respect to total retail sales by county, and the reduction of Mexican tourists on the Texas-Mexico border, are applied in IMPLAN. Based on these calculations, Texas border counties will lose more than $686 million in direct employment compensation, defined as pre-tax salary and wage earnings. The total lost will be $1.02 billion during the eight months of the travel restrictions (Table 2).
Table 2 — Economic Impacts of Non-essential Travel Restrictions
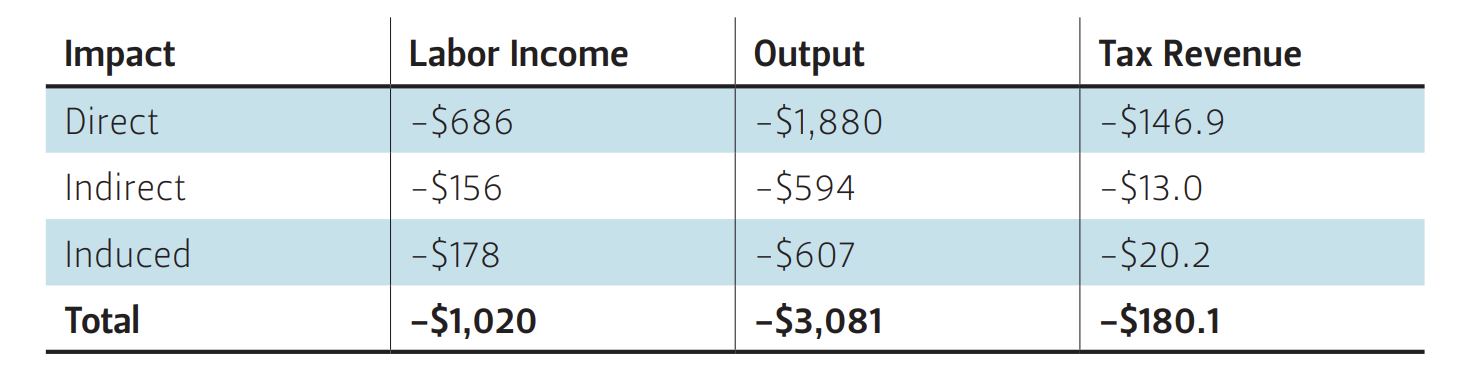
The reduction of Mexican shopping in border counties directly affects the local economies, since there is a decrease in labor, income, and demand for goods and services. Therefore, the GDP of the border counties will diminish by more than $1.9 billion, and the tax revenue collected by the state of Texas will decrease by more than $146.9 million. The total decrease in the GDP and tax revenue will be approximately $3.1 billion (3.8% of their total GDP) and $180.1 million (0.30% of state tax revenue), respectively (Table 2).
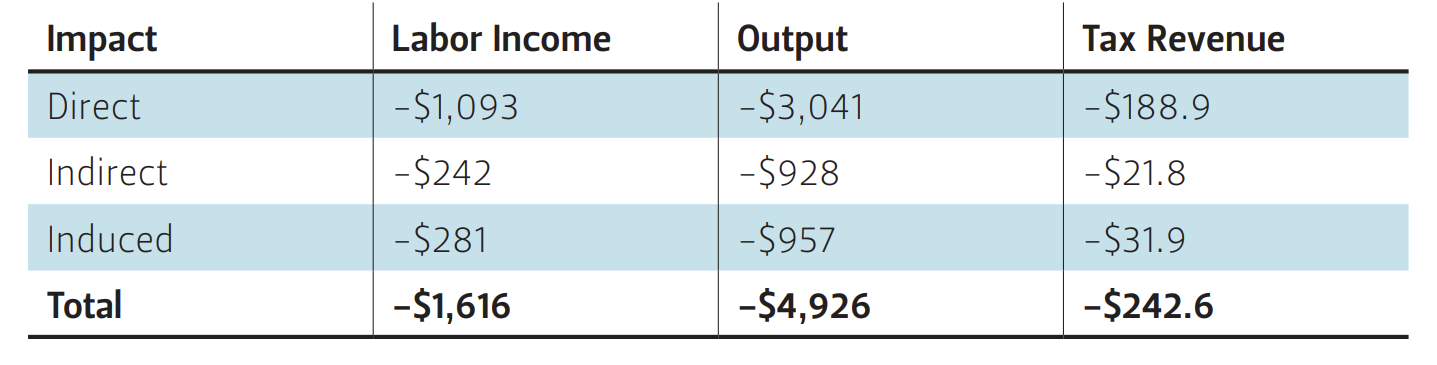
Assuming the impact on the retail sector is the same as in the hospitality sector (restaurants and hotels), the impact on the hospitality sector can be added to the retail sector to further show how the economies of the border counties will be affected. The border counties will lose around $3.0 billion in direct GDP and $4.9 billion in total GDP (6.1% of their total GDP). Regarding direct employment compensation, Texas border counties will lose more than $1.1 billion, and the total lost will be $1.6 billion during the eight months of the travel restrictions. Finally, the tax revenue collected by the state will directly diminish by more than $188.9 million with a total decrease of $242.6 million (0.41% of state tax revenue) (Table 3).
Table 3 — Economic Impacts of Non-essential Travel Restrictions
Conclusion
The pandemic has undoubtedly created a public health crisis of an enormous scale. Beyond the impact on health, its effects have extended into the economies of countries around the world, and the economies of border counties in Texas are no exception. The retail and hospitality sectors have been hit hard by the current ban on non-essential travel meant to contain the spread of the virus. This restriction has meant losses for these counties, as Mexican tourists and shoppers are unable to cross the border to buy goods and services. Mexican tourists and shoppers are a key component of these economies, and without them, the losses are likely to be unprecedented, causing an estimated reduction of nearly $4.9 billion in the GDP of these border counties (representing 6.1% of their total GDP).
The retail sector could experience economic losses exceeding $2.0 billion during the eight months of restricted travel. This has put immense pressure on retail stores on the border, causing many of them to go out of business already. Finally, the purchase of goods and services generates revenue for the state of Texas through taxes. But with retail sales plummeting, the state will likely lose around $242.6 million in tax revenue. In sum, it seems that “nonessential” Mexican travelers are, in fact, essential to the border counties of Texas.
Endnotes
1. “COVID-19 Basics,” Harvard Medical School, March 2020, https://www.health.harvard.edu/diseases-and-conditions/covid-19-basics.
2. United States Department of Labor, “Office of Unemployment Insurance,” (as of August 22, 2020) https://oui.doleta.gov/unemploy/claims_arch.asp.
3. Christopher Slijk and Keighton Hines, “Texas Economy’s Rebound Stalls in July after Gains in May, June,” Federal Reserve Bank of Dallas, August 6, 2020, https://www.dallasfed.org/research/economics/2020/0806.
4. Ibid.
5. The most recent data is up to September 2020. See “Border Crossing Entry Data”: https://explore.dot.gov/views/BorderCrossingData/Monthly?:isGuestRedirectFromVizportal=y&:embed=y.
6. Travel Texas, “2019 Economic Impact,” October 2020, https://gov.texas.gov/uploads/files/travel-texas/2019EconomicImpact.pdf.
7. Ibid.
8. Travel Texas, “Big Bend Region,” August 2019.
9. Travel Texas, “South Texas Plains Region,” August 2019.
10. Travel Texas, “Gulf Coast Region,” August 2019.
11. Travel Texas, “FY19 Marketing Plan,” https://gov.texas.gov/uploads/files/travel-texas/Marketing-Plan_2019_edit.pdf.
12. Keith Phillips and Roberto Coronado, “Texas Border Benefits from Retail Sales to Mexican Nationals,” Federal Reserve Bank of Dallas, October 2005, https://www.dallasfed.org/~/media/documents/research/pubs/fotexas/fotexasphillips.pdf.
13. Along the Texas-Mexico border, retail goods are purchased not only by local citizens in the United States, but also by Mexican nationals. Phillips and Coronado discuss other ways to calculate the net exported retail sales and conclude that their simple approach produces consistent results for these sales at the border.
14. Ibid.
15. I assume that from October to November the reduction of border crossing passengers and pedestrians will be almost the same as it was for the period of April to September. Hence, the 62% reduction in tourists during the 8-month period is maintained.
This material may be quoted or reproduced without prior permission, provided appropriate credit is given to the author and Rice University’s Baker Institute for Public Policy. The views expressed herein are those of the individual author(s), and do not necessarily represent the views of Rice University’s Baker Institute for Public Policy.


