
In recent years, several changes in the economic environment have influenced domestic migration decisions within the United States. State tax policy is often credited for prompting a recent increase in relocation, particularly since the limitation of the state and local tax (SALT) deduction starting in 2018.1 Other factors related to the COVID-19 pandemic, including the shift to remote work, also influenced and likely expedited migration decisions, raising the stakes of tax policy at both the state and federal levels.
This issue brief explores the relationship between state income taxation and migration patterns across states over the last decade. Studying that time period highlights how cross-state migration was affected by the 2017 tax reform, commonly known as the Tax Cuts and Jobs Act (TCJA), and the COVID-19 pandemic. These factors also increased the incentives to implement state-level tax reforms. As a result, this issue brief considers how state fiscal policy has responded in recent years.
State Income Taxes and Migration
IRS data offers a unique opportunity to gain insights into taxpayer migration and other taxpayer characteristics. The data reflects the underlying population of federal taxpayers— i.e., the population of interest when studying the implications of federal tax reform. Specifically, using the data from tax returns, the IRS tracks changes in state residencies from year to year, as well as taxpayers’ corresponding adjusted gross income (AGI). This migration data can be compared to state tax rates to study the relationship between state fiscal policy and geographic mobility over time.
In each year, states experience both inflows and outflows of migrants. Inflows minus outflows provides a measure of net migration, and dividing net migration by the remaining population yields the net migration rate. An analogous measure can also be created for total AGI flows to understand how earnings potential flows across states.
Of particular interest is whether net migration and AGI flows are related to a state’s income tax.2 Figure 1 shows the relationship between migration and the state’s top marginal individual income tax rate, with each point representing a different state and the District of Columbia in 2019.3 That year was chosen for illustration because it is two years after the SALT cap went into effect, giving time for the federal tax reform to affect migration decisions without being influenced by other factors corresponding to the COVID-19 pandemic in 2020. The top graph in Figure 1 shows that higher top marginal individual income tax rates are associated with lower net taxpayer migration rates. Specifically, the estimates suggest that a 1 percentage point increase in the top marginal income tax rate is associated with a reduction in net migration by 6.1 federal taxpayers per 10,000.4 To put this into perspective, levying California’s top marginal tax rate of 13.3% (relative to no income tax) would be associated with a loss of 8.2 taxpayers per one thousand. If economic growth is roughly proportional to the population of taxpayers, it would imply a loss of nearly 1 percentage point of growth annually. Studying AGI flows, however, suggests that the economic losses could be more severe. The estimates indicate that a 1 percentage point increase in the top marginal tax rate is associated with a reduction in net AGI flows of around $11.54 for every $10,000 of AGI in the state. For California, this suggests an annual loss of 1.5% of AGI, relative to a tax structure with no income tax. These observations are consistent with conjectures stipulating that higher-income earners have the most to gain from moving to lower-taxing jurisdictions.
Figure 1 — State Top Marginal Personal Tax Rate and Net Migration Rate (TOP), Net AGI Flow Rate (Bottom)
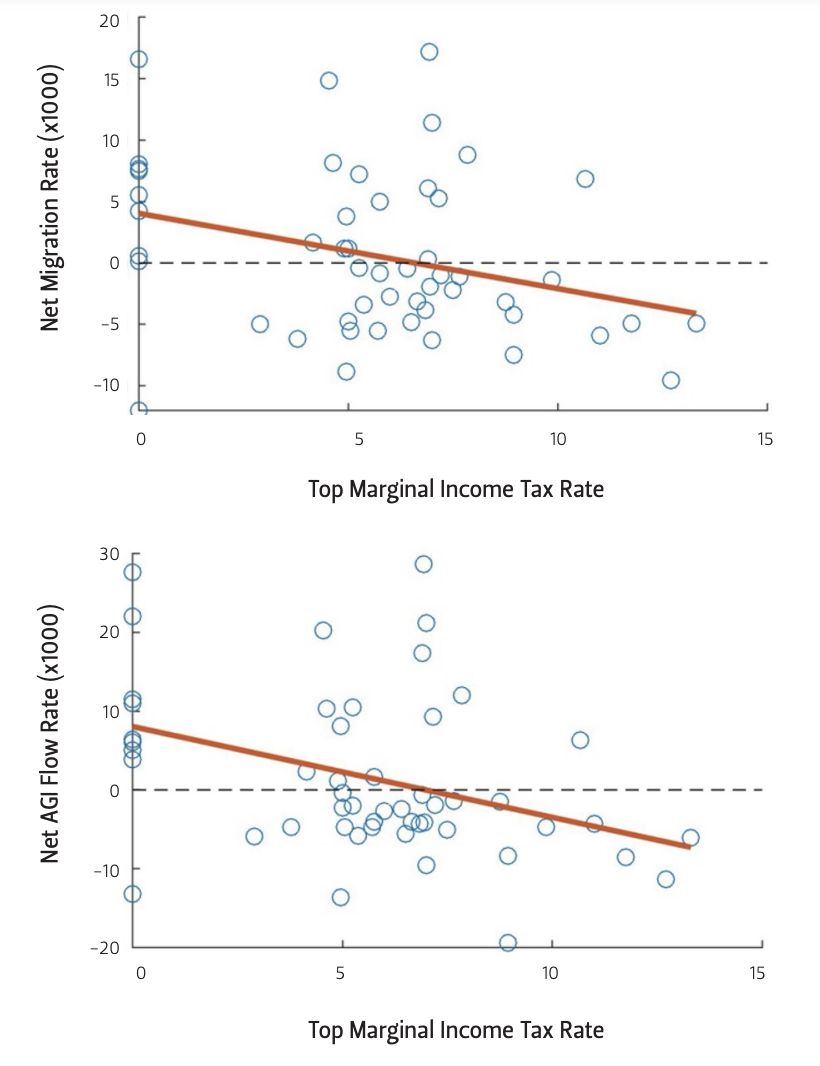
As of 2019, nine states did not levy an income tax on earnings: Alaska, Florida, Nevada, New Hampshire, South Dakota, Tennessee, Texas, Washington, and Wyoming.5 With the exception of Alaska, each of these states had positive net migration rates. Conversely, the four states with the highest top marginal tax rates—Hawaii, New Jersey, California, and New York—each had net losses in taxpayer migration and AGI.
With regards to tax policy and mobility, many things have changed over the last decade. The limitation of the SALT deduction clearly changed the migratory calculus for many U.S. households after 2017. The surge in remote work availability during the COVID-19 pandemic also generally increased mobility, further enhancing the incentives to move to low-taxing jurisdictions. It makes sense, then, to study how the relationship between the top marginal tax rate and migration has changed over time. Figure 2 shows this value by reporting the slope of the regression line, as estimated in Figure 1, for every year between 2010 and 2020 (post-TCJA shaded in gray). In other words, the figure shows how the association between migration/AGI and state income taxation changed over that decade.
The results presented in Figure 2 highlight shifts in migration following the passage of the TCJA. In the years leading up to the TCJA, the association between net migration/AGI and state income tax rates had mostly stabilized. Then, in the first two years after the passage of the TCJA, the amount of net migration and AGI loss associated with higher income taxes began to rise—i.e., the slope of each became more negative. Specifically, between 2017 and 2019, the association of a 1 percentage point increase in the top marginal tax rate with net migration losses rose from 3.0 to 6.1 taxpayers per 10,000—more than double the estimated value. For AGI, the value rose from $8.28 per $10,000 in 2017 to $11.54 per $10,000 in 2019. In 2020, these relationships steepened sharply. The association in that year grew to 8.1 taxpayers per 10,000 for net migration and $18.24 per $10,000 for AGI, indicating a surge in migration and resources from high income tax states to low income tax states.
Figure 2 — Slope of the Relationship Between the Top Marginal Tax Rate and Migration, by Year
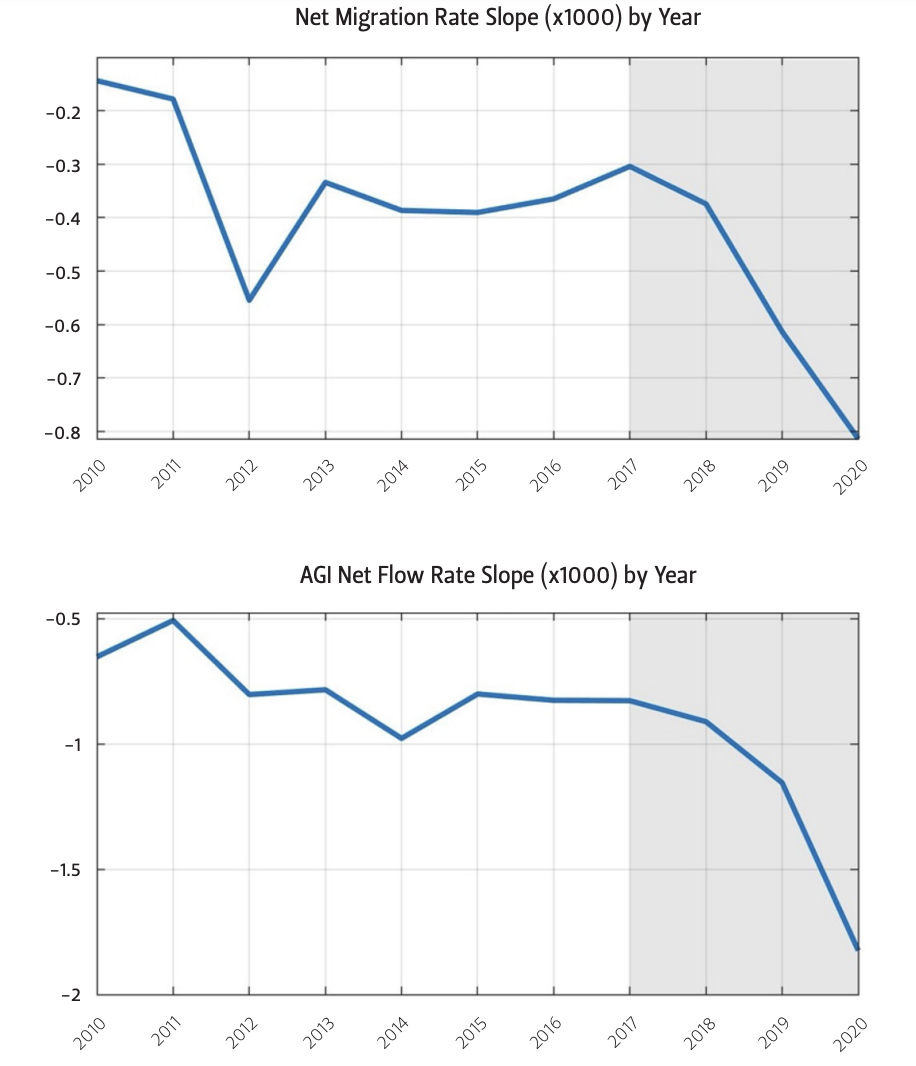
Note Numerical results provided in the appendix.
The Role of the SALT Cap
Before the passage of the TCJA, federal taxpayers could deduct property taxes and the greater of income or sales taxes paid to state and local governments. The TCJA, however, capped this deduction at $10,000 and expanded the standard deduction, significantly reducing both the magnitude of deductions taken and the number of taxpayers claiming the deduction. These reforms largely nullified the SALT deduction’s dampening effect on state and local taxation, thereby reducing the value of residency in high-tax jurisdictions.
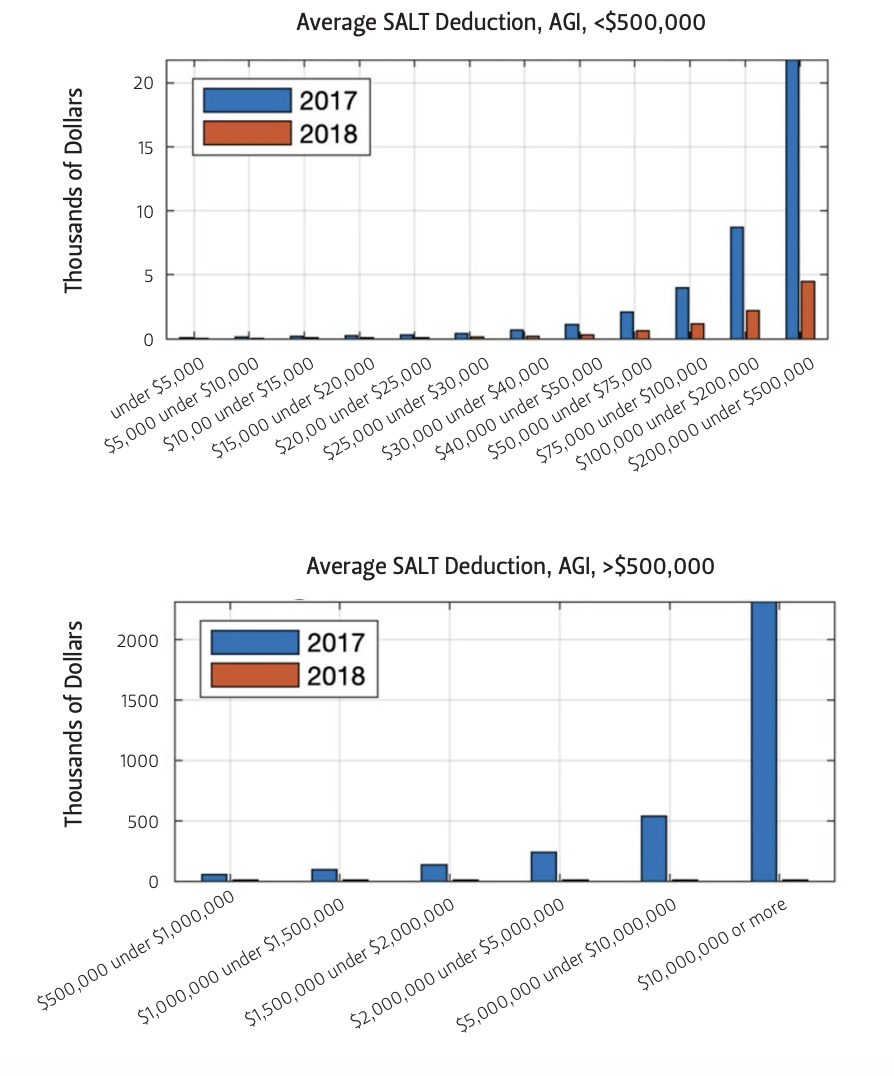
Understanding the economic effects of the SALT deduction requires consideration of the financial impact of the SALT cap on taxpayers. Figure 3 shows the average SALT deduction by AGI in the last year before the TCJA went into effect (2017) and the first year after (2018). The results highlight the regressive nature of the unfettered SALT deduction and the limiting impact of the cap instituted in the TCJA. The regressivity of the SALT deduction indicates that high-income taxpayers in high-tax states would be those most impacted by changes in the availability of the deduction. As a result, the mobility decisions of these high-income taxpayers are more sensitive to the implementation of the SALT cap.
Figure 3 — SALT Deduction by AGI: 2017 vs. 2018
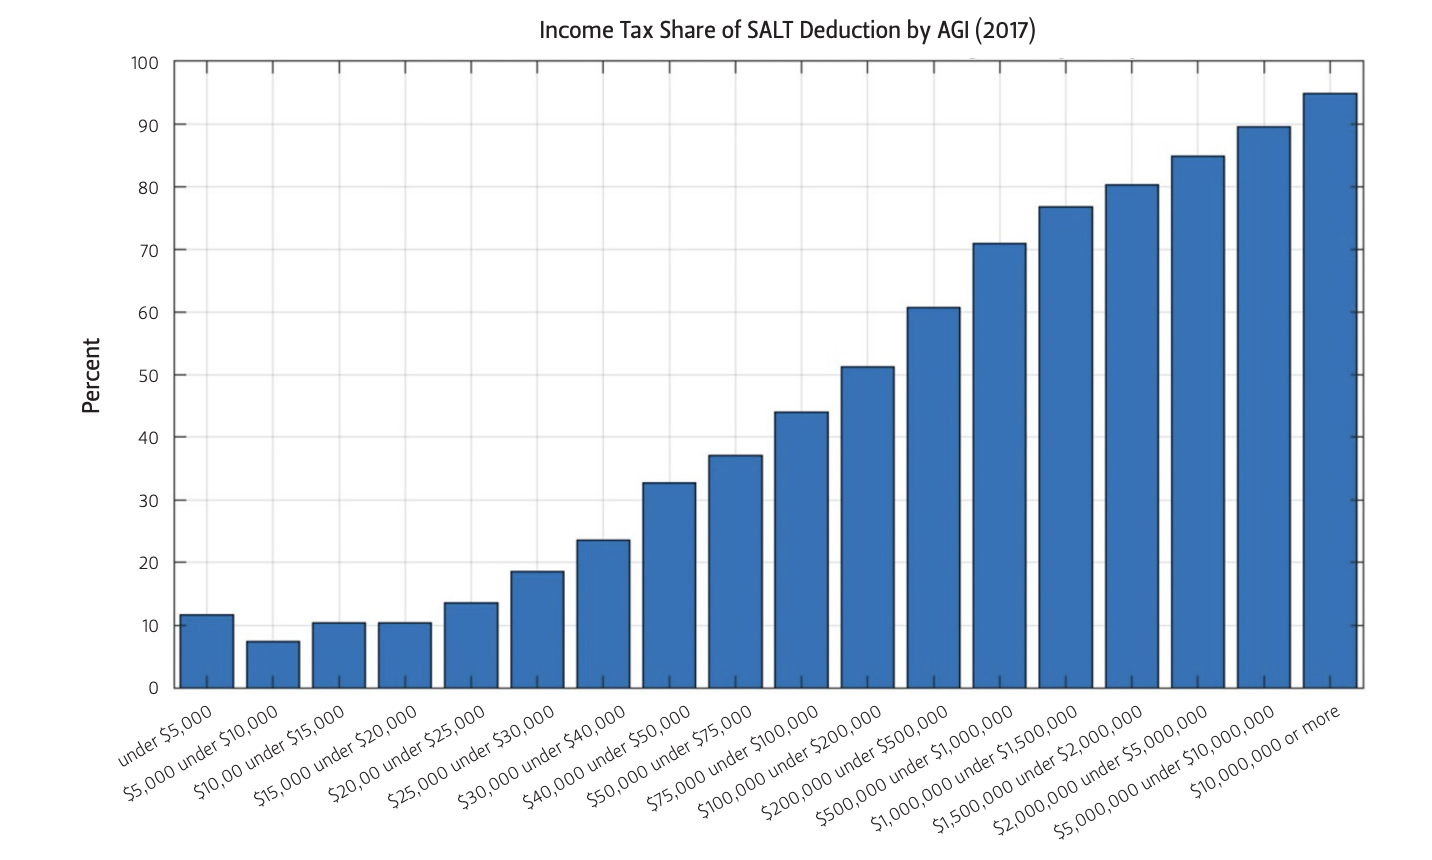
The SALT deduction includes state and local property taxes and the greater of income or sales taxes. Figure 4, however, shows why states with high income taxes were particularly affected by the SALT cap. As income increases, the share of state income taxes comprising the SALT deduction (by 2017 standards) increases dramatically.6 For taxpayers in the highest AGI group, state income taxes comprised almost the entirety of the SALT deduction. This result highlights the increased incentives of high-income taxpayers to relocate to jurisdictions with lower income taxes after the SALT cap went into effect.
State Fiscal Responses
In response to the heightened costs of levying state and local taxes—particularly income taxes, several states have reformed their tax structures. In 2021 alone, 10 states reduced their individual income tax rates with nine of them reducing the top marginal tax rates.7 This trend has continued well into 2022, with several states currently considering major income tax reforms, including flattening the income tax or eliminating it altogether.8 Of course, income taxes are only one component of most states’ revenue sources, and reforms to other taxes, including excise, sales, and property taxes, are under consideration.
While policy changes like the limitation of the SALT deduction played a role in motivating these tax reforms, states likely responded for other reasons as well. One major motivating factor, compounded by the SALT cap, has been the growth of remote work in the aftermath of the COVID-19 pandemic. This sharp transition created the opportunity for several households to move to new locations with many choosing to live in lower-taxing jurisdictions.9 Another factor motivating competitive tax reforms has been the recent surge in state revenues. Several states significantly outperformed pre-pandemic tax revenue growth, providing state governments with abundant resources.10 Many states have chosen to offset these robust budgets with tax reductions.11
Figure 4 — Percent Contribution of State and Local Income Taxes to the Total SALT Deduction by AGI in 2017
Conclusion
Lower state income taxation is shown to be associated with higher net taxpayer migration—a relationship that grows stronger with income. Since the passage of the 2017 tax reform, which increased the costs associated with state and local taxation by limiting the SALT deduction, taxpayers and earnings potential have both migrated to lower-taxing states at a faster rate. The corresponding fiscal competition coupled with state budget surpluses has motivated several states to reduce taxes— particularly income taxes.
Although lower state income taxation is associated with heightened migration rates, this relationship could be driven by other factors correlated with state fiscal policies. This was particularly true in the late stages of the pandemic, when several states diverged in COVID-19 mitigation efforts, such as vaccine mandates. For example, of the nine states that do not levy an income tax, eight of them (with the exception of Washington) did not implement a state vaccine mandate on businesses, and several even passed legislation prohibiting localities and businesses from mandating vaccines.12 Conversely, of the four states that levied the highest state income taxes, only Hawaii did not implement a state vaccine mandate on businesses. This example highlights the possibility that state-level responses to the pandemic could be correlated with state fiscal policies in a way that influenced migration decisions.
The relationship between state income taxation and migration was shown to strengthen after the implementation of the SALT cap. As a result, some might infer that the SALT cap caused harm to high-tax states, disproportionately affecting them relative to other states. The corollary to this claim, however, is that the unfettered SALT deduction only existed to benefit high-tax states. As the SALT deduction debate grows in the coming years with new proposals and the pending expiration of the corresponding TCJA provisions in 2025, researchers will have to determine whether the pre-TCJA fiscal environment ever offered a proper base scenario, or whether a fiscal environment without any SALT deduction is the natural base case. By choosing the latter, the results of this study could be interpreted as the U.S. fiscal system’s natural environment, whereby the benefits of implementing state and local taxes are properly paired with the costs. From that perspective, any increase in the SALT cap would affect state tax consequences in a way that would likely distort migration rates in favor of high-tax states. Consequently, policymakers must consider how future reforms to the SALT deduction may distort domestic migration rates.
Endnotes
1. The Editorial Board, “The Great Pandemic Wealth Migration,” Wall Street Journal, June 3, 2022, https://www.wsj.com/articles/irs-taxeslow-high-state-migration-movingpandemic-remote-work-cost-ofliving-11654289927.
2. Although different measures of state taxation could have been chosen for comparison, the next section explains why state income taxation is particularly consequential.
3. The source data for individual income tax rates makes certain adjustments to reflect the top effective, rather than statutory, tax rate.
4. Regression estimates corresponding to Figure 1 and Figure 2 are provided in the appendix.
5. Certain exceptions apply.
6. This likely also reflects the concentration of high-income earners in states, like California and New York, that levy high income taxes.
7. Katherine Loughead and Jared Walczak, “States Respond to Strong Fiscal Health with Income Tax Reforms,” Tax Foundation, July 15, 2021, https://taxfoundation.org/2021-stateincome-tax-cuts/.
8. Jared Walczak and Katherine Loughead, “State Legislatures Take Up Tax Reform and Relief in 2022,” Tax Foundation, March 29, 2022, https://taxfoundation. org/2022-state-tax-reform/.
9. Peter Haslag and Daniel Weagley, “From L.A. to Boise: How Migration Has Changed During the COVID-19 Pandemic,” SSRN, March 18, 2022, https://papers.ssrn. com/sol3/Papers.cfm?abstract_id=3808326.
10. Justin Theal and Alexandre Fall, “Tax Revenue in 21 States Outperformed Pre-Pandemic Growth,” The Pew Charitable Trusts, March 10, 2022, https://www. pewtrusts.org/en/research-and-analysis/ articles/2022/03/10/tax-revenue-in-21- states-outperformed-pre-pandemic-growth.
11. Kate Dore, “Cash-rich states create ‘competitive environment’ with flurry of tax cuts,” CNBC, March 12, 2022, https://www. cnbc.com/2022/03/12/cash-rich-statesare-slashing-taxes-amid-revenue-windfalls. html.
12. “COVID-19 Policy Tracker,” MultiState, last updated December 6, 2021, https://www. multistate.us/issues/covid-19-policy-tracker.
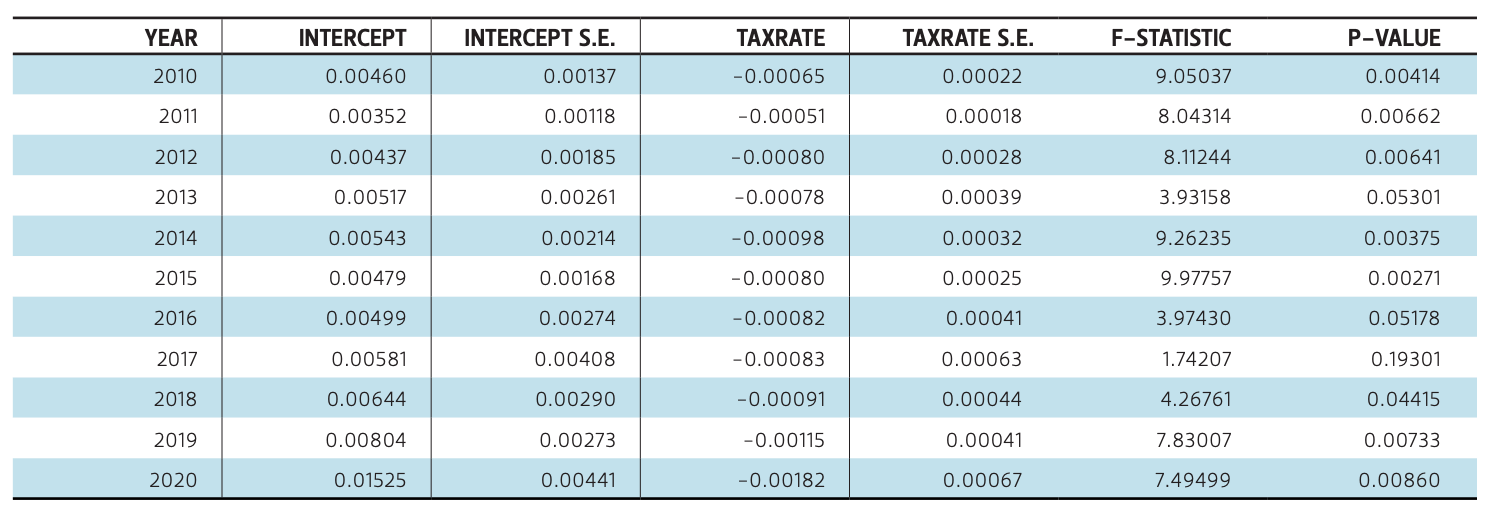
Appendix
Table 1 — Summary of Estimates from the Net Migration Regressions
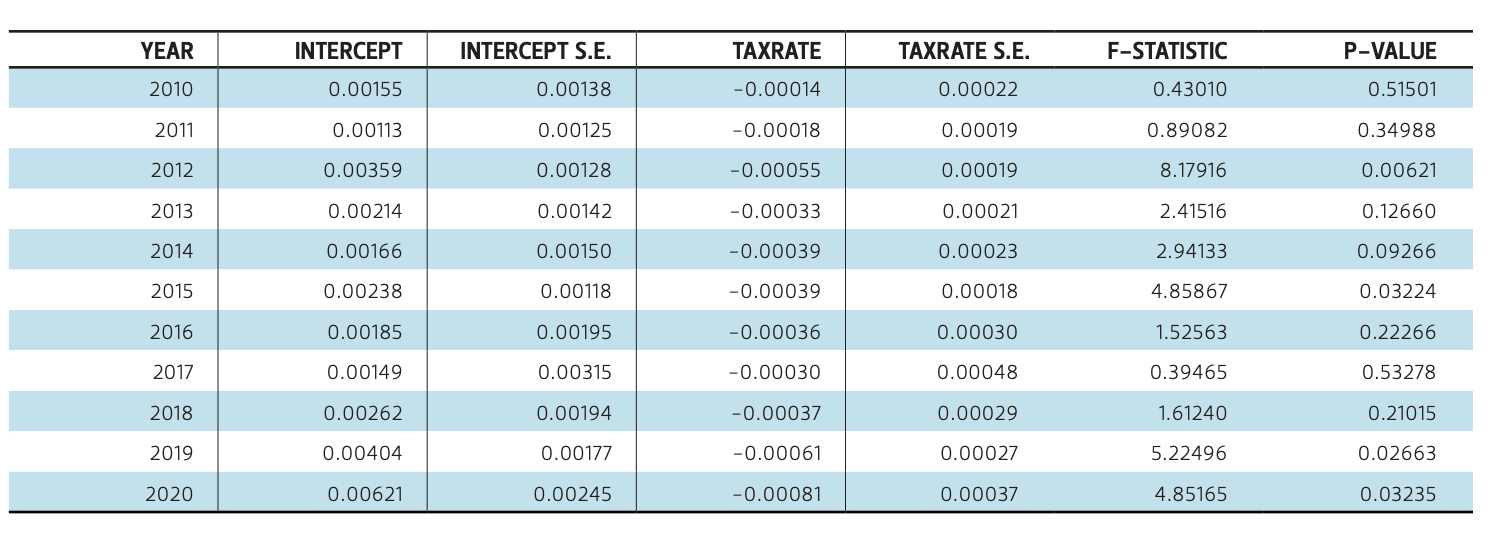
Table 2 — Summary of Estimates from the AGI Regressions
This material may be quoted or reproduced without prior permission, provided appropriate credit is given to the author and Rice University’s Baker Institute for Public Policy. The views expressed herein are those of the individual author(s), and do not necessarily represent the views of Rice University’s Baker Institute for Public Policy.


