
Abstract
A regulation from the Centers for Medicare and Medicaid Services (CMS) required that, starting January 1, 2021, all U.S. hospitals publicly display the cash price as well as the minimum and maximum negotiated charge for 300 “shoppable services.” During July and August 2021 we evaluated compliance with these requirements among the U.S. News & World Report’s 20 honor roll hospitals in 2020-21 and 41 high-quality hospitals in the same cities. We compared prices for three imaging studies (brain MRI, abdominal ultrasound, and chest x-ray) and three hospital services (basic metabolic panel, electrocardiogram [ECG], and lower joint replacement). Within each of the studied procedures, at most 7 of the 14 cities with top-20 hospitals had minimum negotiated prices that were reported by at least one top-20 hospital and a competitor that was comparable in quality. The top-20 hospital was the highest priced for 5 of 7 cities for ECGs. Yet a top-20 hospital was the highest priced facility in only 1 of 5 cities for both MRIs and joint replacements. For a handful of cities and procedures, the top-20 hospital was priced much lower than its competitor(s), or there was wide price disparity between top-20 hospitals in the same city. Top-20 hospitals were more likely to report cash prices, but they were orders of magnitude higher than their minimum negotiated price. Many highly respected U.S. hospitals are not in compliance with new price transparency legislation, even though the prices of reporting top-20 hospitals are not systematically higher than competitors with comparable quality. Full price transparency by all hospitals would aid patients and payers in identifying price outliers and choosing the most cost-effective providers.
Background
On January 1, 2021, the Centers for Medicare and Medicaid Services (CMS) implemented
Federal Rule (FR) 65524, which requires that all U.S. hospitals publicly display prices for 300 circumscribed shoppable services (70 services required of all hospitals, 230 selected by each hospital), as well as a downloadable and machine-readable dataset containing all services provided.1 The legislation stipulates that for each service, hospitals must post five separate prices, including their discounted cash price and minimum negotiated charge. The new legislation has garnered significant attention from researchers and journalists, but little peer-reviewed research. Several recently published commentaries in high-impact medical journals have described the potential benefits of and barriers to price transparency and its significant short- term impact on prices.2 Blog posts and newspaper investigations have reported limited compliance by hospitals with the new regulation.3 Some previously published early evaluation of reporting compliance may have been disadvantaged by hospitals employing special coding to hide prices from internet search engines.4 These methods of concealing the posted price were explicitly banned by CMS on March 23, 2021, prior to our evaluation.5
The objective of our study was to evaluate whether the 20 high-profile U.S. hospitals listed in the 2020-21 U.S. News & World Report honor roll and hospitals with similar quality ratings in their city have displayed their prices for six common shoppable services on their public websites, and to describe the variation in prices displayed.
Methods
Data was collected from all hospitals ranked as the top 20 in the 2020-21 U.S. News & World Report honor roll and all of the 41 surrounding hospitals (acute care facilities
within 25 miles) with Medicare Hospital Compare overall star ratings equal to or higher
than the top 20 hospital(s) in their region, for a total of 61 hospitals. Data collection occurred during July and August of 2021.
First, we selected three imaging tests (brain magnetic resonance imaging [MRI], abdominal ultrasound, and chest x-ray with two views) and three clinical services (major lower joint replacement, basic metabolic panel, and electrocardiogram) from the 70 shoppable services required by CMS. We identified each service using the current procedural terminology (CPT) code or diagnosis related group (DRG) that CMS provided. Of note, the DRGs for total lower joint replacement do not specify a particular joint. Therefore, we decided a priori to search for the price of a hip replacement if a hospital listed prices for both hip and knee replacements.
Second, we determined whether the hospital displayed prices for these services on their public websites. We searched each hospital’s website as well as related sites from the associated health system when applicable. We then collected information for each hospital and service with respect to whether: (a) a discounted cash price was available and if so, what that price was; (b) the minimum and maximum negotiated
price was available and (c) if so, what those prices were.
Results were summarized using univariate methods (percentages, means, and range). Mean cash prices and minimum negotiated prices for each hospital were graphed by procedure type and region. We focus analyses on the minimum negotiated price, because the insurer with the largest market share is likely to have negotiated this price, which would apply to the largest number of patients.
Results
Among the 20 U.S. News honor roll hospitals, one hospital did not report any price data
for any procedure. Four additional hospitals did not report price data (cash, minimum, or maximum) for one individual service. Only seven out of the top 20 hospitals (35%)
posted the cash, minimum, and maximum negotiated prices for all six services. Thirteen of the top 20 hospitals (65%) reported cash prices for all six services.
Eighteen out of the 61 high-quality hospitals in our sample reported complete price data (cash, minimum, and maximum) for all six services. Among these 61 hospitals, cash prices were reported by 80% or more hospitals for each service, except for joint replacement (64%). The minimum and maximum negotiated prices were reported by only about half of the hospitals regardless of the procedures. The negotiated prices were often found only in the downloadable data files.
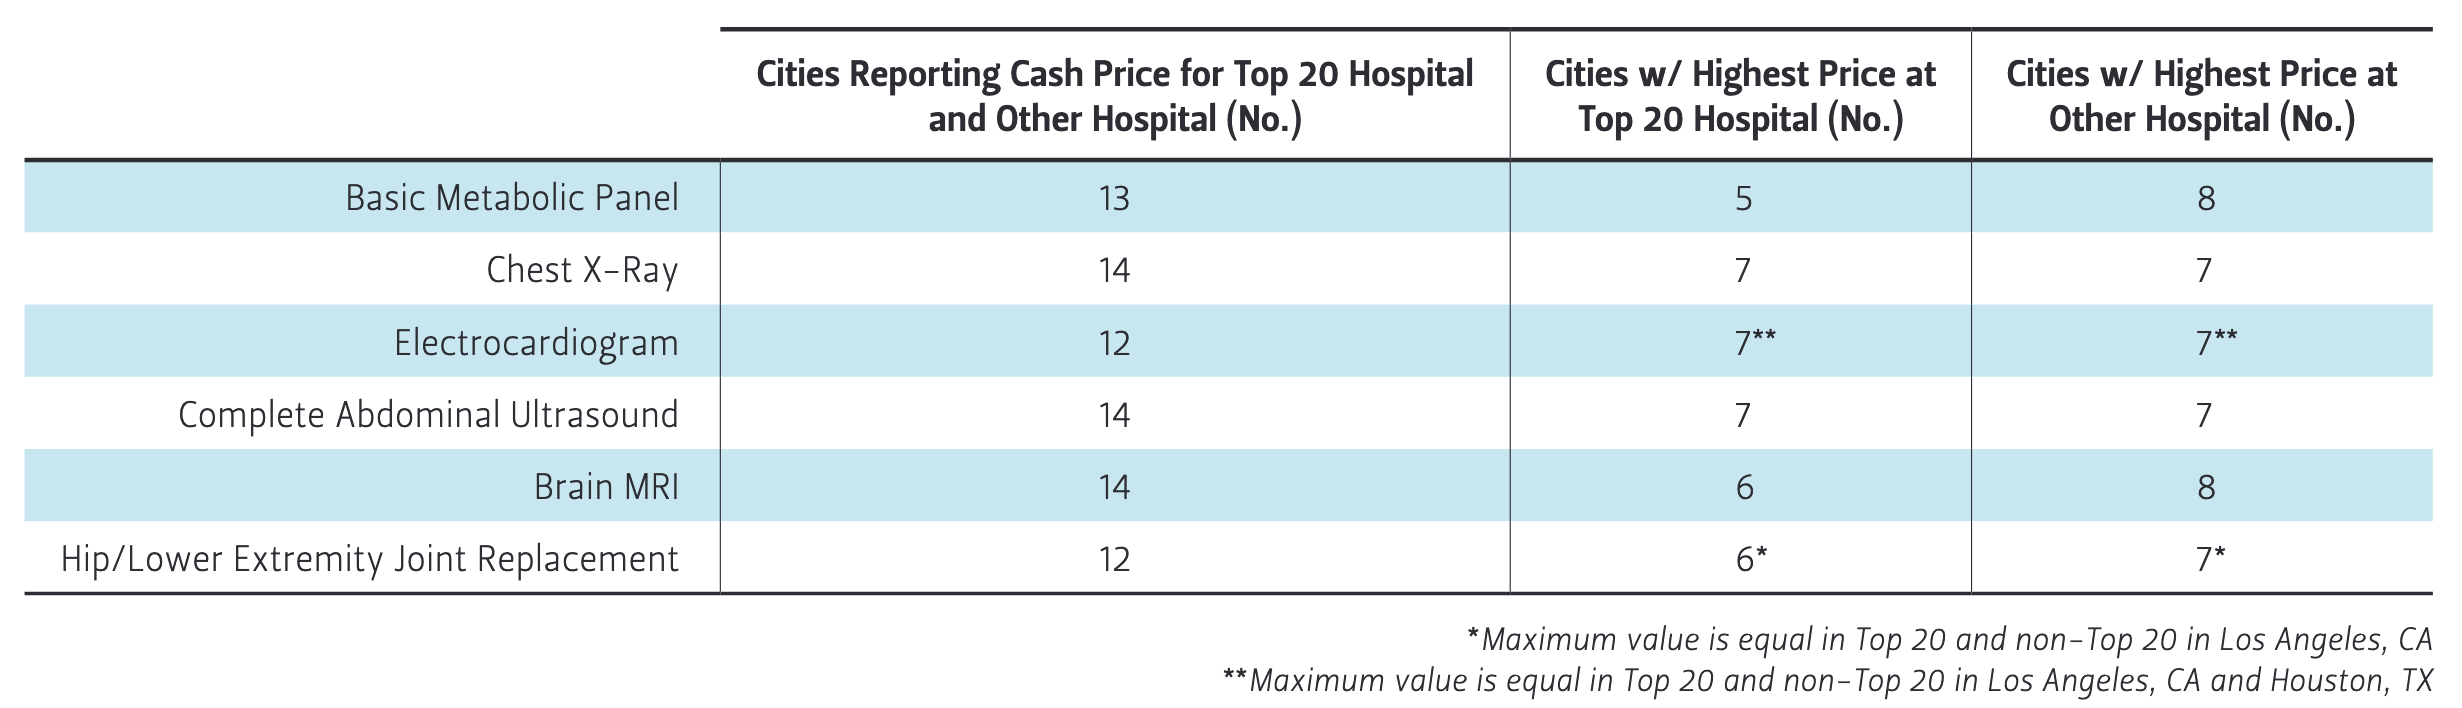
Figure 1 graphs the negotiated minimum price for each hospital by service and geographic region. In 14 cities with top-20 hospitals, seven cities at most had at least one top-20 hospital as well as one or more high-quality competing hospital(s) reporting prices for 1 of the 6 services we studied. In three cities, no hospitals reported minimum negotiated prices.
Figure 1 — Minimum Negotiated Prices by Service and Region
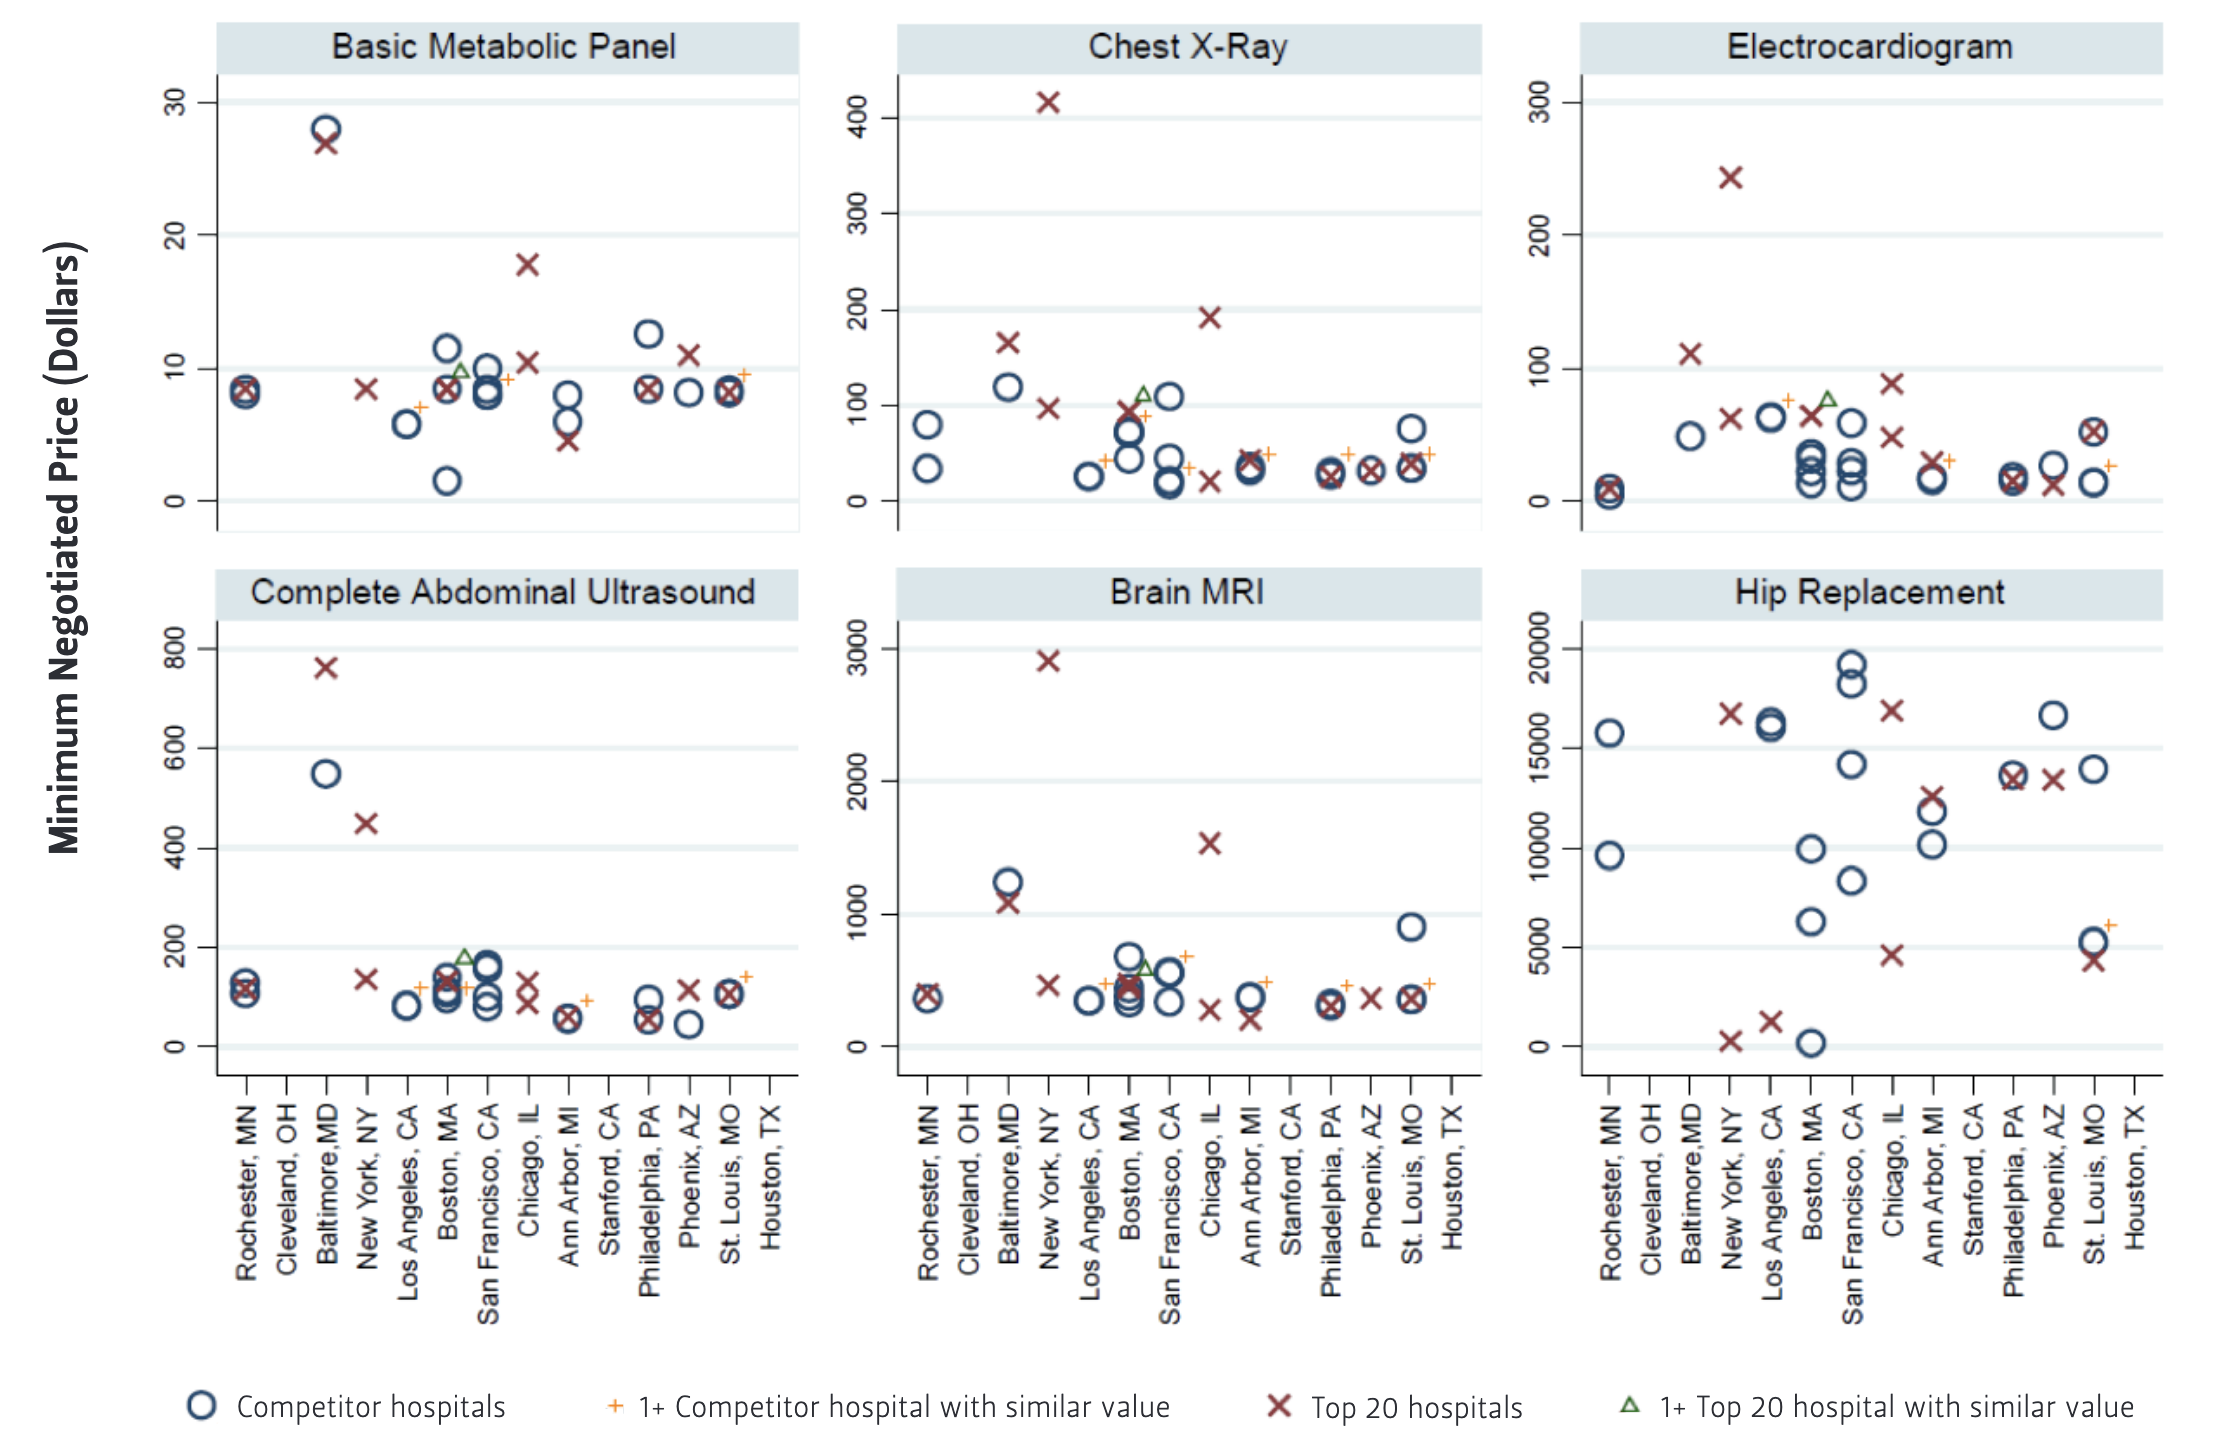
For cities with minimum negotiated prices from both a top-20 and at least one high-quality competing hospital, Table 1 reports the number of cities by service when the top-20 hospital is the highest priced facility. The top-20 hospital was the highest priced facility in 5 of 7 cities for ECGs, 3 out of 6 cities for chest x-rays, and 3 out of 7 cities for abdominal ultrasounds. Yet a top-20 hospital was the highest priced facility in only 1 of 6 cities for brain MRIs ($396 versus $364 in Rochester, MN) and 1 of 5 cities for joint replacements ($12,546 versus $11,818 and $10,148 in Ann Arbor, MI).
For a handful of cities and procedures, the top-20 hospital reported a minimum negotiated price that was much lower than its competitor(s) ($363 versus $904 for a brain MRI in St. Louis; $13,403 versus $16,625 for joint replacement in Phoenix, AZ). New
York and Chicago each had two top-20 hospitals that posted prices for most of the six services we studied. In these cases, theminimum negotiated price between these two hospitals in the same city frequently differed by a substantial amount. For example, the price for a brain MRI was $463 in one top-20 hospital and $2,901 in another top-20 hospital in New York. In Chicago, the minimum negotiated price for joint replacement was $4,613 in one top-20 hospital and $16,869 in the other.
Table 1 — Cities Where Top 20 Hospital Has Highest Minimum Negotiated Price by Service
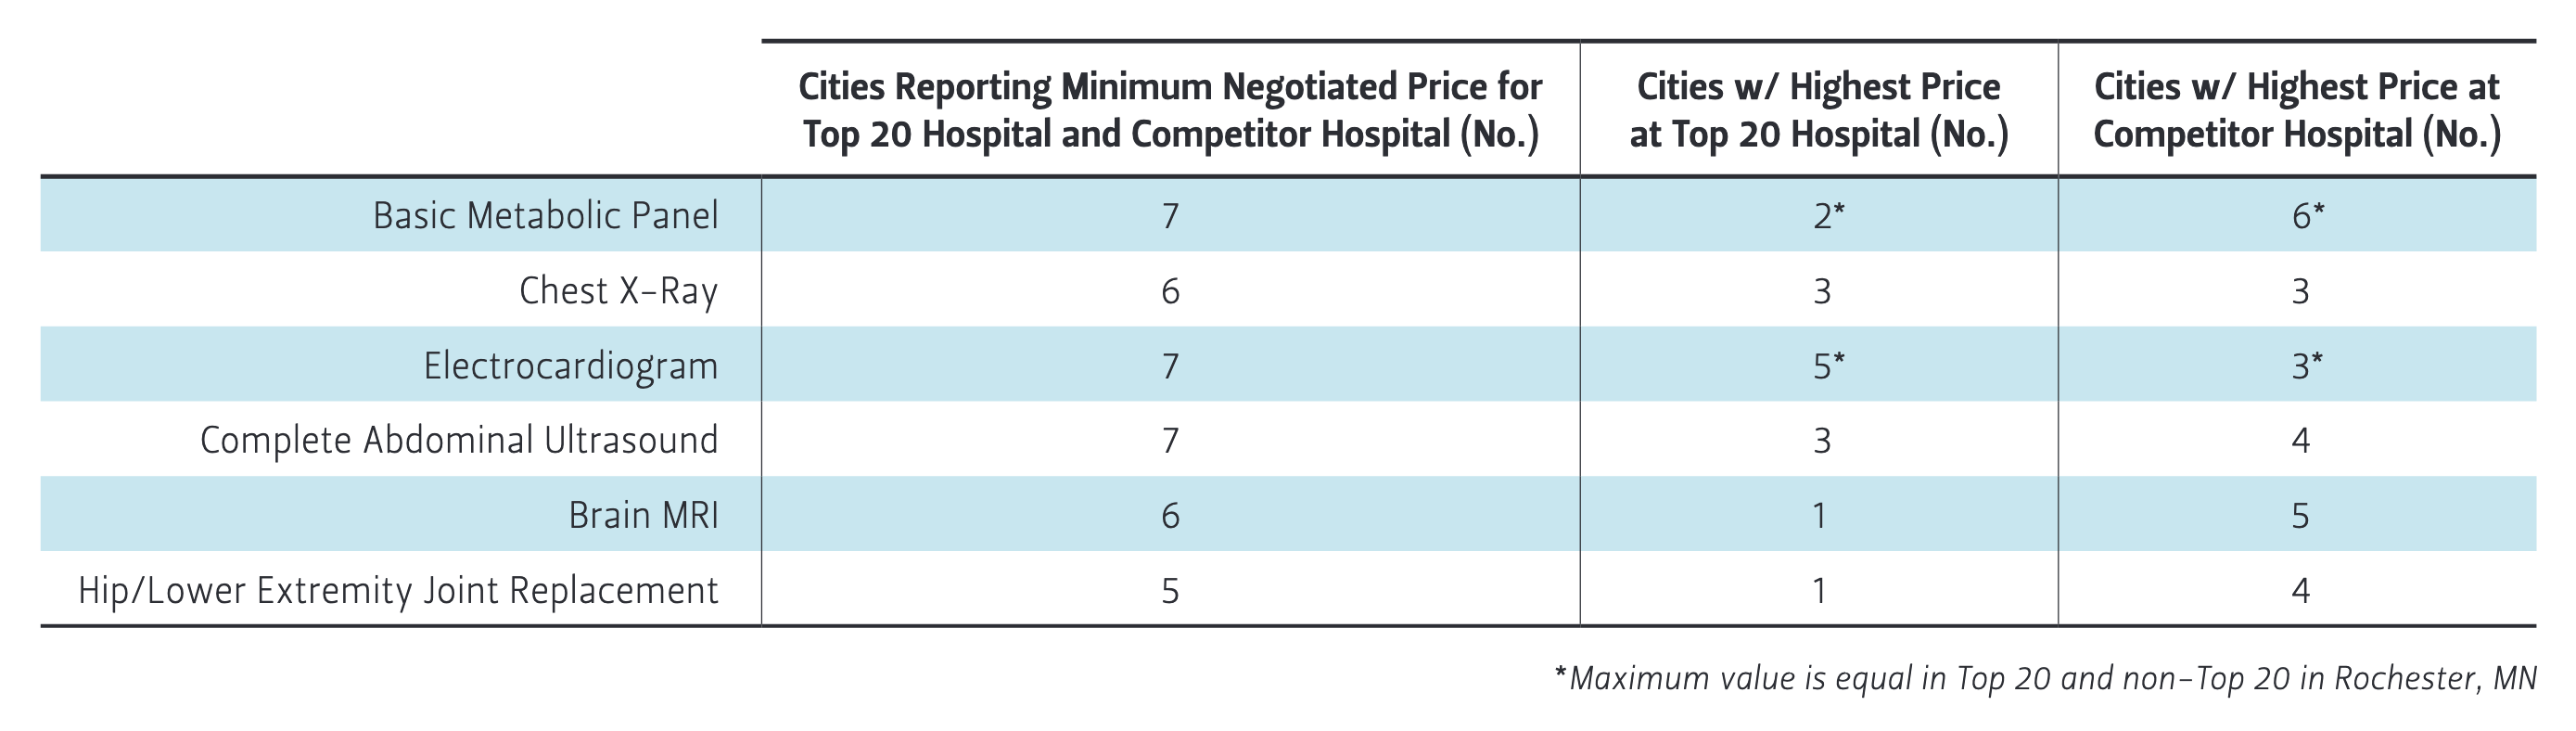
Table 2 — Comparison of Cash and Minimum Negotiated Price within Top 20 Hospitals by Service
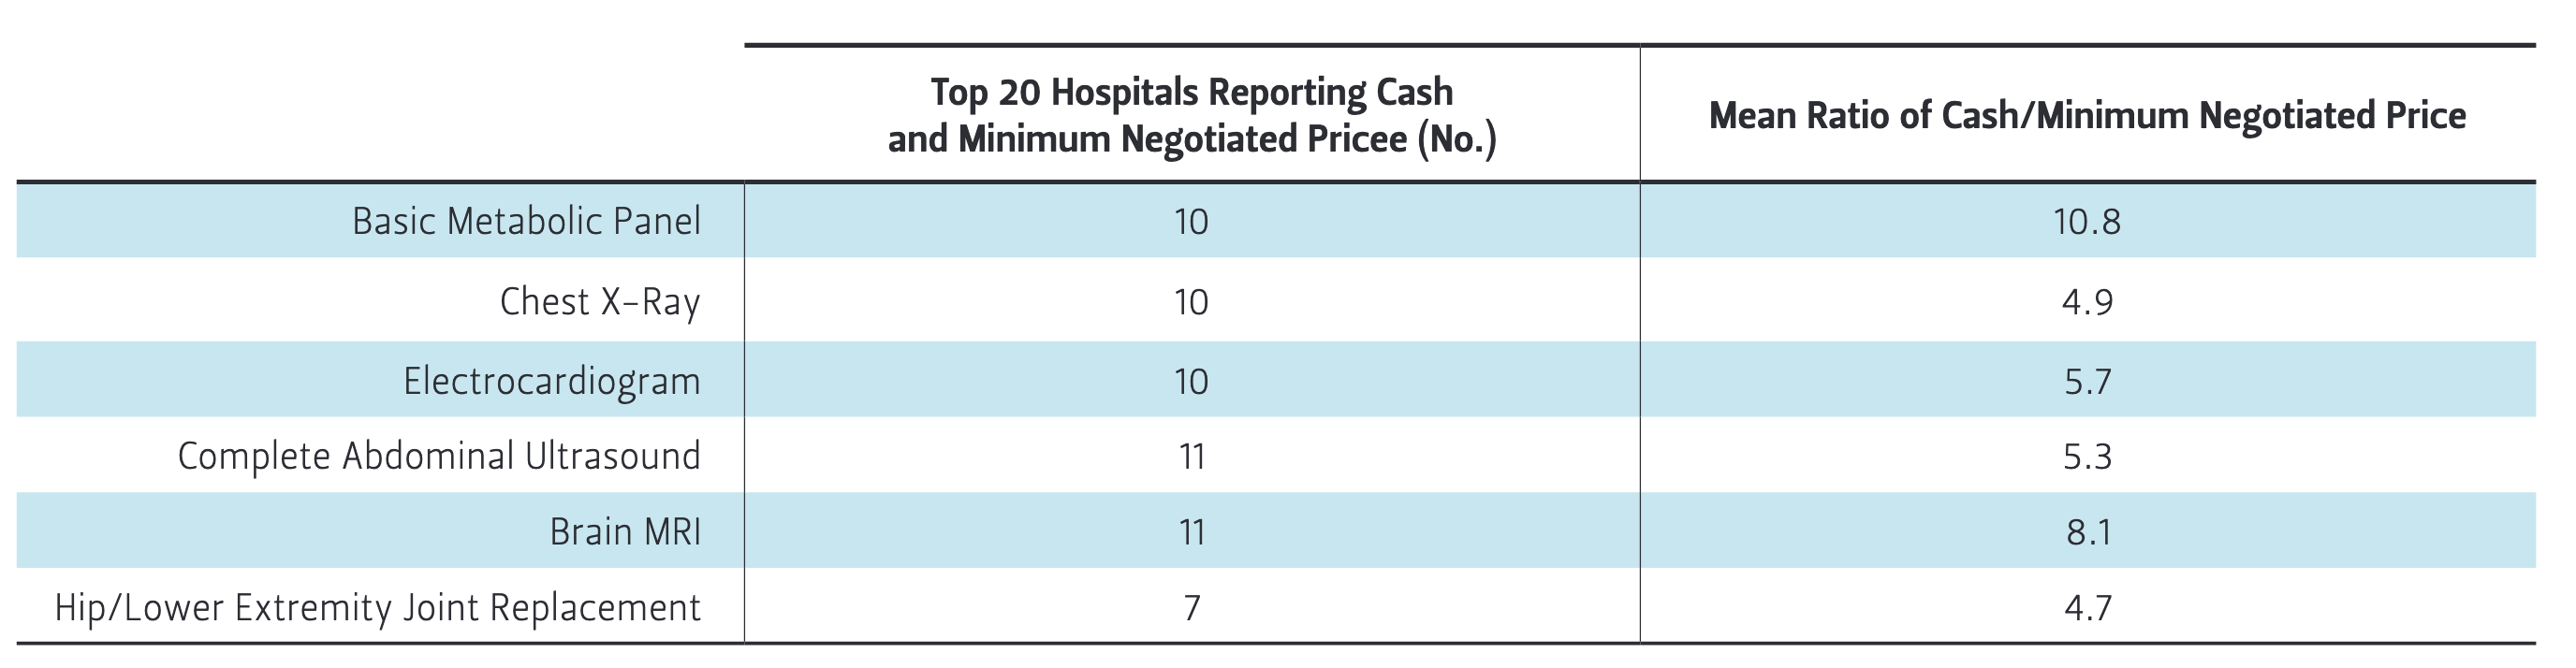
Table 2 lists the number of top-20 hospitals that reported both a cash price and a minimum negotiated price by procedure. Only about half of the top-20 hospitals reported both prices for the six procedures we examined. In each case, the cash price was orders of magnitude greater than the minimum negotiated price. The greatest differential was for the basic metabolic panel, for which the mean ratio of the cash price to the minimum negotiated price was 10.8. For example, the cash price for the basic
metabolic panel at the Mayo Clinic in Phoenix was $256, while the minimum negotiated price was only $11.
The narrowest differential between the cash price and minimum negotiated price was for joint replacement, although only seven hospitals reported both prices. The mean ratio of the cash price to the minimum negotiated price was still sizable, at 4.7. For example, the cash price for a joint replacement at New York Presbyterian Hospital was $82,485, while the minimum negotiated price was $16,704.
Figure 2 presents the cash prices reported by hospitals for each of the six procedures. With many more hospitals reporting cash prices than minimum negotiated prices, more price variability appears in this figure compared to Figure 1. For example, no hospitals in Cleveland reported a minimum negotiated price for a chest X-ray. However, four Cleveland hospitals reported cash prices for a chest X-ray ($130, $130, $177, and 434). Table 3 reveals that almost all of the cities with a top-20 hospital had both a top-20 hospital and a high-quality competing hospital reporting cash prices for the six services we examined. In these cities, the top-20 hospital had the highest cash price roughly 50% of the time.
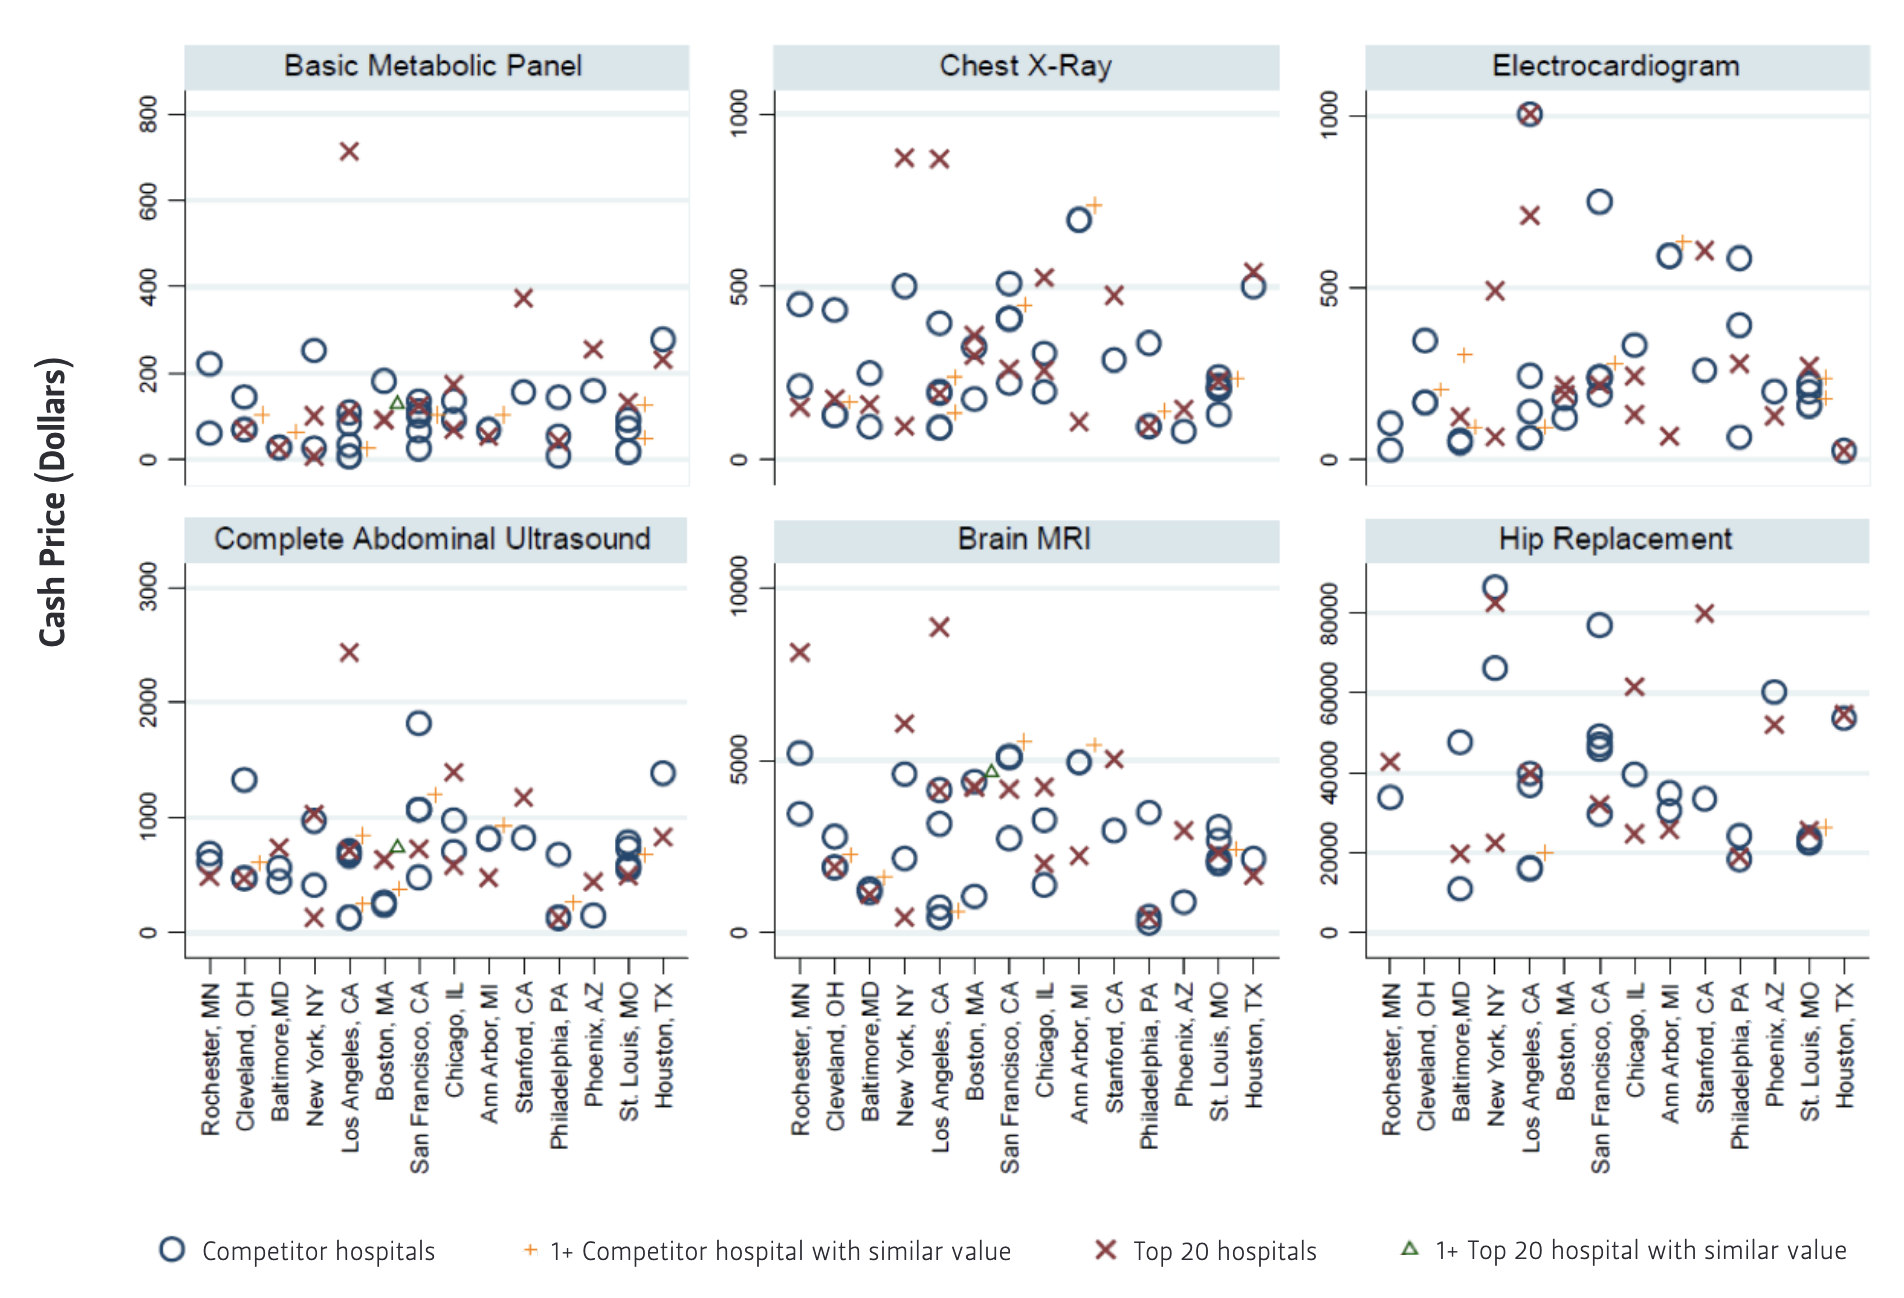
Table 3 — Cities Where Top 20 Hospital Has Highest Cash Price by Service
Discussion
We found poor compliance with a 2021 CMS requirement that hospitals publicly display
their prices for shoppable services among the top 20 U.S. hospitals as ranked by U.S. News & World Report and 41 regional competitors with comparable CMS quality ratings. Our research demonstrated that 57% of these hospitals posted their cash prices, 36% posted their minimum negotiated prices, and only 30% posted both their cash and minimum and maximum negotiated prices.
In seven or fewer cities where minimum negotiated prices were posted for at least one top-20 hospital and a competitor for a particular service, there were multiple incidents where the top-20 did not have the highest price. In fact, for the two most expensive procedures (brain MRI and joint replacement), there was only one city where the top-20 hospital posted the highest minimum negotiated price. Nevertheless, we also found a handful of incidents where there was a dramatic difference in price between two top-20 hospitals in the same city (e.g., $4,613 joint replacement in one top 20 hospital and $16,869 in the other top 20 hospital in Chicago). Although we limited our analysis to high-quality hospitals, these results suggest that there is not always a strong relationship between price and quality for care in this facilities subgroup, and that there are potentially more opportunities for patients and insurance plan sponsors to find cost savings and high-quality care if price transparency improves.
Hospitals were more likely to report their cash prices for the six services we examined. However, in cases where we could compare the cash price to the minimum negotiated price for particular hospitals, the cash price was orders of magnitude higher. This
pricing pattern was noted in a recent Wall Street Journal article,6 which mentions that some hospitals discount these cash prices for uninsured patients, but financial aid policies can be poorly promoted. Our results suggest that the highest quality hospitals are charging cash prices that would discourage financially vulnerable patients from seeking care at these facilities.
Our study results align with the limited available peer-reviewed research that has ascertained high variation in prices and low adherence to the CMS Price Transparency
regulation7—findings that have also been documented by various press outlets.8 There are several potential explanations for the range in prices we observed, which have been discussed in previous literature.9 It could be that the legislation allows for too much leeway in the calculation of prices or that there is fundamental confusion within hospitals over how to ascertain the true “cost” of delivering a service and converting
costs into prices for patients.10 While this may limit the ability of individual patients
to shop for the exact price of a given service, the pricing information could be a valuable tool for employers in negotiating better prices for their employees, and in particular when the negotiated prices are clearly posted, insurers could encourage members of their plans to seek out lower cost care within highly rated providers through health insurance benefit design or to negotiate prices with hospitals.11 Although not discussed specifically in our results, the maximum negotiated price is often higher than the cash price (see Appendix for full table of reported prices), offering potential savings for consumers in those plans who are willing to research and proactively discuss pricing and billing with the hospital.
In the press, hospitals have cited the burden of collecting and posting the data and their belief that the disclosures would not be useful for patients as justification for not following the regulations.12 In its final rule and response to public comments, CMS acknowledges the burden to hospitals and systems of compiling and posting the
data, but states that it is outweighed by the benefit to consumers. Hospitals have also cited concerns about a competitive disadvantage in negotiations—particularly when their nearby competitors have not posted prices;13 a 2021 research study suggests that higher fines may be necessary to surpass any financial pain resulting from disclosure of negotiated rates.14 CMS’s Outpatient Prospective Payment System rule for 2022 increased the potential fines for nondisclosure from a maximum of $109,500 during 2021 to more than $2 million per year in 2022.15 Concerns about competitive disadvantage are precisely why the regulation should be enforced impartially to encourage all to report their prices and create a more level ground for negotiations.
Yet, according to reporting on January 7, 2022, CMS issued over 300 warnings but zero fines in 2021.16
It is understandable that there may have been delays in implementation for which concessions may have been made given that the reporting deadline date of January 1, 2021, coincided with the emergence of COVID-19 in the United States, but the rule was finalized almost a year before that in November 2019. Hospitals have now had multiple years to prepare.
Our study is limited by the fact that it only covers six shoppable services at 61 hospitals; a larger scale analysis is certainly warranted, particularly once enforcement of the higher penalties begins. Also, our data was collected over a limited period and the availability of that data may change over time. Finally, the results of price comparisons are limited by the lack of compliance with reporting regulations. For example, a lack of reported data may cause prices to appear similar within a city—especially if only a single system is reporting, or prices may appear to be outliers if similarly priced hospitals have not reported their data.
In conclusion, many highly respected U.S. hospitals are not in compliance with new price transparency legislation, and there are some dramatic differences in prices among those that are reporting them publicly. Employers should use their influence as the largest consumer of health insurance to assert the need for hospital compliance to both hospitals and regulators. But even now, with limited information, there is substantial room for cost savings while maintaining quality if insurers can encourage patients to seek out care at lower cost, highly rated providers.
Endnotes
1. Centers for Medicare and Medicaid, “Medicare and Medicaid Programs: CY 2020 Hospital Outpatient PPS Policy Changes and Payment Rates and Ambulatory Surgical Center Payment System Policy Changes and Payment Rates. Price Transparency Requirements for Hospitals to Make Standard Charges Public,” 2020, http://www.regulations.gov/.
2. Sherry Glied, “Price Transparency—Promise and Peril,” JAMA 325, no. 15 (April 20, 2021): 1496–97, https://doi.org/10.1001/JAMA.2021.4640; Joseph Antos and Peter Cram, “Making Hospital Price Transparency Work for Health Care Consumers,” JAMA Health Forum 2, no. 4 (April 1, 2021): e210301–e210301, https://doi.org/10.1001/JAMAHEALTHFORUM.2021.0301; Jeffrey T. Kullgren and A. Mark Fendrick, “The Price Will Be Right—How to Help Patients and Providers Benefit from the New CMS Transparency Rule,” JAMA Health Forum 2, no. 2 (February 1, 2021): e210102–e210102, https://doi.org/10.1001/JAMAHEALTHFORUM.2021.0102; Anna D. Sinaiko, “What Is the Value of Market-Wide Health Care Price Transparency?,” JAMA 322, no. 15 (2019): 1449–50, https://doi.
org/10.1001/jama.2019.11578.
3. Morgan A. Henderson and Morgane C. Mouslim, “Low Compliance from Big Hospitals On CMS’s Hospital Price Transparency Rule,” Health Affairs Forefront, March 16, 2021,
https://www.healthaffairs.org/do/10.1377/forefront.20210311.899634/full/; Melanie Evans, Anna Wilde Mathews, and Tom McGinty, “Hospitals Still Not Fully Complying
with Federal Price-Disclosure Rules,” Wall Street Journal, December 30, 2021,
https://www.wsj.com/articles/hospital-price-public-biden-11640882507; Allie Reed, “Medicare Holds Off on Hospital Price Disclosure Fines for Now,” Bloomberg Law,
August 16, 2021, https://news.bloomberglaw.com/health-law-and-business/medicare-holds-off-on-hospital-price-disclosure-fines-for-now.
4. Antos and Cram, “Making Hospital Price Transparency Work,” JAMA; Tom McGinty, Anna Wilde Mathews, and Melanie Evans, “Hospitals Hide Pricing Data From Search Results,” Wall Street Journal, March 22, 2021, https://www.wsj.com/articles/hospitals-hide-pricing-data-from-search-results-11616405402; Suhas Gondi et al., “Early Hospital Compliance with Federal Requirements for Price Transparency,” JAMA Internal Medicine (American Medical Association, October 1, 2021), https://doi.org/10.1001/jamainternmed.2021.2531.
5. Anna Wilde Mathews and Tom McGinty, “Coding to Hide Health Prices from Web Searches Is Barred by Regulators,” Wall Street Journal, April 14, 2021, https://www.
wsj.com/articles/coding-to-hide-health-prices-from-web-searches-is-barred-by-
regulators-11618405825.
6. Melanie Evans, Anna Wilde Mathews, and Tom McGinty, “Hospitals Often Charge Uninsured People the Highest Prices, New Data Show—WSJ,” Wall Street Journal, July
6, 2021, https://www.wsj.com/articles/hospitals-often-charge-uninsured-people-the-highest-prices-new-data-show-11625584448.
7. Antos and Cram, “Making Hospital Price Transparency Work,” JAMA; Gondi et al.,“Early Hospital Compliance,” JAMA; Roy Xiao et al., “Payer-Negotiated Prices in the Diagnosis and Management of Thyroid Cancer in 2021,” JAMA 326, no. 2 (July 13, 2021): 184–85, https://doi.org/10.1001/JAMA.2021.8535.
8. Evans, Mathews, and McGinty, “Hospitals Still Not Fully Complying,” Wall Street Journal; Reed, “Medicare Holds Off on Hospital Price Disclosure Fines for Now”; Sarah Kliff and Josh Katz, “Why Hospitals and Health Insurers Didn’t Want You to See Their Prices," New York Times, August 22, 2021, https://www.nytimes.com/interactive/2021/08/22/upshot/hospital-prices.html.
9. Antos and Cram, “Making Hospital Price Transparency Work,” JAMA.
10. David W Young, “The Folly of Using RCCs and RVUs for Intermediate Product Costing,” Healthcare Financial Management 61, no. 4 (2007), https://pubmed.ncbi.nlm.nih.gov/17427470/; Michal Horný, Paul R. Shafer, and Stacie B. Dusetzina, “Concordance of Disclosed Hospital Prices With Total Reimbursements for Hospital-Based Care Among Commercially Insured Patients in the U.S.,” JAMA Network Open 4, no. 12 (December 1, 2021): e2137390–e2137390, https://doi.org/10.1001/JAMANETWORKOPEN.2021.37390; David Lazarus, “Leaked Scripps Records Reveal Huge Mark-Ups for Hospital Care,” Los Angeles Times, December 10, 2021, https://www.latimes.com/business/story/2021-12-10/column-healthcare-billing-markups.
11. Sinaiko, “What Is the Value?” JAMA.
12. Evans, Mathews, and McGinty, “Hospitals Still Not Fully Complying,” Wall Street Journal.
13. Ibid.
14. Gondi et al., “Early Hospital Compliance,” JAMA.
15. Centers for Medicare and Medicaid, “CY 2022 Medicare Hospital Outpatient Prospective Payment System and Ambulatory Surgical Center Payment System Final Rule
(CMS-1753FC) | CMS,” 2021, https://www.cms.gov/newsroom/fact-sheets/cy-2022-medicare-hospital-outpatient-prospective-payment-system-and-ambulatory-surgical-center-0.
16. Dave Muoio, “CMS Issued over 300 Warnings, but No Fines, to Hospitals Falling
Short on Price Transparency Last Year," Fierce Healthcare, January 7, 2022, https://www.fiercehealthcare.com/hospitals/cms-has-issued-over-300-warnings-but-no-fines-to-hospitals-falling-short-price.
Appendix available in PDF on left-hand sidebar.
This material may be quoted or reproduced without prior permission, provided appropriate credit is given to the author and Rice University’s Baker Institute for Public Policy. The views expressed herein are those of the individual author(s), and do not necessarily represent the views of Rice University’s Baker Institute for Public Policy.


