
Author(s)

“The crisis takes a much longer time coming than you think, and then it happens much faster than you would have thought.” —Rudi Dornbusch1
China has become the global oil consumer of last resort—accounting for 63% of global incremental liquids (i.e., “crude oil”) demand growth in 2019.2 The oil markets now understandably focus on near-term pressure factors such as OPEC+ behavior and coronavirus-induced shutdowns.3 But looking a few quarters further out, a sustained slowdown in China’s oil demand growth is, from the risk perspective, a lurking crocodile.4 If the croc bursts onto the riverbank, it could set in motion a complex chain of events that would likely reset the global oil supply/demand picture, cost curve, and investment thesis in ways deeply challenging to multiple oil exporters as well as U.S. unconventional liquids plays, even the Permian Basin.
Three key ingredients made the U.S. shale boom work: (1) cheap capital made available through quantitative easing by central banks around the world, (2) China adding several hundred thousand barrels per day or more of incremental crude/ liquids demand annually in most years since 2004, and (3) U.S. oil patch ingenuity and entrepreneurial spirit. But factor #3 would never have blossomed without #2, and #1 would likely have been much less possible without China’s need to recycle its massive savings glut back into the global economy. Various analysts may reasonably apply different weights to the chicken-and-egg loop described above, but the virtually inescapable bottom-line conclusion remains: China’s rise has been indispensable in shaping the global oil architecture and underpinning new capital flows and wealth creation, including in Texas, where the author is based.
My calculations indicate that between 2003 and 2014 (when oil prices first crashed), China’s own oil demand grew by about 5.4 million barrels per day. But the combined oil demand growth in Africa, Central and South America, the former Soviet Union, and the Middle East (commodity exporting regions heavily leveraged to Chinese growth) clocked in at 7.3 million barrels per day—134% of China’s own demand growth.5
From 2015 to 2019, the major commodity exporters’ oil demand only rose by 32% of what China’s did, a far slower rate even adjusting for the shorter time frame. The core commodity exporting regions—led by the Middle East—saw a meaningful uptick in incremental oil demand growth in 2019. Whether this is an outlier remains to be seen. If, for instance, proposed cuts to fuel subsidies are postponed as a result of the coronavirus pandemic, or conversely, accelerate with a change of leadership in certain key regional countries, oil use could move significantly in either direction.
But a question now arises: How much more runway for growth does China’s oil demand have? If examined through the lenses of demographics, debt, and other emerging slowdown factors, the picture increasingly trends toward pessimism. The issue deserves special attention because it is structural, and if it happens, will unfold and exert itself for years to come—unlike the coronavirus lockdowns, which are short-term demand catastrophes with impacts that should rapidly recede once governments choose to lift them.
To quantify the impact that China’s emerging demographic decline, debt burden, and increasingly likely structural economic growth downshift could have on oil and gas markets, consider the following facts:
- During the past 20 years, China accounted for 39% of net global oil demand growth. From 2010-2019 during the shale boom period, China accounted for a nearly identical 38% of net global oil demand growth.
- During the past 20 years, seven of the 10 highest annual oil demand increases of any country were posted by China. The U.S. accounted for the other three. There is no country—or even group of countries—that in the foreseeable future could consistently generate sufficient oil demand growth to offset a significant slowdown in China’s oil consumption, were that contingency to manifest itself.
Figure 1 — China has Become the World's Oil Consumer of Last Resort
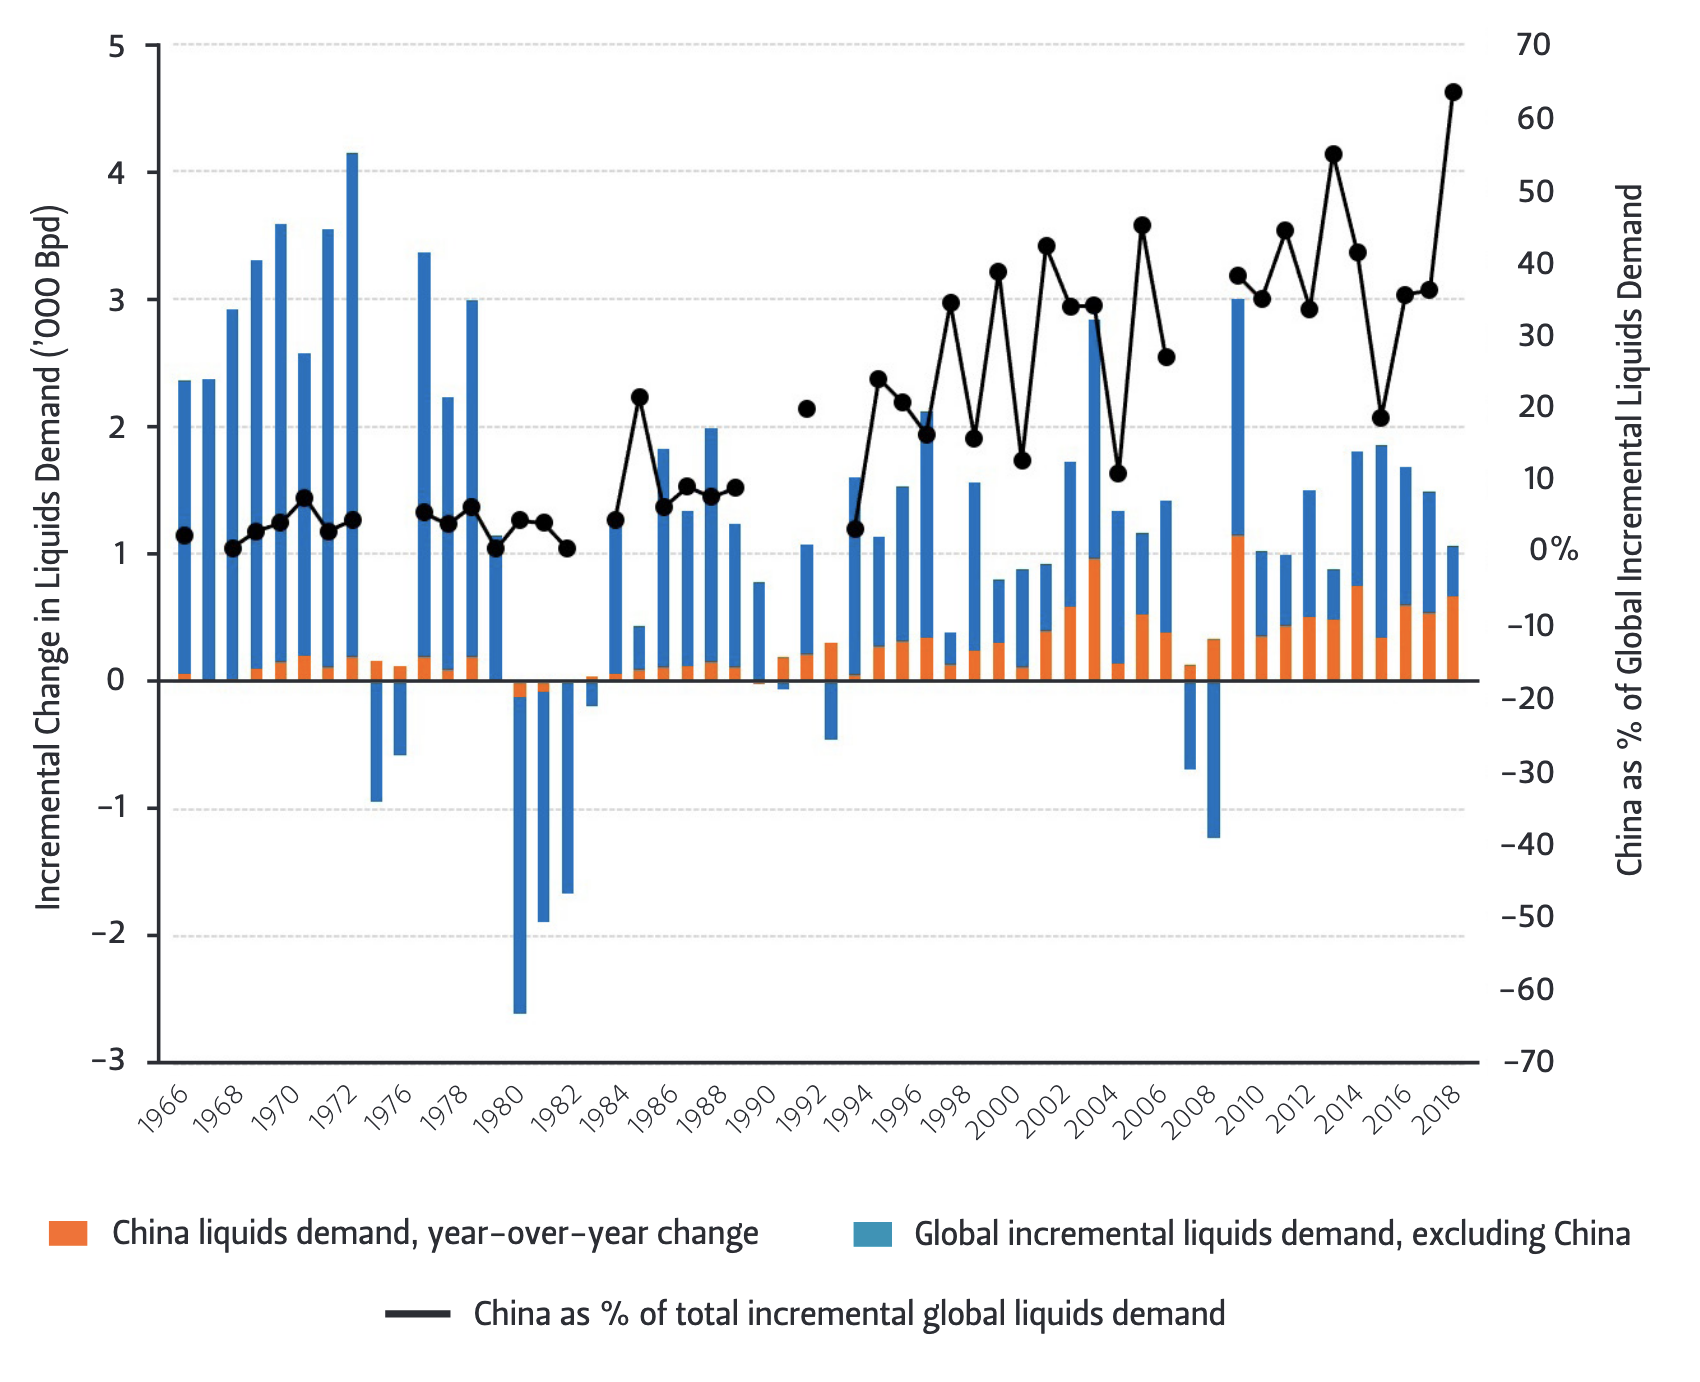
Figure 2 — Annual Changes in Major Commodity Exporting Regions' Oil Demand (1965-2019)
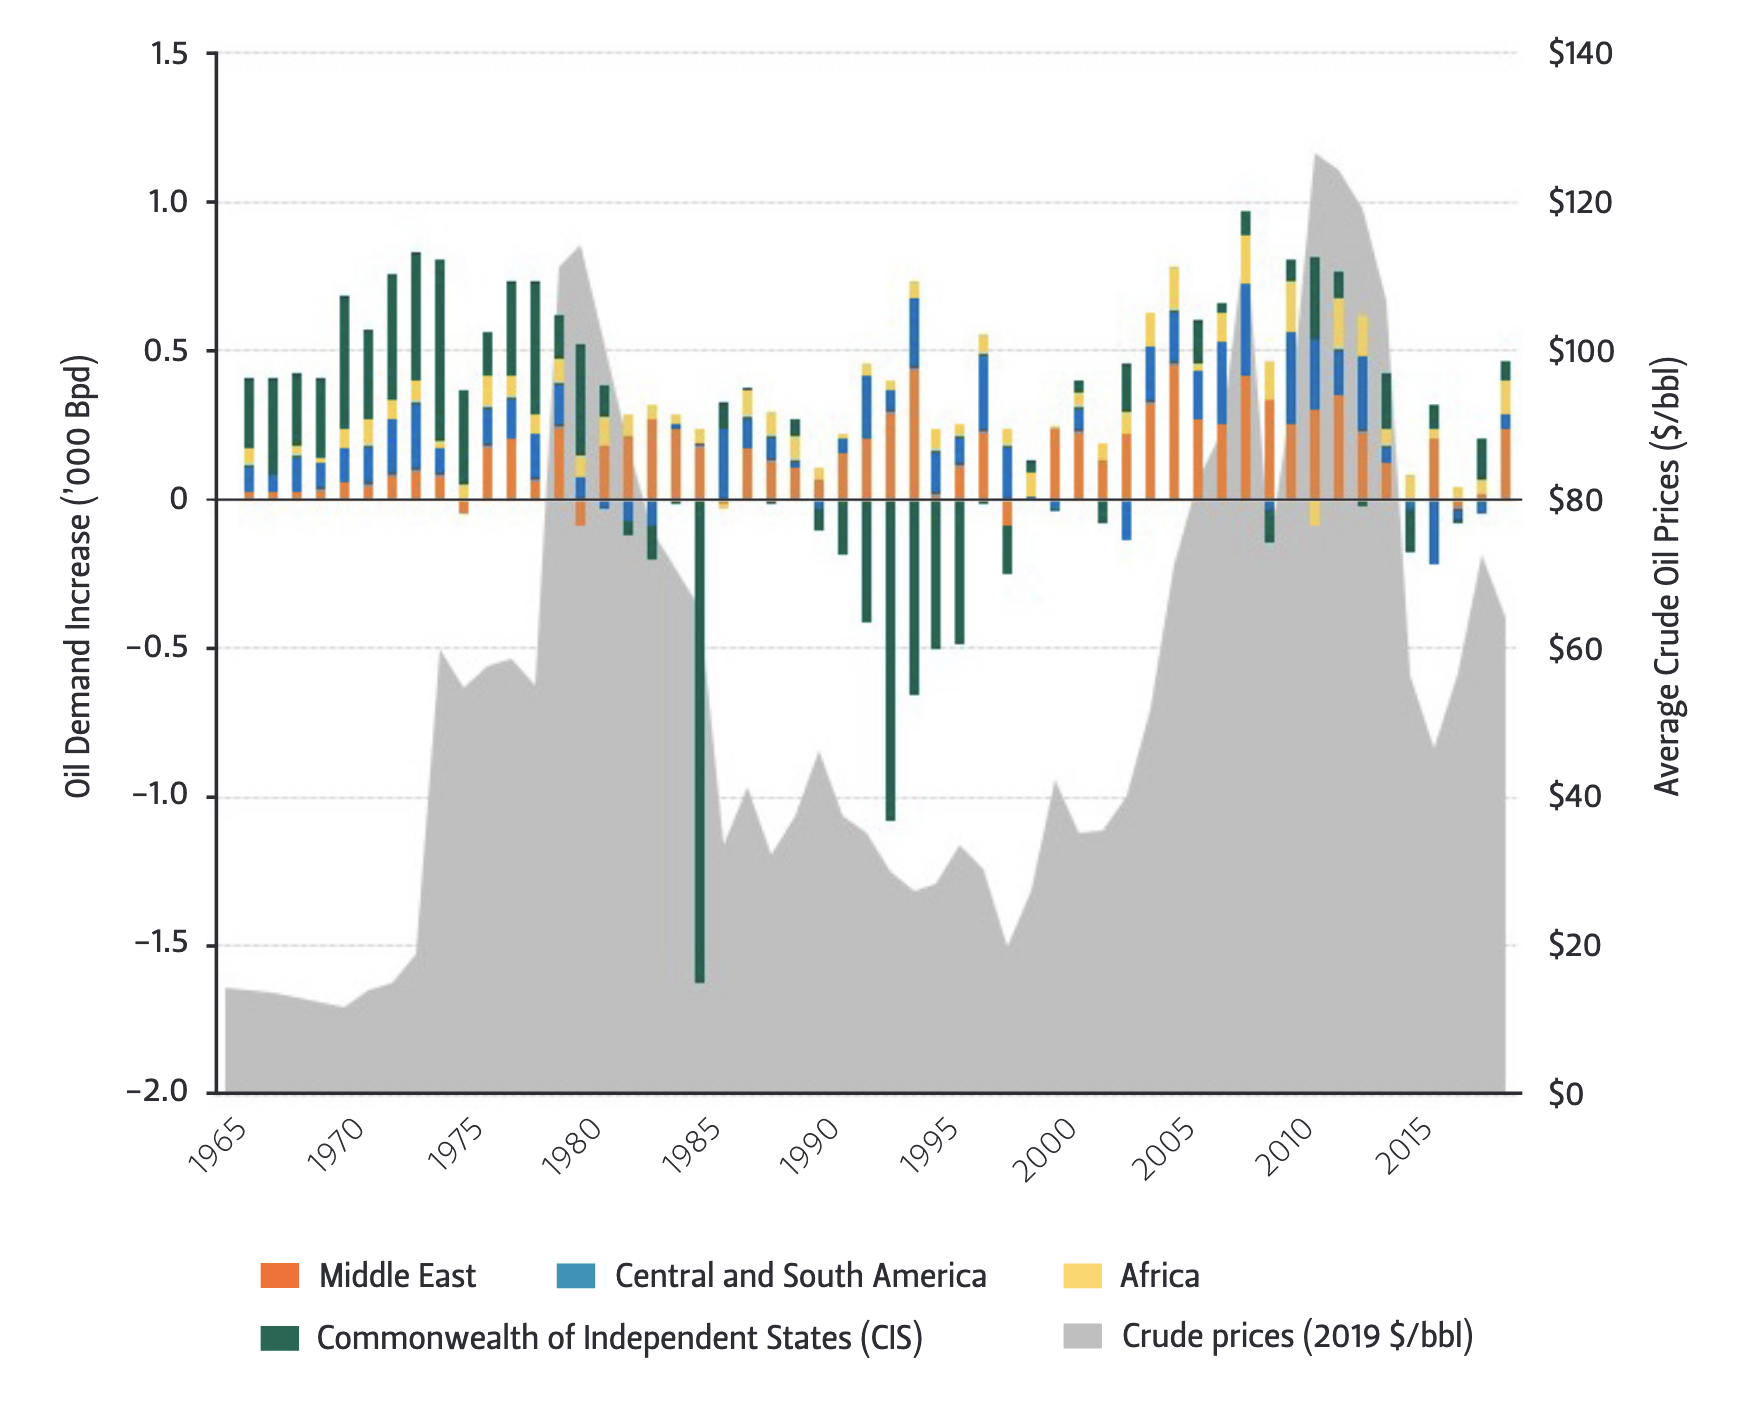
Note Major commodity exporting regions’ oil demand growth declined dramatically as commodity
prices broadly downshifted during the 2011-2014 time period.
The "Debt Threat"
One of President Xi Jinping’s major policy priorities has been to shift China’s economy from a model led by investment in fixed infrastructure, like buildings, bridges, roads, and the like, to a model that more heavily emphasizes domestic consumption. With the dramatic deterioration in U.S.-China ties over the past two to three years, China’s leadership is now doubling down on the domestic economy via a concept dubbed “dual circulation theory.”6 In a nutshell, dual circulation entails an economic architecture dominated by China’s domestic economy and backstopped by external trade designed primarily to feed raw materials into the Chinese manufacturing machine. How this plan unfolds in practice remains to be seen, given that most of the world’s advanced economies are not eager to embrace and accept Chinese mercantilism. Nonetheless, the policy thrust clearly highlights how Beijing is pinning its hopes on the domestic market and expected consumption potential latent in China’s hundreds of millions of middle-class citizens.
The challenge is that those same men and women Beijing now looks to as engines of economic growth (and liberation from the “Chimerica”—or China and America— growth model of the past 30 years) have, over the past decade, increasingly turned to debt as the fast path to personal economic fulfillment. As Logan Wright and Allen Feng of the Rhodium Group aptly put it in a May 2020 research note, “historically underleveraged household balance sheets were the last frontier of China’s historic credit expansion.”7 Between 2013 and 2019, that “frontier” came to be settled by an estimated 35 trillion RMB ($5 trillion) expansion in the debt held by households in China.8
Empirical investigations suggest that household debt levels have significant impacts on consumers’ subsequent abilities to spend and contribute to economic growth. One paper from 2015 analyzed data from 30 countries between 1960 and 2012 and found that a one standard deviation increase (6.2%) in the ratio of household debt to gross domestic product (GDP) over the prior three years was associated with a 2.1% decline in GDP over the next three years.9 Likewise, a 2017 working paper published by the Bank for International Settlements (BIS) found that “a 1 percentage point increase in the household debt-toGDP ratio tends to lower output growth in the long run by 0.1 percentage point,” suggesting that credit expansion amps up consumers’ near-term contributions to GDP growth, but at the expense of longer-term sustainability of that growth.10
While these research results are not deterministic for China’s future, the fundamental economic concepts underpinning them—such as consumers’ reduced spending capacity when they face large debt service burdens—apply across any society on the planet. Indeed, the BIS working paper found that once the household debt-to-GDP ratio exceeds 60%, “[t]he negative long-run effects on consumption tend to intensify.”11 China’s household debt-to-GDP ratio is rapidly approaching that empirical danger threshold.
Dismissing the “debt threat” would also be unwise given the rapid expansion in household credit, a.k.a “debt,” in China. Let’s take a look at the numbers. From 2013 to 2019, household debts rose by nearly 35 trillion RMB, according to BIS data (Figure 3). The first period (2013-2015) accounted for 20% of the total increase. The second period (2015-2017) accounted for 38% of the total increase. And the third period (2017-2019) provided approximately 42% of the total household credit expansion that occurred between 2013 and 2019 in China.
Figure 3 — Expansion in China's Household Credit (a.k.a Debt) vs. Pre-Crash U.S.14
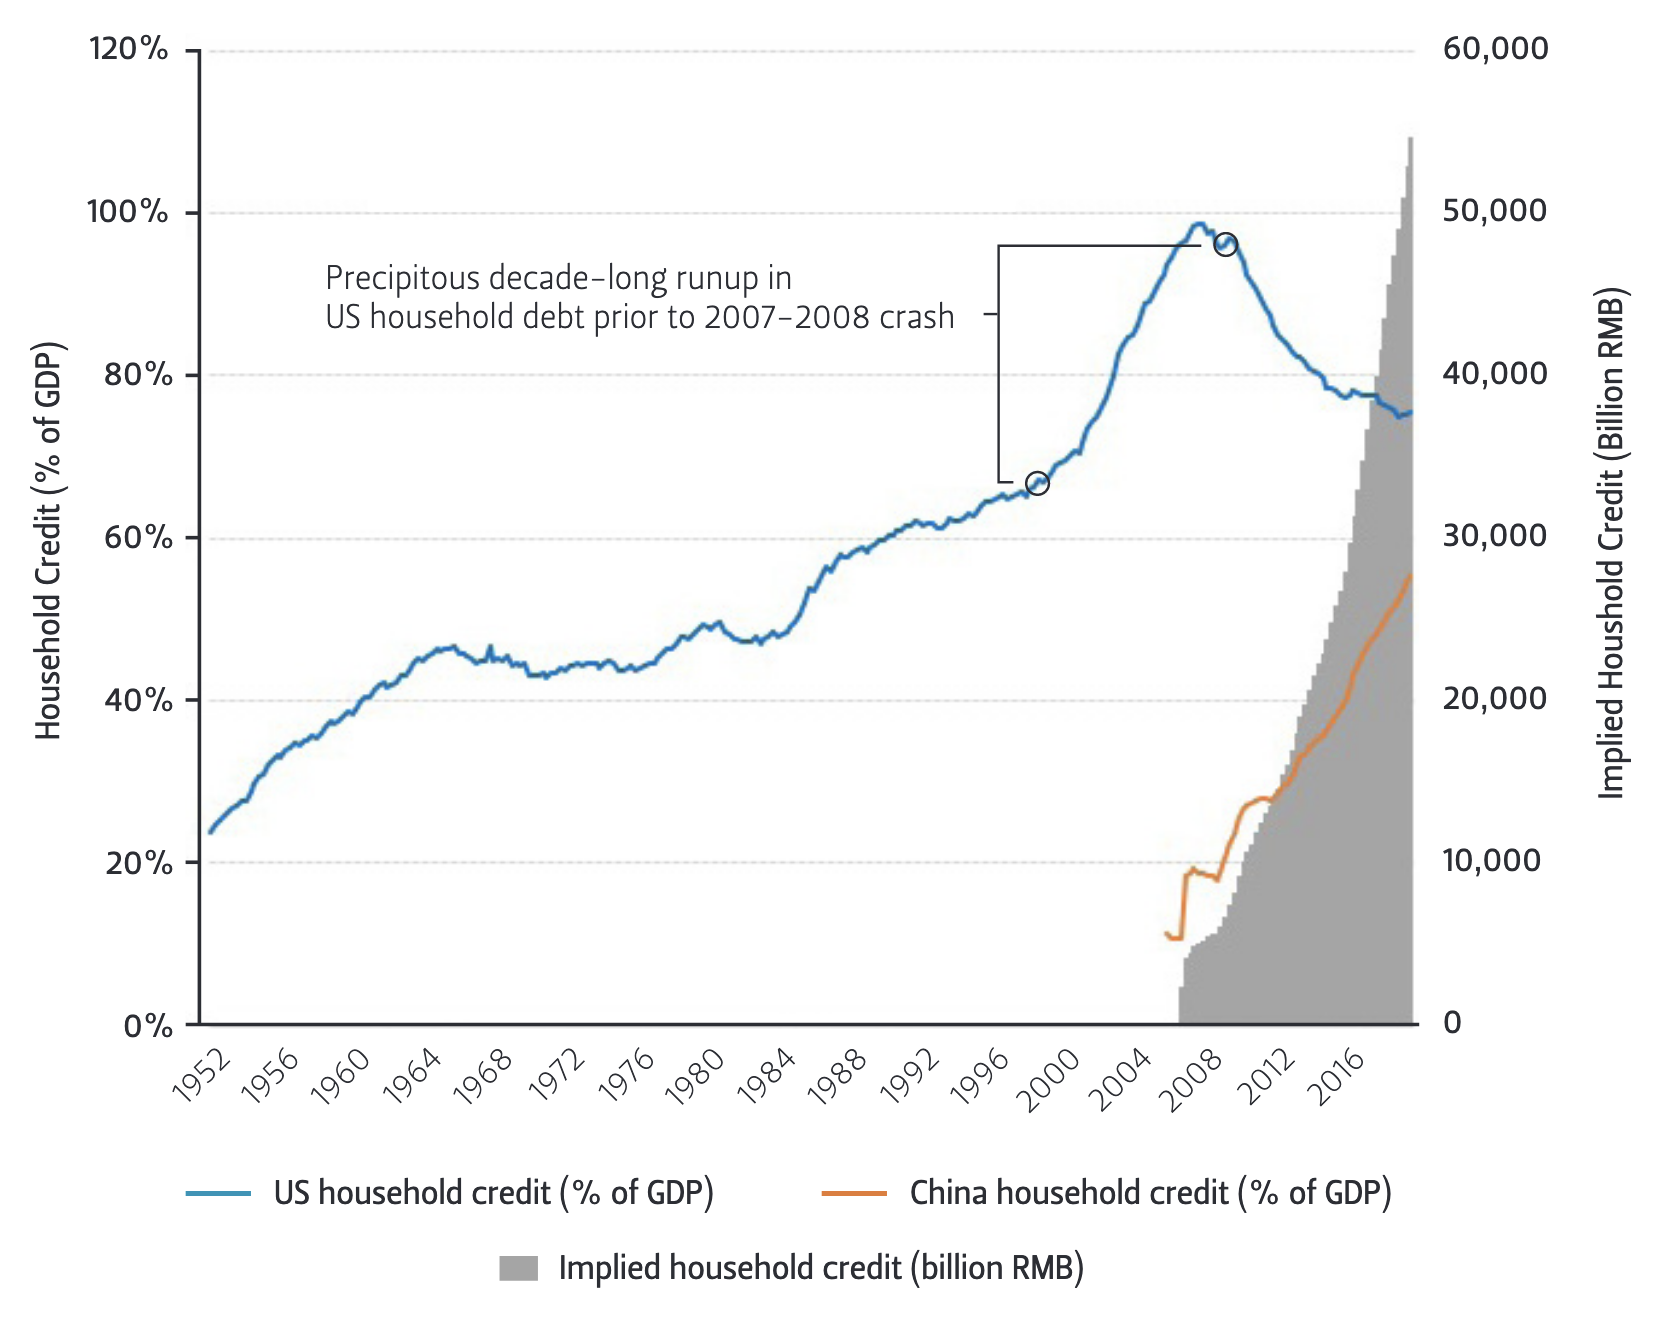
Accelerating credit (i.e., “debt”) growth matters, because while the amount held by debtors grew faster over time, it is unlikely that the quality of assets they borrowed against, the supportable value of the properties purchased (for secured debts), or the strength of household finances (for unsecured debts) improved commensurately as the overall debt burden increased.
Asset quality questions become especially pertinent when considered in the context of residential property markets— which Goldman Sachs estimates were worth $52 trillion in 2019—and which are one of the primary storehouses of wealth for consumers in China whose assets are stranded by capital controls.12 To give a sense of just how critically important the property market is to Chinese consumers, consider that urbanites in China have an estimated 78% of their wealth in residential properties (versus 35% for the U.S., where more liquid investments such as stocks and bonds dominate).13
China’s disproportionate reliance on residential homes to build and store wealth thus meets the household debt boom. Early homebuyers likely “bought low and sold high,” but the players who arrived later are far more likely to have bought at bubble prices that the market will fall past in the event of even a mild initial correction. Furthermore, we won’t know the whole picture until a price decline occurs. If purchases are truly “cash buys,” the owners can sit tight and wait for market conditions to (hopefully) improve. Conversely, if a meaningful number of home purchases turn out to have been bought with “cash” freed up by consumers taking on a similar amount of debt elsewhere in their personal portfolios, perhaps predicated on the expectation of rental revenues or returns on capital from home price appreciation, then the specter of deleveraging looms. And as the U.S. learned in 2008, deleveraging on the back of a “mark to market” event can precipitate major systemic challenges and even crises.
At this point, a housing price correction of even 5-10% would destroy trillions in wealth and be a major damper on consumer sentiment (and by extension, activity). With the proliferation of various shadow finance vehicles in China and the potential for some of these to be linked to the real estate market directly or via derivative pathways, deleveraging could spawn some scary knock-on scenarios—nearly all of which would have big impacts on oil prices. That, in a nutshell, represents the “debt threat” that China’s consumer class poses to oil prices moving forward in the two- to five-year time frame.
Demographic Decline, Reduced Economic Vitality ... Weaker Oil Demand?
China is graying before growing rich. Current aging trends suggest China’s above-65 population is now growing at more than twice the annual rate of that demographic segment in the United States. As a result, by 2030, the population-proportional share of China’s 65+ cohort could be as large as that of the current 65+ population in the United States.15
Historical experience indicates that demographic shifts of the scale and velocity currently ongoing in China can have momentous economic consequences. Japan was an industrial power that took the commercial world by storm as it rose from the ashes of World War II and embarked upon more than three decades of rapid growth, culminating in the “bubble economy” of the late 1980s. Thenceforth, rapid aging began suppressing Japan’s growth, ultimately sending g it into nearly 20 years of stagnation.
While China is not Japan, the latter’s experience offers a dire illustration of (1) how a demographic decline can shortcircuit the economic potential of a worldclass industrial power, and (2) how perilous it can be for policymakers to ignore negative demographic shifts. Maasaki Shirakawa, the governor of the Bank of Japan from 2008-13, explains:
During the height of Japan’s bubble economy in the late 1980s, a few experts had begun expressing cautionary views about the impact of prospective rapid ageing. At the time, I was rather dismissive of such views, as were many economists. Instead, I was optimistic about a market mechanism induced by demographic change: technological innovation and the substitution of labour for capital. In the 1990s, when Japan was muddling through its burst of bubble and the associated financial crisis, I was still of the view that once deleveraging was complete, the economy would return to a path of reasonably high growth rates, albeit somewhat lower than before. In retrospect, such an optimistic view was quite naïve. I was unaware of the significant effects of certain demographic changes, i.e., rapid ageing and a lower fertility rate.16
As China’s population of prime-age workers stagnates, wages generally must rise, and the osmotic pull that low-cost labor exerts on foreign capital thus wanes. This reality is already beginning to systematically hamstring lower-tech portions of China’s manufacturing-led growth model. The country’s centrality to key global supply chains—such as electronics manufacturing and assembly—will, ceteris paribus, have an inertial effect that masks the early stages of lost global competitiveness.
That said, manufacturing wage increases in China, along with greater geopolitical tensions, will likely prompt multinational firms to move more of their supply chains outside the People’s Republic of China (PRC). The process will likely start gradually but then snowball as independent supply chain clusters emerge. To the extent that the production of goods moves closer to end-use consumers, the overall oil-intensity of those goods diminishes. For instance, goods produced in northern Mexico only require about half as much fuel per shipping container equivalent to reach midwestern U.S. markets compared to goods sourced from coastal Chinese manufacturing zones.17
Rapid aging of the population would challenge China’s oil demand growth in other ways as well. For instance, older consumers are, on average, less likely to purchase cars. And if they do, those vehicles are likely to be smaller and less gasoline-thirsty, because the need to haul children is less of a motivation than it would be for newlyweds 30 years younger.
End Results?
A Chinese oil demand slowdown would profoundly affect the multitrillion dollar global oil market, as well as many related industries—for instance, the long industrial value chain that underpins unconventional oil and gas resource development in the United States. Weaker oil consumption in China would also have outsized effects in the Middle East, Russia, Central Asia, Canada, and oil-exporting parts of Africa. If reduced oil use stems from an economic slowdown precipitated by the debt and demographic factors described above, Southeast Asia and other regions whose own growth prospects are materially tied to the PRC economy are also likely to slow.
While manufacturing shifts out of China will, all else held equal, likely boost oil usage in certain Southeast Asian countries, their ability to truly offset a demand slowdown in China is limited. In an industrialized (or industrializing) country, the largest portion of consumers’ oil footprint generally comes from personal cars and the associated gasoline usage. Personal cars use almost an order of magnitude more oil per capita than other activities (flying, package deliveries, food eaten, etc.).18
The data so far suggest that the China car boom will not be replicated in the members of the Association of Southeast Asian Nations (ASEAN).19 And to the extent that car sales grow, we’re likely to see smaller vehicles (and perhaps more electrified ones as well, although we need a couple more years of data to have high confidence in where the powertrain trends are going). Either or both of those factors tend to push toward a lower per capita oil intensity, and population growth is slowing across the region, so demographic growth leverage is reduced as well.
In these respects, a Chinese economic growth slowdown would illuminate just how fundamentally the PRC supports the commodity price levels so many resource-producing regions have become accustomed to since the early 2000s. In the early stages, the Middle East, parts of Latin America and Africa, and Russia plus countries in Central Asia were “resource-producing regions” with outsized exposure to China. Yet over the past decade, the shale boom arguably added the U.S. to that mix as well. The shift bears noting because while a longer-term slowdown in China’s economic growth likely empowers the U.S. in relative strategic terms, such a transition will cause—and perhaps already is causing—serious pain and dislocation in key U.S. oil and gas jurisdictions, Texas foremost among them.
China need not crash to a halt in economic terms to have a profound impact on oil markets. If China simply reverted to long-term oil demand growth rates closer to 1% (the global average of the past 20 years), oil markets expecting a rate three to five times higher would likely require tremendous adjustments. For perspective, consider that between 2010 and 2019, four world regions saw oil intensity (measured as barrels consumed per day per 1,000 persons’ population) grow at a rate exceeding the underlying rate of growth in their population (Figure 4).
Figure 4 — Oil Intensity Shifts Over the Past 50 Years in Key Global Regions
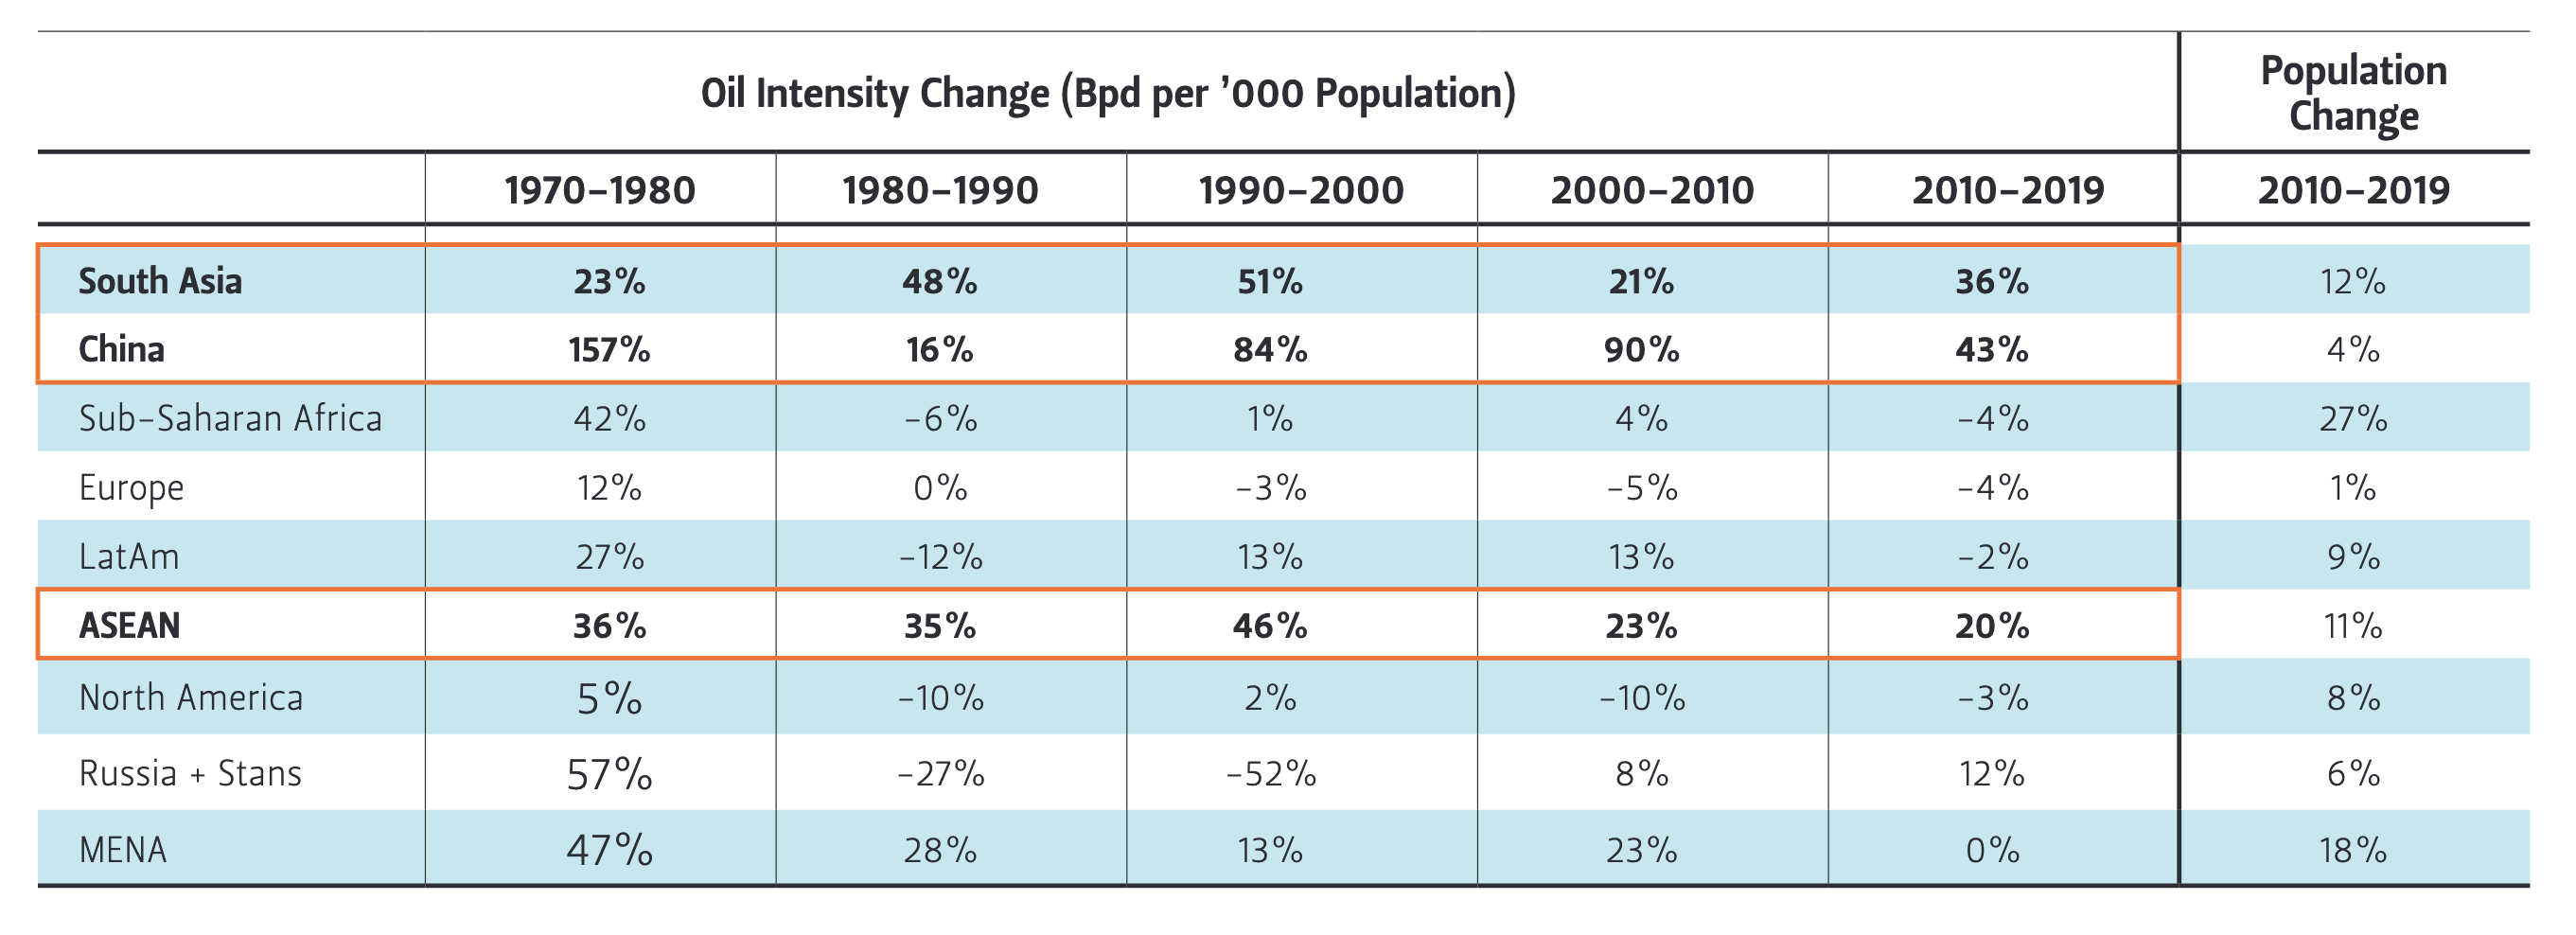
The first region is China itself, where oil intensity grew 10 times faster than the population. Regions two and three—including Russia plus countries in Central Asia and ASEAN—are ones whose economic prospects are deeply and obviously connected to China’s. South Asia is the fourth region, and while less tied to China than ASEAN, would still be substantially exposed to an economic slowdown in the PRC. Accordingly, a regression toward the historic global mean oil demand growth rate by China would likely portend a broader shift across the rest of Asia, which combined with China, has been the world’s prime mover of oil consumption growth for the past quarter century.
To be sure, this analysis focuses on the demand side of the equation. Supplyside pressure is a real prospect as well, and one that, ironically, is perhaps nearly as underappreciated as the China slowdown risk. For the better part of five years (and running), the global narrative has been one of a world awash in crude oil with additional waves incoming for future years. The flat NYMEX WTI futures curve amply reflects the “surplus mentality” prevalent amidst the shale boom, the coronavirus disruptions, and the intense uncertainty regarding the potential for transport electrification.
If capital investment in upstream oil projects turns out to have undershot what the world actually ends up needing to meet demand in 2021 and beyond, an additional bull cycle for oil prices is an entirely plausible prospect—even if China’s oil demand growth rate falls toward the longer-term global historical mean as debt, demographics, and other headwinds take their toll. But at this point in time, the China-centric portion of the global risk equation leans negative, and a key question is to what extent are the potential systemic effects of a Chinese economic and oil demand growth slowdown priced—or not— into global crude markets? “May you live in interesting times” is a curse for good reason.
Endnotes
1. Paul Krugman, “Will China’s Economy Hit a Great Wall?,” New York Times, 15 January 2019, https://www.nytimes. com/2019/01/15/opinion/will-chinaseconomy-hit-a-great-wall.html.
2. “Liquids” as measured by BP’s annual Statistical Review of World Energy and used in this analysis consist primarily of crude oil.
3. OPEC+ consists of the 10 OPEC member countries plus Azerbaijan, Bahrain, Brunei, Kazakhstan, Malaysia, Mexico, Oman, Russia, South Sudan, and Sudan. See Brian Wingfield, Samuel Dodge, Demetrios Pogkas and Cedric Sam, “New Decade, New OPEC Oil Curbs. Same Mixed Results,” Bloomberg, February 25, 2020, https://www.bloomberg.com/ graphics/opec-production-targets/.
4. I use the crocodile as an example both for the stealth and suddenness of its strike and for the fact that some Chinese archaeologists believe the crocodile was the source for the dragon images so omnipresent in China and Chinese culture today. See “Archeologists Find Crocodile is Prototype of Dragon,” People’s Daily, April 29, 2000, http://en.people.cn/english/200004/29/ eng20000429_40001.html.
5. Gabriel Collins and Andrew Erickson, “What If China Ceases To Be The Global ‘Oil Consumer of Last Resort?” China SignPost™ (洞察中国) 100, 13 November 13, 2019, https://www.chinasignpost.com/2019/11/13/ what-if-china-ceases-to-be-the-globaloil-consumer-of-last-resort/.
6. Wang Xiangwei, “China’s inward shift has profound implications for the world economy,” South China Morning Post, July 18, 2020, https://www.scmp.com/week-asia/ opinion/article/3093641/chinas-inwardshift-has-profound-implications-worldeconomy.
7. Logan Wright and Allen Feng, “COVID19 and China’s Household Debt Dilemma,” Rhodium Group, May 12, 2020, https://rhg. com/research/china-household-debt/.
8. Author’s estimate using data from the Bank for International Settlements. Currency conversion made using exchange rate data from “Yearly Average Currency Exchange Rates,” Internal Revenue Service, https:// www.irs.gov/individuals/internationaltaxpayers/yearly-average-currencyexchange-rates.
9. Atif R. Mian, Amir Sufi, and Emil Verner, “Household Debt and Business Cycles Worldwide,” NBER Working Paper no. 21581, issued in September 2015, revised in July 2016, https://www.nber.org/papers/w21581.
10. Marco Lombardi, Madhusudan Mohanty, and Ilhyock Shim, “The real effects of household debt in the short and long run,” BIS Working papers No. 607, January 2017, https://www.bis.org/publ/work607. pdf (analysis based on quarterly household data for secured and unsecured debts in 54 economies (23 AEs and 31 EMEs) during time period from 1Q1990 to 1Q2015).
11. Ibid.
12. Stella Yifan Xie and Mike Bird, “The $52 Trillion Bubble: China Grapples With Epic Property Boom,” Wall Street Journal, July 16, 2020, https://www.wsj.com/articles/ china-property-real-estate-boom-covidpandemic-bubble-11594908517.
13. Ibid.
14. Organization for Economic Co-operation and Development, Current Price Gross Domestic Product in China [CHNGDPNQDSMEI], retrieved from FRED, Federal Reserve Bank of St. Louis, July 24, 2020, https://fred.stlouisfed.org/series/ CHNGDPNQDSMEI; Household credit data obtained from “BIS Statistics Warehouse,” Bank for International Settlements, accessed August 5, 2020, https://stats. bis.org/#ppq=CBS_C_AND_OTH_EXP_ UR;pv=11~10,5,6~0,0,0~name.
15. Projection based on World Bank data.
16. Emphasis added. Charles Goodhart and Manoj Pradhan, “Demographics Will Reverse Three Multi-Decade Global Trends,” BIS Working Paper No. 656 (Basel, Switzerland: Bank for International Settlements, August 2017), 31, https://www. bis.org/publ/work656.pdf.
17. Gabe Collins, “Maquiladoras vs. the Pearl River Delta: A Snapshot of how Rising Wages in China Stand to Influence Global Oil Use Patterns by Moving Manufacturing Closer to Final Consumers,” China Oil Trader™, no. 12, January 17, 2013, http://www. chinaoiltrader.com/?p=350.
18. Gabriel Collins, “China’s Gasoline Demand Growth: Is Recent Deceleration Near-Term Noise or Early Stages of a Structural Shift?,” Baker Institute Research Presentation, March 2019, slides 9-10, https://www.bakerinstitute.org/media/files/ files/147628cc/ces-collins-china-gasolinedemand-032819.pdf.
19. See, for instance: “Indonesia Total Car Sales 1999-2020,” Trading Economics, accessed August 3, 2020, https:// tradingeconomics.com/indonesia/carregistrations.
This material may be quoted or reproduced without prior permission, provided appropriate credit is given to the author and Rice University’s Baker Institute for Public Policy. The views expressed herein are those of the individual author(s), and do not necessarily represent the views of Rice University’s Baker Institute for Public Policy.


