About The Map
What Does the Baker Institute China Energy Map Show?
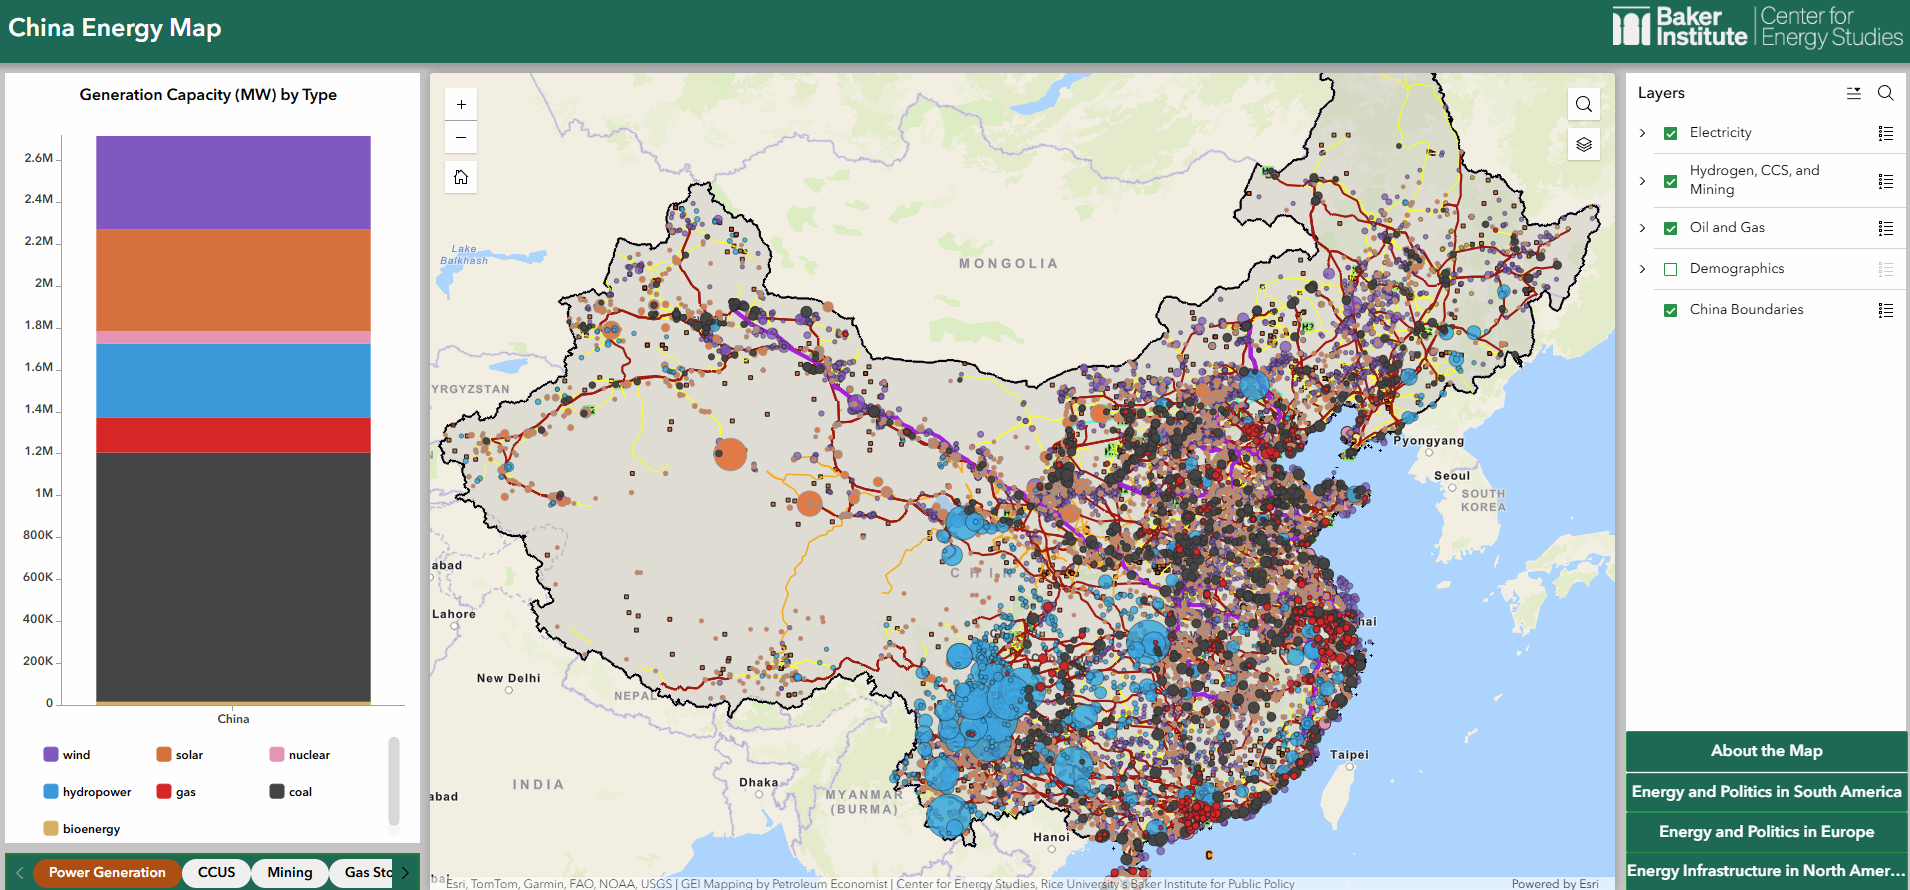
The China Energy Map is a comprehensive, interactive visualization of key energy infrastructure across China. Since its initial launch as the Baker Institute China Oil Map in February 2019, the map has expanded significantly in both scope and detail. The 2026 update further expands the map with new layers for high-voltage power transmission lines, GDP per capita, and population density.
Layers and Data Sources
As of May 2026, the map includes the layers below. Note that all infrastructure layers include announced, permitted, under construction, and operational facilities, excluding canceled, mothballed, and retired units.
Category | Layer name | Geometry | Description | Last Update | Source | |
Oil | Crude Pipelines | Line | Crude oil pipelines. If international, only the sections that are within the Chinese border are included, e.g., the Russia-China and Myanmar-China crude pipelines. The location accuracy of this layer falls into the medium range. We traced the pipeline routes by assigning and connecting each pump station at the centroid of cities or towns. | Apirl 2026 | Authors | |
Product Pipelines | Line | Refined product pipelines. The same mapping method was applied to this layer as the crude pipelines, thus the location accuracy of this layer should be deemed only descriptive and best displayed at the national and provincial levels. | Apirl 2026 | Authors | ||
Oil Storage | Point | Both crude oil and refined product storage facilities. Ninety-five percent of the facility coordinates in this layer are highly accurate. | Apirl 2026 | Authors | ||
Oil Refineries | Point | Petroleum refineries. The coordinates of each refinery are highly accurate. | Apirl 2026 | Authors | ||
Oil Ports | Point | Oil wharves and docking facilities. The coordinates are highly accurate. | Apirl 2026 | Authors | ||
Oil and Gas Fields | Point | Operating oil, gas, oil/gas production fields | May 2026 | |||
Gas | Natural Gas Pipelines | Line | Natural gas pipelines, both trunk and branch lines. The same mapping method was applied to this layer as the crude pipelines, thus the location accuracy of this layer should be deemed only descriptive and best displayed at the national and provincial levels. | Apirl 2026 | Authors | |
Natural Gas storage | Point | Existing natural gas storage facilities. Due to pripretary information, only facility status can be displayed. | Apirl 2026 | |||
LNG Terminals | Point | Liquefied natural gas (LNG) terminals. The coordinates are highly accurate. All the terminals are import terminals. The facility-level details include berths and storage breakdowns if available. | Apirl 2026 | Authors | ||
Power | Power Plants by Fuel | Point | Existing power plants with operator, fuel type and capacity details. Bubble color is assigned by fuel type, and the size of the bubble indicates the power plant nameplate capacity: | Aug 2025 | ||
High Voltage Power Transmission | Line | 2025 Power transmission network | March 2026 | |||
Emerging | EVB Factories | Point | Factory sites that manufacture batteries for electric vehicles. Ninety-four percent of the facility coordinates are highly accurate. Additional information on this layer includes ownership structure (domestic, foreign, or joint venture) and planned capacity additions in GWh (if any). | April 2026 | Authors | |
Hydrogen Facilities | Point | Hydrogen production projects. The coordinates are highly accurate. Facility level details currently include the type of hydrogen (grey, blue, green, etc.) | April 2026 | |||
Hydrogen Pipelines | Line | Hydrogen pipelines. | April 2026 | |||
CCS Projects | Point | Carbon capture and storage projects. | April 2026 | |||
Mining | Mining Properties | Point | Mining sites. Details include primary commodity, list of commodities, mill capacity, reserves and resources, if available. | April 2026 | ||
Demographics | GDP per capita | Polygon | Per capita gross domestic product (GDP) in China in 2024, by province or region(in yuan) | Augst 2025 | ||
Population Density | Polygon | Average population density in China in 2024, by province or region(in inhabitants per square kilometer) | October 2025 | |||
Urban Areas | Polygon | 2024 urban centers defined by GHSL-UCDB | November 2026 |
Future Directions
The data compiled and presented in the map to date account for a significant share of China’s known energy infrastructure capacity. We will continue to update the map regularly as new information becomes available, including updates to existing assets, newly constructed facilities, and infrastructure not previously identified.
Related Resources
For more regional maps and other research visualizations, please go to CES Data and Research Visualizations
Appendix 1: Data and Methodology
Data
For data developed by the authors, the sources included, but were not limited to:
- The 2012 China Petroleum Map by ARA International Limited (for names of pipelines and storage facilities);
- Bloomberg Professional Service(for names of refineries);
- The Oil and Gas Journal World Wide Refinery Survey 2018;
- 13th Five-Year Plan for Energy Development Appendix I and II (oil and gas) by China’s National Development and Reform Commission;
- 13th Five-Year Plan for Transportation system by China’s State Council;
- Infopetro.com;
- Global Energy Monitor;
- World Nuclear Association;
- China’s National Nuclear Safety Association;
- “White Lists” of EV battery suppliers in compliance with industry standards 1-4 in 2015 and 2016;
- bjx.com.cn(北极星儲能网);
- GlobalData;
- Capital IQ;
- Petroleum Economist; and
- Online press releases by operating companies.
Data displayed on the China Energy Map has been confirmed with multiple sources before mapping. Specifically, with the difficulties of tracking individual EV battery manufacturers, we verified each EVB facility with recent job postings in addition to company websites/lookup pages. The facility is omitted from the database if: 1) no factory sites are seen on the satellite image, 2) the address found indicates a suit/office building, or 3) the address refers to a previously established company.
Technical Framework
For data developed by authors, we created the initial list of facility names based on the sources listed above and built the database of China’s energy infrastructure using a deep internet search to collect as much facility-level information as possible. Relevant data included name, location (latitude/longitude coordinates), owner/operator, designed capacity, operating status, and the year the facility entered service.
We targeted infrastructure groups in oil, natural gas, electricity, and emerging energy technologies. The majority of data was extracted from individual press releases and news articles written in Mandarin Chinese. The specified facility capacity for oil infrastructure was generally converted from 10,000 metric tons (per year), which is conventional for the Chinese oil sector, to a thousand barrels (per day) using the CME Group conversion calculator, which uses a ratio of 7.33 barrels per metric ton of crude oil.
Next, we mapped individual infrastructure groups in vector layers (i.e., lines and points) with attribute information using ArcGIS Pro, ArcGIS Online, and Experience Builder.
1 https://www.cmegroup.com/tools-information/calc_crude.html
2024, released October 2024
In the 2024 update, we transitioned the map to ArcGIS Experience, enhancing usability and interactivity. The new interface features a right-hand sidebar with a search function and layer list, along with three main sections: 1) Map, 2) Key Stats, and 3) About.
2023, released March 24, 2023
- Crude oil pipelines: 101 pipelines with a total length of 25,943 km and total throughput capacity of 23 million barrels per day (MBD);
- Refined product pipelines: 89 pipelines with a total network length of 25,574 km and a total throughput capacity of 7.9 MBD;
- Oil refineries: 212 facilities with 23.1 MBD of processing capacity;
- Oil storage facilities: 299 facilities with approximately 1.23 billion barrels of total storage capacity (crude oil: 83 facilities with 871.9 million barrels of capacity; refined products: 216 facilities with 365.2 million barrels of capacity);
- Oil ports: 64 docking facilities for oil tankers with a total throughput capacity of 15.5 MBD;
- Natural gas pipelines: 414 pipelines with a total length of 110,433 km and total throughput capacity of 145 billion cubic feet per day (BCFD);
- LNG terminals: 78 facilities with 260 MTPA of capacity. 26 facilities are currently operational;
- Coal power plants: 3,703 power stations with a total installed capacity of 1,458 GW, 1,093 GW of which are currently in operation;
- Nuclear power plants: 151 reactors with a total installed capacity of 170 GW. 57 GW are operational;
- Natural gas power plants: 243 power plants with a total installed capacity of 168 GW. 113 GW are operational;
- EV battery factories: 319 facilities, 243 of which are online, 56 are under construction (greenfield) and 20 have been announced. This translates to a total manufacturing capacity of 2,676 GWh, of which 1,445 GWh are in operation; and
- Hydrogen facilities: 37 facilities, 23 of which are currently in operation.
Table 1 — China Energy Map Data Coverage Compared to Public Estimates
Indicators | China Energy Map Tabulated Capacity | Most Recent Publicly Available Capacity Estimate | Year of Estimate Baseline Data |
|---|---|---|---|
| Crude pipelines length (thousand km) | 25.9 | 31.0 | 2021 |
| Crude pipelines capacity (MBD) | 23 | 14.5 | 2018 |
| Refined pipelines length (thousand km) | 28.7 | 30.0 | 2021 |
| Refined pipelines capacity (MBD) | 7.9 | 4.9 | 2015 |
| Natural gas pipelines length (thousand km) | 110.4 | 116 | 2021 |
| Natural gas pipelines capacity (BCF/D) | 144.7 | 65 | 2017 |
| LNG terminals capacity (MTPA) | 260.1 | NA | |
| LNG terminals operating capacity (MTPA) | 97.2 | 99.1 | 2021 |
| Oil refineries capacity (MBD) | 23.1 | 18.5 | 2022 |
| Oil refineries operating capacity (MBD) | 21 | 20.3 | 2022 |
| Crude storage capacity (MBBL) | 872 | 760 | 2020 |
| Product storage capacity (MBBL) | 365 | NA | |
| Oil port throughout capacity (MBD) | 15.5 | NA | |
| Coal power plants operating capacity (GW) | 1093 | 1120 | 2022 |
| Natural gas power plants operating capacity (GW) | 113 | 114 | 2022 |
| Nuclear power plants operating capacity (GW) | 57 | 56 | 2022 |
| EV battery factories operating capacity (GWh) | 1445 | 1437 | 2023 |
| EV battery factories (number of units) | 319 | NA |
Sources: National Development and Reform Commission of China, http://www.ndrc.gov.cn/zcfb/zcfbtz/201701/W020170119333354977981.pdf;
Ruining Hou, January 16, 2019, https://www.jiemian.com/article/2798250.html;
Shivani Singh and Muyu Xu, Jan 16, 2020, Reuters, https://www.reuters.com/article/us-china-economy-output-oil/chinas-2019-and-december-crude-oil-runs-hit-record-highs-idUSKBN1ZG0AS;
Muyu Xu, Shu Zhang, and Devika Krishna Kumar, Feb 13, 2020, Reuters, https://www.reuters.com/article/us-china-health-oil-storage/stranded-tankers-full-storage-tanks-coronavirus-leads-to-crude-glut-in-china-idUSKBN2072NR;
China Electricity Council, March 21, 2022, https://cec.org.cn/detail/index.html?3-307614;
Bloomberg;
Oil. IN-EN.com, May 17, 2021, https://oil.in-en.com/html/oil-2919718.shtml.
------------------------------------------------------------------------------------------------------------------------------------------------------------
2022, released March 25, 2022
- Crude oil pipelines: 98 pipelines with a total length of 25,430 km and total throughput capacity of 23 million barrels per day (MBD);
- Refined product pipelines: 89 pipelines with a total network length of 28,686 km and a total throughput capacity of 7.9 MBD;
- Oil refineries: 210 facilities with 22.4 MBD of processing capacity;
- Oil storage facilities: 291 facilities with approximately 1.15 billion barrels of total storage capacity (crude oil: 76 facilities with 790.6 million barrels of capacity; refined products: 215 facilities with 361.1 million barrels of capacity);
- Oil ports: 62 docking facilities for oil tankers with a total throughput capacity of 15.5 MBD;
- Natural gas pipelines: 405 pipelines with a total length of 104,909 km and total throughput capacity of 138 billion cubic feet per day (BCFD);
- LNG terminals: 73 facilities with 220 MTPA of capacity. 24 facilities are currently operational;
- Coal power plants: 3,468 power stations with a total installed capacity of 1,307 GW, 1,047 GW of which are currently in operation;
- Nuclear power plants: 129 reactors with a total installed capacity of 112 GW. 51 GW are operational;
- Natural gas power plants: 189 power plants with a total installed capacity of 138 GW. 99 GW are operational;
- EV battery factories: 285 facilities, 220 of which are online, 50 are under construction (greenfield) and 15 have been announced. This translates to a total manufacturing capacity of 1,933 GWh, of which 844 GWh are in operation; and
- Hydrogen facilities: 29 facilities, 18 of which are currently in operation.
Table 1 — China Energy Map Data Coverage Compared to Public Estimates
Indicators | China Energy Map Tabulated Capacity | Most Recent Publicly Available Capacity Estimate | Year of Estimate Baseline Data |
|---|---|---|---|
| Crude pipelines length (thousand km) | 25.4 | 31.0 | 2020 |
| Crude pipelines capacity (MBD) | 23 | 14.5 | 2018 |
| Refined pipelines length (thousand km) | 28.7 | 32.0 | 2020 |
| Refined pipelines capacity (MBD) | 7.9 | 4.9 | 2015 |
| Natural gas pipelines length (thousand km) | 104.9 | 110 | 2021 |
| Natural gas pipelines capacity (BCF/D) | 138.1 | 65 | 2017 |
| LNG terminals capacity (MTPA) | 220.4 | NA | |
| Oil refineries capacity (MBD) | 22.7 | 17.3 | 2019 |
| Crude storage capacity (MBBL) | 791 | 760 | 2020 |
| Product storage capacity (MBBL) | 360 | NA | |
| Oil port throughput capacity (MBD) | 15.3 | NA | |
| Coal power plants operating capacity (GW) | 1,047 | 1,110 | 2022 |
| Natural gas power plants operating capacity (GW) | 99 | 108 | 2022 |
| Nuclear power plants operating capacity (GW) | 51 | 53 | 2022 |
| EV battery factories operating capacity (GWh) | 844 | 569 | 2021 |
| EV battery factories (number of units) | 285 | NA |
Sources: National Development and Reform Commission of China, http://www.ndrc.gov.cn/zcfb/zcfbtz/201701/W020170119333354977981.pdf;
Ruining Hou, January 16, 2019, https://www.jiemian.com/article/2798250.html;
Shivani Singh and Muyu Xu, Jan 16, 2020, Reuters, https://www.reuters.com/article/us-china-economy-output-oil/chinas-2019-and-december-crude-oil-runs-hit-record-highs-idUSKBN1ZG0AS;
Muyu Xu, Shu Zhang, and Devika Krishna Kumar, Feb 13, 2020, Reuters, https://www.reuters.com/article/us-china-health-oil-storage/stranded-tankers-full-storage-tanks-coronavirus-leads-to-crude-glut-in-china-idUSKBN2072NR;
China Electricity Council, March 21, 2022, https://cec.org.cn/detail/index.html?3-307614;
Bloomberg;
Oil. IN-EN.com, May 17, 2021, https://oil.in-en.com/html/oil-2919718.shtml.
------------------------------------------------------------------------------------------------------------------------------------------------------------
2021, released April 2, 2021
- Crude oil pipelines: 98 pipelines with a total length of 25,430 km and total throughput capacity of 23 million bpd (MBD);
- Refined product pipelines: 89 pipelines with a total network length of 28,686 km and a total throughput capacity of 7.9 MBD;
- Oil refineries: 210 facilities with 22.7 MBD of processing capacity;
- Oil storage facilities: 292 facilities with approximately 1.15 billion barrels of total storage capacity (crude oil: 76 facilities with 790.6 million barrels of capacity; refined products: 216 facilities with 360.2 million barrels of capacity);
- Oil ports: 61 docking facilities for oil tankers with a total throughput capacity of 15.3 MBD;
- Coal power plants: 3,090 power stations with a total installed capacity of 1,215 GW, 1,033 GW of which are currently in operation;
- Nuclear power plants:124 reactors with a total installed capacity of 106 GW. 48 GW are operational; and
- EV battery factories:243 facilities, 217 of which are online, 22 are under construction and 9 have been announced. This translates to a total manufacturing capacity of 1,083 GWh, of which 559 GWh are in operation.
Table 1 — China Energy Map Data Coverage Compared to Public Estimates
Indicators | China Energy Map Tabulated Capacity | Most Recent Publicly Available Capacity Estimate | Year of Estimate Baseline Data |
|---|---|---|---|
| Crude pipelines length (thousand km) | 25.4 | 29.0 | 2019 |
| Crude pipelines capacity (MBD) | 23.0 | 14.5 | 2018 |
| Refined pipelines length (thousand km) | 28.7 | 29.0 | 2019 |
| Refined pipelines capacity (MBD) | 7.9 | 4.9 | 2015 |
| Oil refineries capacity (MBD) | 22.7 | 17.3 | 2019 |
| Crude storage capacity (MBBL) | 791 | 760 | 2020 |
| Product storage capacity (MBBL) | 360 | N/A | |
| Oil port throughout capacity (MBD) | 15.3 | N/A | |
| Coal power plants operating capacity (GW) | 1033 | 1080 | 2021 |
| Nuclear power plants operating capacity (GW) | 48 | 51 | 2021 |
| EV battery factories operating capacity (GWh) | 559 | 569 | 2021 |
| EV battery factories (number of units) | 243 | N/A |
Sources: National Development and Reform Commission of China, http://www.ndrc.gov.cn/zcfb/zcfbtz/201701/W020170119333354977981.pdf;
Ruining Hou, January 16, 2019, https://www.jiemian.com/article/2798250.html;
Shivani Singh and Muyu Xu, Jan 16, 2020, Reuters, https://www.reuters.com/article/us-china-economy-output-oil/chinas-2019-and-december-crude-oil-runs-hit-record-highs-idUSKBN1ZG0AS;
Muyu Xu, Shu Zhang, and Devika Krishna Kumar, Feb 13, 2020, Reuters, https://www.reuters.com/article/us-china-health-oil-storage/stranded-tankers-full-storage-tanks-coronavirus-leads-to-crude-glut-in-china-idUSKBN2072NR;
China Electricity Council, March 19, 2021, https://cec.org.cn/detail/index.html?3-294515.
Bloomberg.
------------------------------------------------------------------------------------------------------------------------------------------------------------
2020 Q2, released July 10, 2020
- Crude oil pipelines: 98 pipelines with a total length of 25,430 km and total throughput capacity of 23 million bpd (MBD);
- Refined product pipelines: 87 pipelines with a total network length of 27,945 km and a total throughput capacity of 7.7 MBD;
- Oil refineries: 208 facilities with 22.3 MBD of processing capacity;
- Oil storage facilities: 288 facilities with approximately 1.12 billion barrels of total storage capacity (crude oil: 74 facilities with 764.3 million barrels of capacity; refined products: 214 facilities with 359.4 million barrels of capacity);
- Oil ports: 61 docking facilities for oil tankers with a total throughput capacity of 15.3 MBD;
- Coal power plants: 2,956 power stations with a total installed capacity of 1,145 GW, 997 GW of which are currently in operation;
- Nuclear power plants:114 reactors with a total installed capacity of 95 GW. 45 GW are operational; and
- EV battery factories:185 facilities, 176 of which are online, 8 are under construction and 1 has been announced.
Table 1 — China Energy Map Data Coverage Compared to Public Estimates
Indicators | China Energy Map Tabulated Capacity | Most Recent Publicly Available Capacity Estimate | Year of Estimate Baseline Data |
|---|---|---|---|
| Crude pipelines length (thousand km) | 25.4 | 28.7 | 2017 |
| Crude pipelines capacity (MBD) | 23.0 | 14.5 | 2018 |
| Refined pipelines length (thousand km) | 27.9 | 27.2 | 2017 |
| Refined pipelines capacity (MBD) | 7.7 | 4.9 | 2015 |
| Oil refineries capacity (MBD) | 22.7 | 17.3 | 2019 |
| Crude storage capacity (MBBL) | 764 | 760 | 2020 |
| Product storage capacity (MBBL) | 359 | N/A | |
| Oil port throughout capacity (MBD) | 15.3 | N/A | |
| Coal power plants operating capacity (GW) | 997 | 1040 | 2019 |
| Nuclear power plants operating capacity (GW) | 45 | 49 | 2019 |
| EV battery factories (number of units) | 185 | N/A |
Sources: National Development and Reform Commission of China, http://www.ndrc.gov.cn/zcfb/zcfbtz/201701/W020170119333354977981.pdf;
Ruining Hou, January 16, 2019, https://www.jiemian.com/article/2798250.html;
Shivani Singh and Muyu Xu, Jan 16, 2020, Reuters, https://www.reuters.com/article/us-china-economy-output-oil/chinas-2019-and-december-crude-oil-runs-hit-record-highs-idUSKBN1ZG0AS;
Muyu Xu, Shu Zhang, and Devika Krishna Kumar, Feb 13, 2020, Reuters, https://www.reuters.com/article/us-china-health-oil-storage/stranded-tankers-full-storage-tanks-coronavirus-leads-to-crude-glut-in-china-idUSKBN2072NR;
China Electricity Council, April 26, 2020, https://www.cec.org.cn/detail/index.html?1-281670.
------------------------------------------------------------------------------------------------------------------------------------------------------------
2020 Q1, released March 11, 2020
- Crude oil pipelines: 98 pipelines with a total length of 25,430 km and total throughput capacity of 23 million bpd (MBD);
- Refined product pipelines: 87 pipelines with a total network length of 27,945 km and a total throughput capacity of 7.7 MBD;
- Oil refineries: 208 facilities with 22.3 MBD of processing capacity;
- Oil storage facilities: 287 facilities with approximately 1.06 billion barrels of total storage capacity (crude oil: 74 facilities with 706.1 million barrels of capacity; refined products: 213 facilities with 357 million barrels of capacity); and
- Oil Ports: 59 docking facilities for oil tankers with a total throughput capacity of 15.3 MBD.
Table 1 — China Oil Map Data Coverage Compared to Public Estimates
Indicators | China Oil Map Tabulated Capacity | Most Recent Publicly Available Capacity Estimate | Year of Estimate Baseline Data |
|---|---|---|---|
| Crude pipelines length (thousand km) | 25.4 | 28.7 | 2017 |
| Crude pipelines capacity (MBD) | 23.0 | 14.5 | 2018 |
| Refined pipelines length (thousand km) | 27.9 | 27.2 | 2017 |
| Refined pipelines capacity (MBD) | 7.7 | 4.9 | 2015 |
| Oil refineries capacity (MBD) | 22.3 | 17.3 | 2019 |
| Crude storage capacity (MBBL) | 706.1 | 760.0 | 2020 |
| Product storage capacity (MBBL) | 357.0 | N/A | |
| Oil port throughout capacity (MBD) | 15.3 | N/A |
Sources: National Development and Reform Commission of China, http://www.ndrc.gov.cn/zcfb/zcfbtz/201701/W020170119333354977981.pdf;
Ruining Hou, January 16, 2019, https://www.jiemian.com/article/2798250.html;
Shivani Singh and Muyu Xu, Jan 16, 2020, Reuters, https://www.reuters.com/article/us-china-economy-output-oil/chinas-2019-and-december-crude-oil-runs-hit-record-highs-idUSKBN1ZG0AS;
Muyu Xu, Shu Zhang, and Devika Krishna Kumar, Feb 13, 2020, Reuters, https://www.reuters.com/article/us-china-health-oil-storage/stranded-tankers-full-storage-tanks-coronavirus-leads-to-crude-glut-in-china-idUSKBN2072NR.
------------------------------------------------------------------------------------------------------------------------------------------------------------
2019 Q4, released December 9, 2019
China Oil Map is updated with new attribute information within individual facilities, but the statistic summary remains unchanged from the Q3 version.
------------------------------------------------------------------------------------------------------------------------------------------------------------
2019 Q3, released September 11, 2019
- Crude oil pipelines: 98 pipelines with a total length of 25,430 km and total throughput capacity of 20.01 million bpd (MBD);
- Refined product pipelines: 80 pipelines with a total network length of 27,337 km and a total throughput capacity of 6.4 MBD;
- Oil refineries: 205 facilities with 22.3 MBD of processing capacity;
- Oil storage facilities: 285 facilities with approximately 1.06 billion barrels of total storage capacity (crude oil: 73 facilities with 706.1 million barrels of capacity; refined products: 211 facilities with 355.4 million barrels of capacity); and
- Oil Ports: 59 docking facilities for oil tankers with a total throughput capacity of 15.3 MBD.
Table 1 — China Oil Map Data Coverage Compared to Public Estimates
Indicators | China Oil Map Tabulated Capacity | Most Recent Publicly Available Capacity Estimate | Year of Estimate Baseline Data |
|---|---|---|---|
| Crude pipelines length (thousand km) | 25.4 | 27.0 | 2015 |
| Crude pipelines capacity (MBD) | 20.0 | 10.6 | 2015 |
| Refined pipelines length (thousand km) | 27.3 | 21.0 | 2015 |
| Refined pipelines capacity (MBD) | 6.4 | 4.9 | 2015 |
| Oil refineries capacity (MBD) | 22.3 | 16.7 | 2018 |
| Crude storage capacity (MBBL) | 706.1 | N/A | |
| Product storage capacity (MBBL) | 355.4 | N/A | |
| Oil port throughout capacity (MBD) | 15.3 | N/A |
Sources: National Development and Reform Commission of China, http://www.ndrc.gov.cn/zcfb/zcfbtz/201701/W020170119333354977981.pdf;
Ruining Hou, January 16, 2019, https://www.jiemian.com/article/2798250.html.
------------------------------------------------------------------------------------------------------------------------------------------------------------
2019 Q2, released June 1, 2019
- Crude oil pipelines: 95 pipelines with a total length of 24,389 km and total throughput capacity of 19.04 million bpd (MBD);
- Refined product pipelines: 80 pipelines with a total network length of 26,180 km and a total throughput capacity of 5.8 MBD;
- Oil refineries: 201 facilities with 21.1 MBD of processing capacity;
- Oil storage facilities: 283 facilities with approximately 1.06 billion barrels of total storage capacity (crude oil: 72 facilities with 702.3 million barrels of capacity; refined products: 211 facilities with 355.4 million barrels of capacity); and
- Oil Ports: 56 docking facilities for oil tankers with a total throughput capacity of 15.05 MBD
Table 1 — China Oil Map Data Coverage Compared to Public Estimates
Indicators | China Oil Map Tabulated Capacity | Most Recent Publicly Available Capacity Estimate | Year of Estimate Baseline Data |
|---|---|---|---|
| Crude pipelines length (thousand km) | 24.4 | 27.0 | 2015 |
| Crude pipelines capacity (MBD) | 19.0 | 10.6 | 2015 |
| Refined pipelines length (thousand km) | 26.2 | 21.0 | 2015 |
| Refined pipelines capacity (MBD) | 5.8 | 4.9 | 2015 |
| Oil refineries capacity (MBD) | 21.1 | 16.7 | 2018 |
| Crude storage capacity (MBBL) | 702.3 | N/A | |
| Product storage capacity (MBBL) | 355.4 | N/A | |
| Oil port throughput capacity (MBD) | 15.0 | N/A |
Sources: National Development and Reform Commission of China, http://www.ndrc.gov.cn/zcfb/zcfbtz/201701/W020170119333354977981.pdf;
Ruining Hou, January 16, 2019, https://www.jiemian.com/article/2798250.html.
------------------------------------------------------------------------------------------------------------------------------------------------------------
2019 Q1, released February 25, 2019 (Original version)
- Crude oil pipelines: 95 pipelines with a total length of 24,389 km and total throughput capacity of 19.04 million bpd (MBD);
- Refined product pipelines: 80 pipelines with a total network length of 26,180 km and a total throughput capacity of 5.8 MBD;
- Oil refineries: 194 facilities with 18.6 MBD of processing capacity; and
- Oil storage facilities: 278 facilities with approximately 1 billion barrels of total storage capacity (crude oil: 68 facilities with 661.6 million barrels of capacity; refined products: 210 facilities with 352.2 million barrels of capacity)
Table 1: China Oil Map Data Coverage Compared to Public Estimates
Indicators | China Oil Map Tabulated Capacity | Most Recent Publicly Available Capacity Estimate | Year of Estimate Baseline Data |
|---|---|---|---|
| Crude pipelines length (thousand km) | 24.4 | 27.0 | 2015 |
| Crude pipelines capacity (MBD) | 19.0 | 10.6 | 2015 |
| Refined pipelines length (thousand km) | 26.2 | 21.0 | 2015 |
| Refined pipelines capacity (MBD) | 5.8 | 4.9 | 2015 |
| Oil refineries capacity (MBD) | 18.6 | 16.7 | 2018 |
| Crude storage capacity (MBBL) | 662.0 | N/A | |
| Product storage capacity (MBBL) | 352.0 | N/A |
Sources: National Development and Reform Commission of China, http://www.ndrc.gov.cn/zcfb/zcfbtz/201701/W020170119333354977981.pdf;
Ruining Hou, January 16, 2019, https://www.jiemian.com/article/2798250.html.