About the Platform
The challenge of resilience in border cities
Border cities leverage their privileged commercial proximity to the US market for economic growth, but this advantage is consistently offset by a significant socio-environmental cost. This tension between development and environmental impacts has fundamentally altered the community dynamics of border populations.
Local governments have responded by creating public policy tools such as urban resilience plans and climate risk assessment to address the challenges of industrial expansion. Yet, densely populated areas or those near industry remain highly vulnerable.
This dashboard offers key information to restore equity and citizen participation, while simultaneously enabling public and private sectors to integrate a social approach into environmental policy and corporate social responsibility during infrastructure and urban development planning in a new climate reality.
Objective
The primary aim of this tool is to facilitate access to environmental and social data, thereby enhancing planning and ensuring equity in key development activities. This includes issuing permits, establishing new industrial zones, developing infrastructure/transport projects, and assessing impacts related to community health and climate vulnerability.
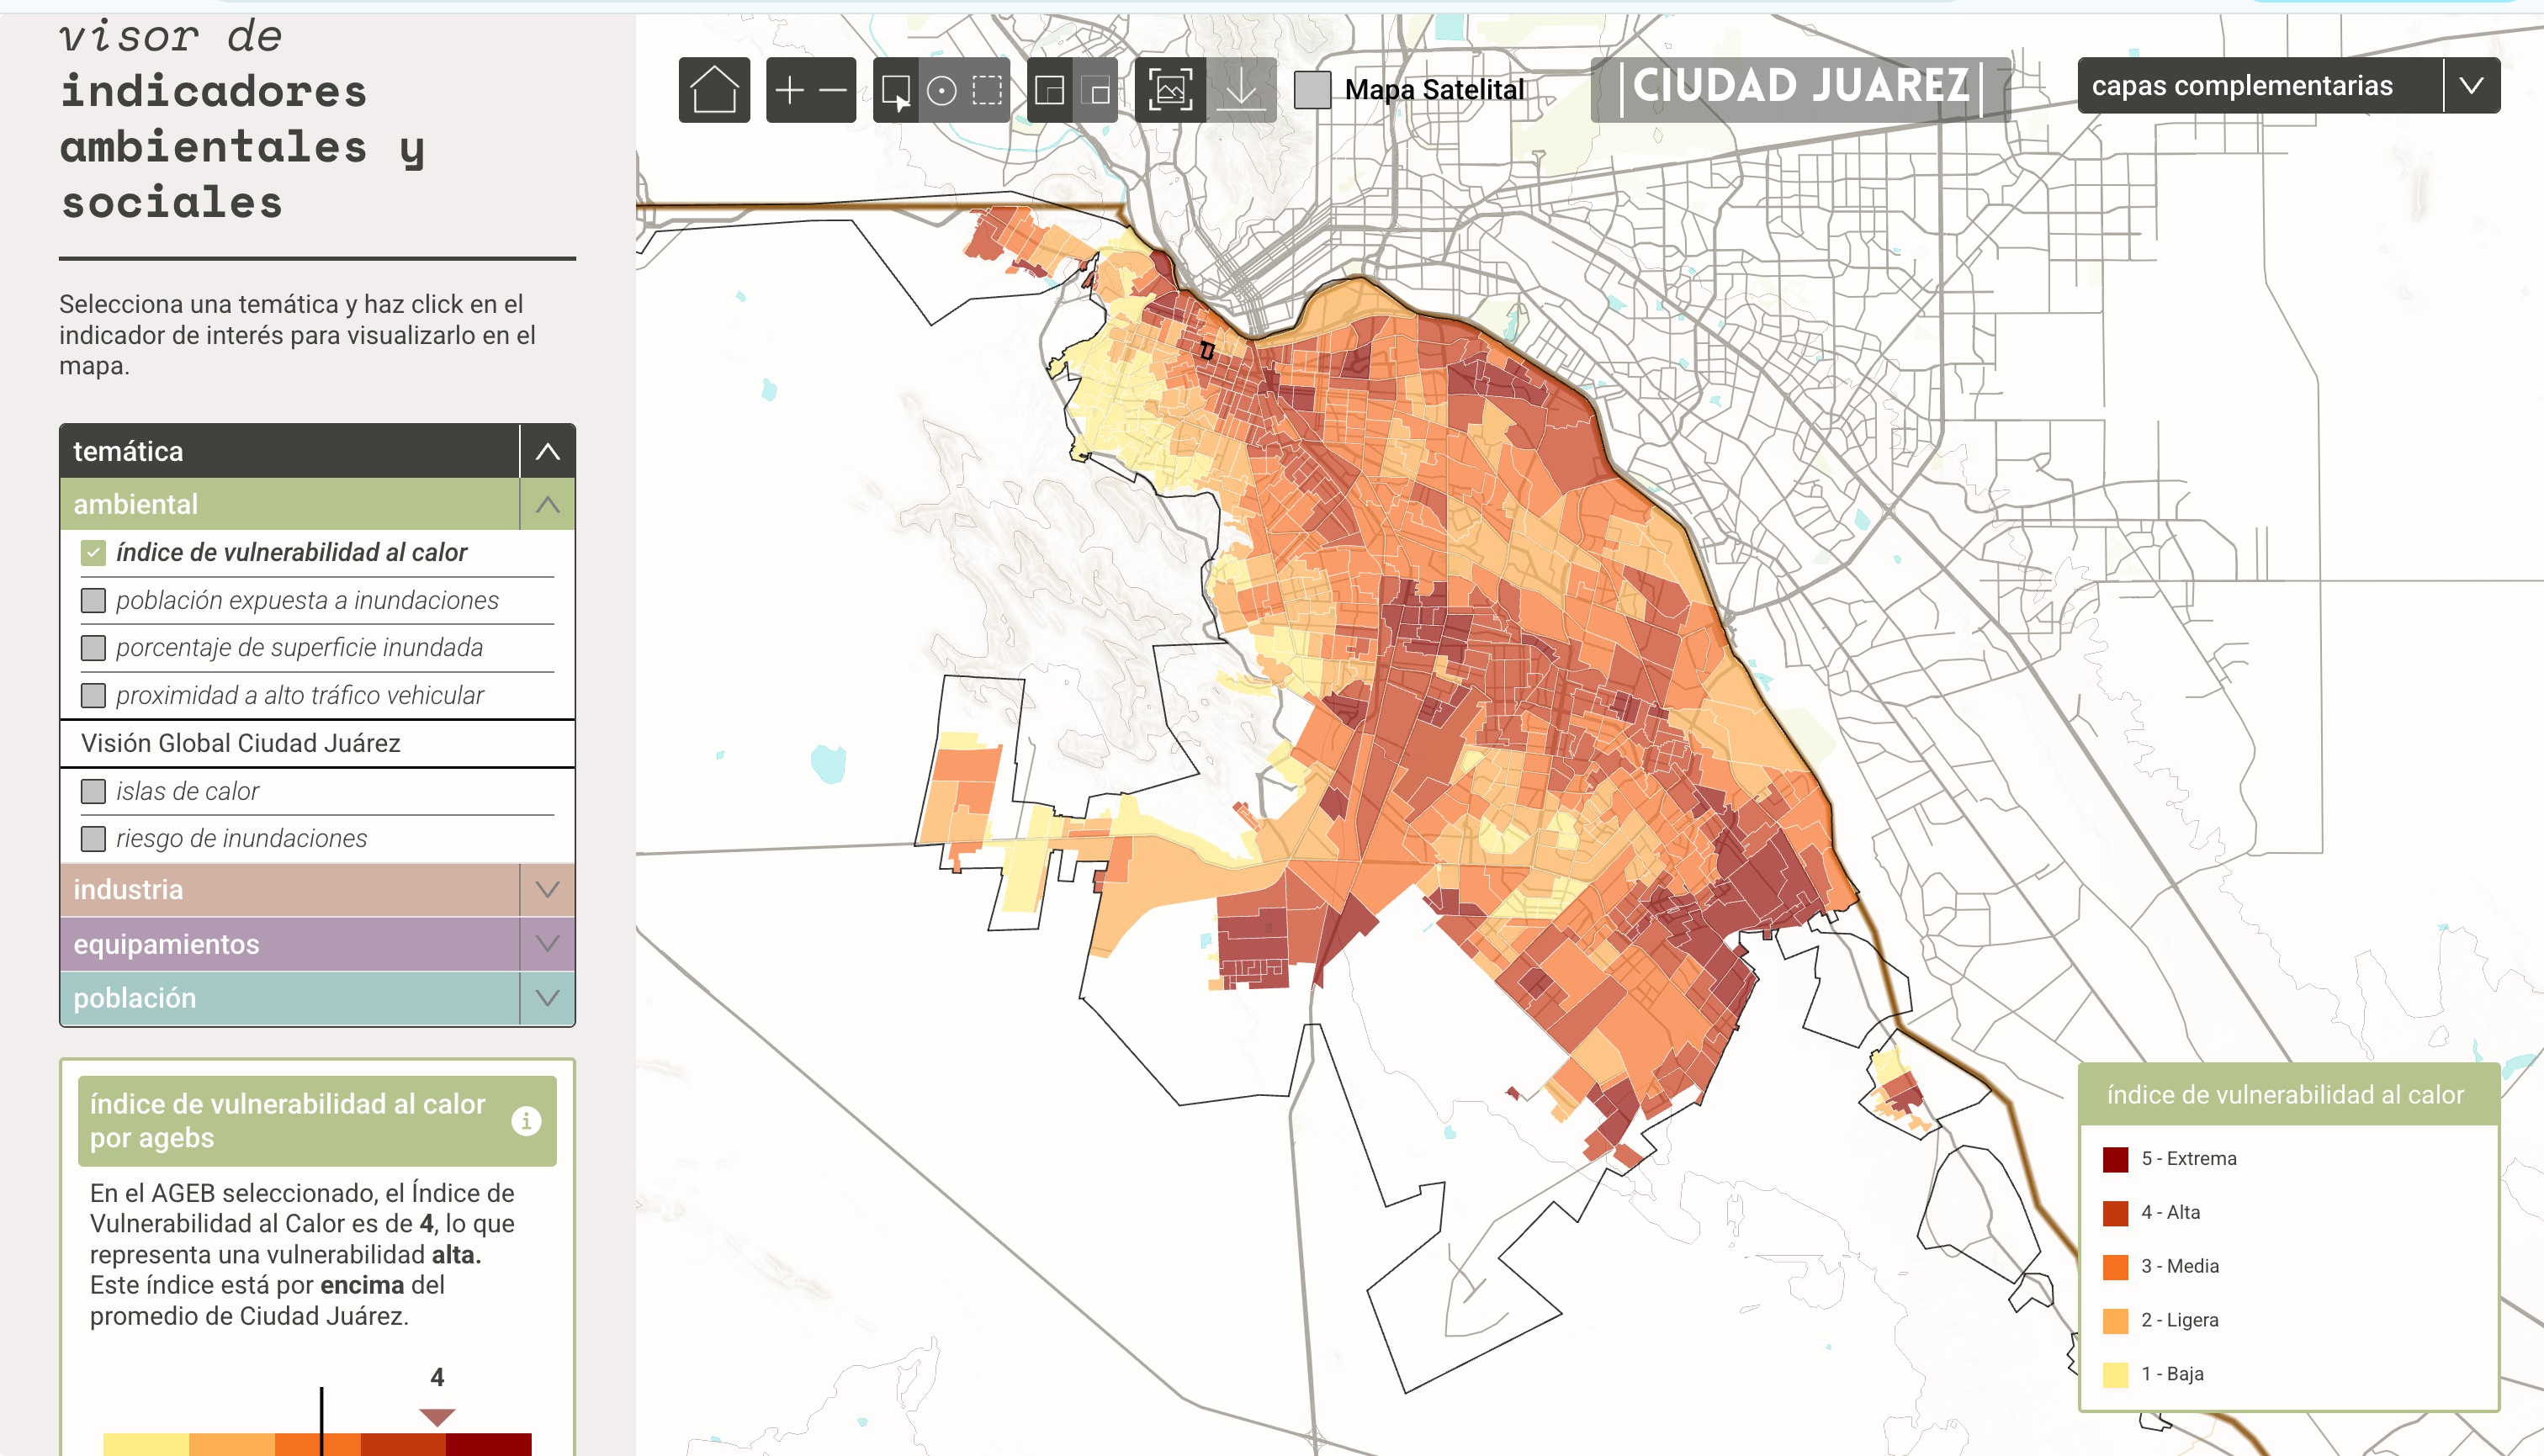
The real value of the dashboard of environmental and social indicators is its capacity to expose undocumented vulnerabilities. These critical, unformalized risks show issues like polluting industries in marginalized areas, unregulated hazardous waste disposal, poor air quality affecting sensitive populations, and limited access to green spaces and ecosystem services.
By providing this crucial data, the tool enables the design of more equitable and targeted environmental and development policies based on citizens' real needs.
How Can We Use The Tool?
Visualize
- Browse the map within the viewer and enable thematic layers to display key information and compare indicators related to environmental issues, industrial pollution, access to services, and population demographics.
- View information for the entire city, select a specific census track (AGEB) or neighborhood, or draw a polygon in an area of interest.
- Consult the dynamic cards that compare the values of each indicator with Ciudad Juárez, including sources of information and methodology.
Compare
- Visualize indicators by area to analyze specific situations.
- Select different geographic areas to make comparisons and print reports.
Making Informed Decisions
- Quickly identify the situation of different urban areas and compare it with Ciudad Juárez to define priorities.
- Select one or more areas where indicators are automatically recalculated, providing clear evidence to support decision-making and identify vulnerability.
- Generate a comparative report with maps and tables that allow contrasting areas and communicate data for recommendations and decision-making.