
In April 2020, COVID-19 was on the verge of overwhelming several regions of the United States. Temporary hospitals were constructed. Portable refrigeration units were used as morgues. Hospital beds, medical resources, and personal protective equipment (PPE), were in short supply.
At this point in the pandemic, New York, New Jersey, and Connecticut were experiencing the highest daily death rates in the country. New York suffered average daily death rates as high as 1,000 deaths per day (over 50 deaths per million residents).
Simultaneously, other parts of the nation were barely affected by COVID-19. Sixteen states had average daily death rates of fewer than one per million residents. In states like Montana, Utah, and Wyoming, the average rate was lower than 0.25 daily deaths per million residents.1
In response to the pandemic, all states enacted policies intended to “flatten the curve” and prevent the spread of COVID-19. However, not all states enacted the same policies to contain the disease. While certain states enforced strict lockdowns, other states remained relatively open and imposed few restrictions on their residents.
After seven months of the pandemic, we examine states’ varying responses: How varied were states’ responses to COVID-19, and how did these responses change over time? Was there an association between the strictness of lockdowns and lower COVID-19 death rates? Simultaneously, how was the strictness of lockdowns related to unemployment rates?
Methodology
To understand the relationship between lockdowns and COVID-19, we analyzed the correlation between two variables: the openness of states (OoS) and daily deaths per million residents (DDPM) due to COVID-19.
Openness of States (OoS)
In our analysis, “openness” refers to the absence of restrictions imposed on residents as part of a state’s COVID-19 response. To examine the openness of individual states over time, we used an index developed by WalletHub.2 WalletHub is a personal finance website that is tracking the openness of states as part of its broader reporting on the economy to inform consumers.
WalletHub’s openness index evaluates America’s 50 states (+DC) on a 100-point weighted scale, with a score of 100 representing zero restrictions related to COVID-19. A state’s openness score is lowered for each restriction it enacts, and the score is reduced proportionally to the severity of each restriction enacted. For instance, imposing a requirement to wear a face mask in public results in a 7.14-point deduction, while state-issued guidance for assisted living facilities related to COVID-19 results in only a 1.79-point deduction.3
Table 1 — Relative Openness of States Over Time (Higher Means More Open)
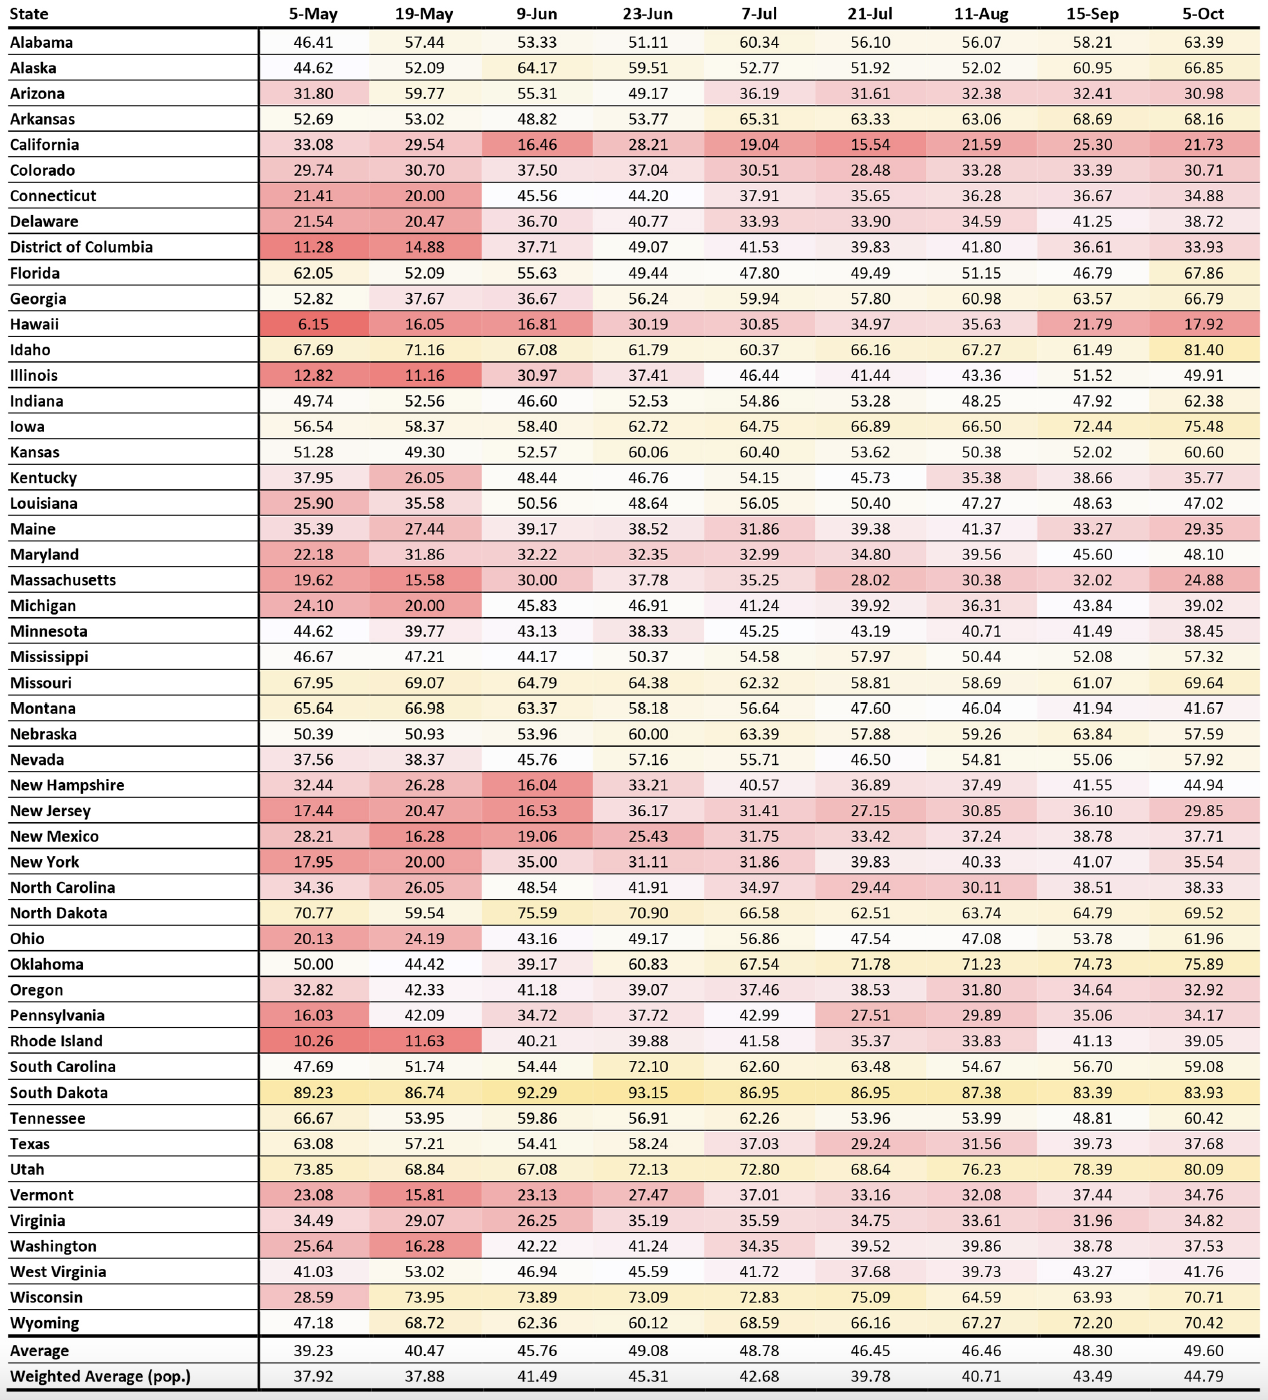
Note The table above displays the nine score tables published by WalletHub, beginning on May 5 and ending on Oct. 5. We used color to indicate higher and lower levels of openness. Red tones correspond to lower levels of openness, while orange tones respond to higher levels of openness.
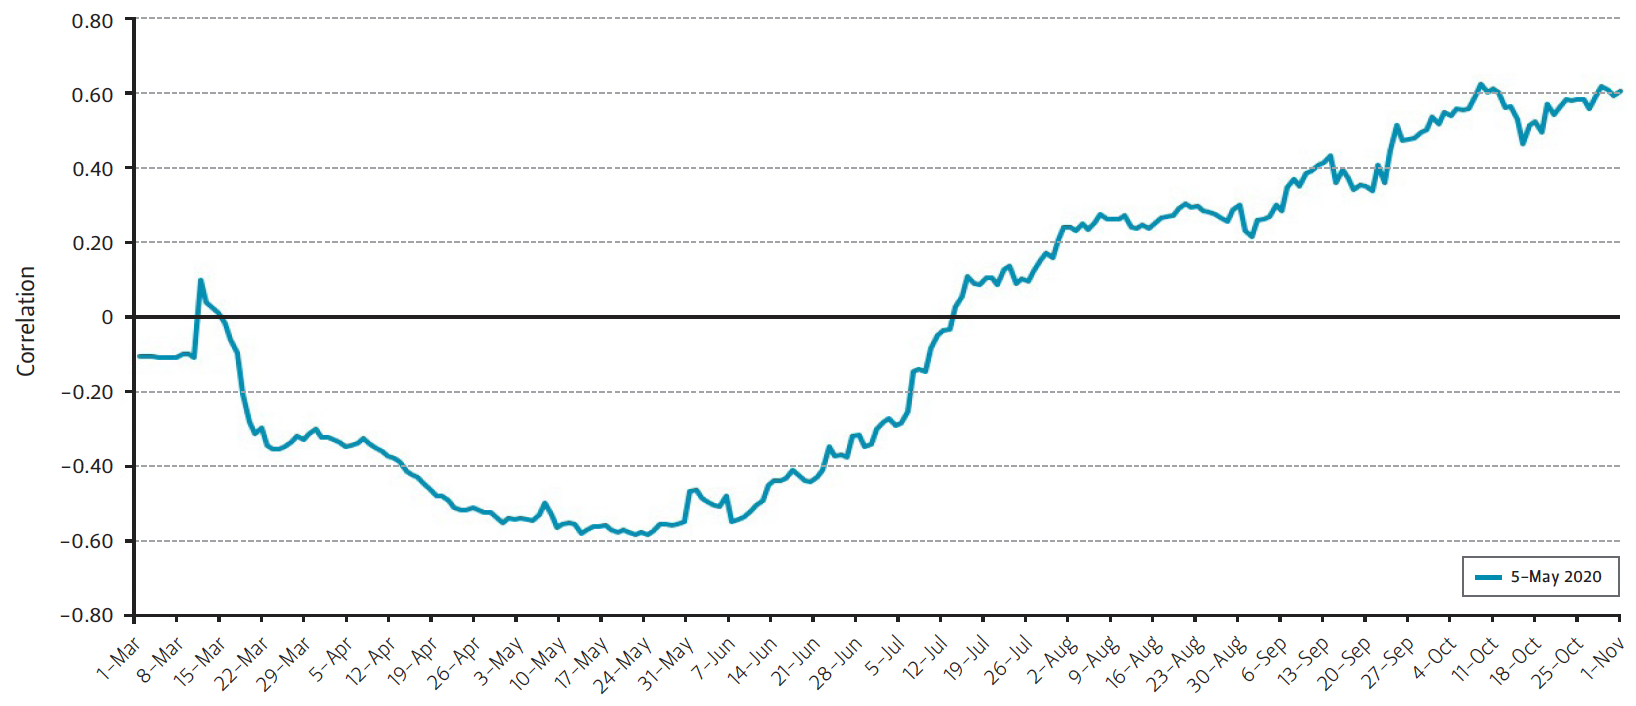
Figure 1 — Correlation Between a State’s Level of Openness on May 5, 2020 and the State’s Seven-Day Average Death Rate Per Capita Over Time
Between March 1 and November 1, WalletHub published nine score tables based on this index. Each of these score tables reflected states’ openness on a specific date. In our analysis, we represent these score tables as “OoS[Date].” For example, we use the term “OoSMay 5” to represent the openness of states as of May 5, 2020, according to WalletHub’s evaluation.
By compiling those score tables and arranging them chronologically, we were able to establish a data set which tracked changes in the openness of all 50 states (+DC) over the course of the pandemic.
Table 1 indicates the openness or restrictiveness of each of the states over time. Orange indicates the most open states while dark red indicates the most restricted states across all measurement periods. The color spectrum runs from dark red to light red, to yellow, to orange. As seen in the chart, South Dakota has remained open, as indicated by the orange shading across all dates. By contrast, Hawaii and California have remained relatively closed throughout the pandemic, as indicated by the various shades of red.
Daily Deaths Per Million (DDPM)
DDPM refers to the seven-day average number of daily deaths occurring in a state per million residents. To evaluate DDPM, we relied upon Johns Hopkins’ COVID-19 data4 and the U.S. Census Bureau’s 2019 state population estimates.5
The Johns Hopkins’ data set reported total deaths per state from January 22–November 1. To correct for variations in tracking and reporting schedules between states, we began our analysis on March 1 and converted Johns Hopkins’ raw data into a seven-day moving average of daily deaths in each state. Then, using state populations as reported by the U.S. Census Bureau, we translated those seven-day moving averages into state-by-state per capita daily death rates.
After merging these two data sets, we plotted the correlation between the OoS on a specific measurement date and DDPM over time. Figure 1 plots the correlation between the openness of states on May 5 (OoSMay 5) and DDPM on each day between March 1 and November 1. By visualizing the correlation between OoS and DDPM over time, we were able to gain insight into the complex relationship between state restrictions on any given date and daily death rates between March 1 and November 1.
Figure 2 — Correlation Between a State’s Level of Openness and the State’s Seven-Day Average Death Rate per Capita Over Time (See Legend Date)

Lockdowns & Death Rates
Figure 2 displays the correlations between each of the nine OoS score tables published by WalletHub and DDPM from March 1 to November 1. The pattern in this data—an initial strong negative correlation which gradually adjusts to a strong positive correlation—suggests that DDPM and OoS are mutually dependent variables. They share a dynamic causal relationship in which each variable behaves like the dependent variable and the independent variable at different moments in time. Through this chart, we see the dominance between DDPM and OoS shift over time.
A Timeline of the Pandemic in Data
Period 0: Prior to March 17
Period 0 corresponds to the period of time prior to the first shelter-in-place order in the United States, which took effect in six Bay Area counties on March 17.6 The correlation between DDPM and OoS is weak to nonexistent and there is no discernable pattern in the data.
Period 1: DDPM Dictates Openness
During the initial phases of the pandemic, we found a strong negative correlation between DDPM and openness. The higher a state’s DDPM in March and April, the more likely the state was to adopt strict restrictions by May 5.
During this period, the severity of a state’s COVID-19 death rate dictated its level of openness/closure. States like New York, Connecticut, and Massachusetts that experienced high COVID-19 death rates responded to those deaths by reducing their openness (i.e., they adopted strict lockdown policies). Conversely, states with low DDPM, like South Dakota, Wyoming, and Alaska, remained relatively open and adopted few restrictions.
Consequently, states with high levels of openness were strongly associated with low death rates, and vice versa.
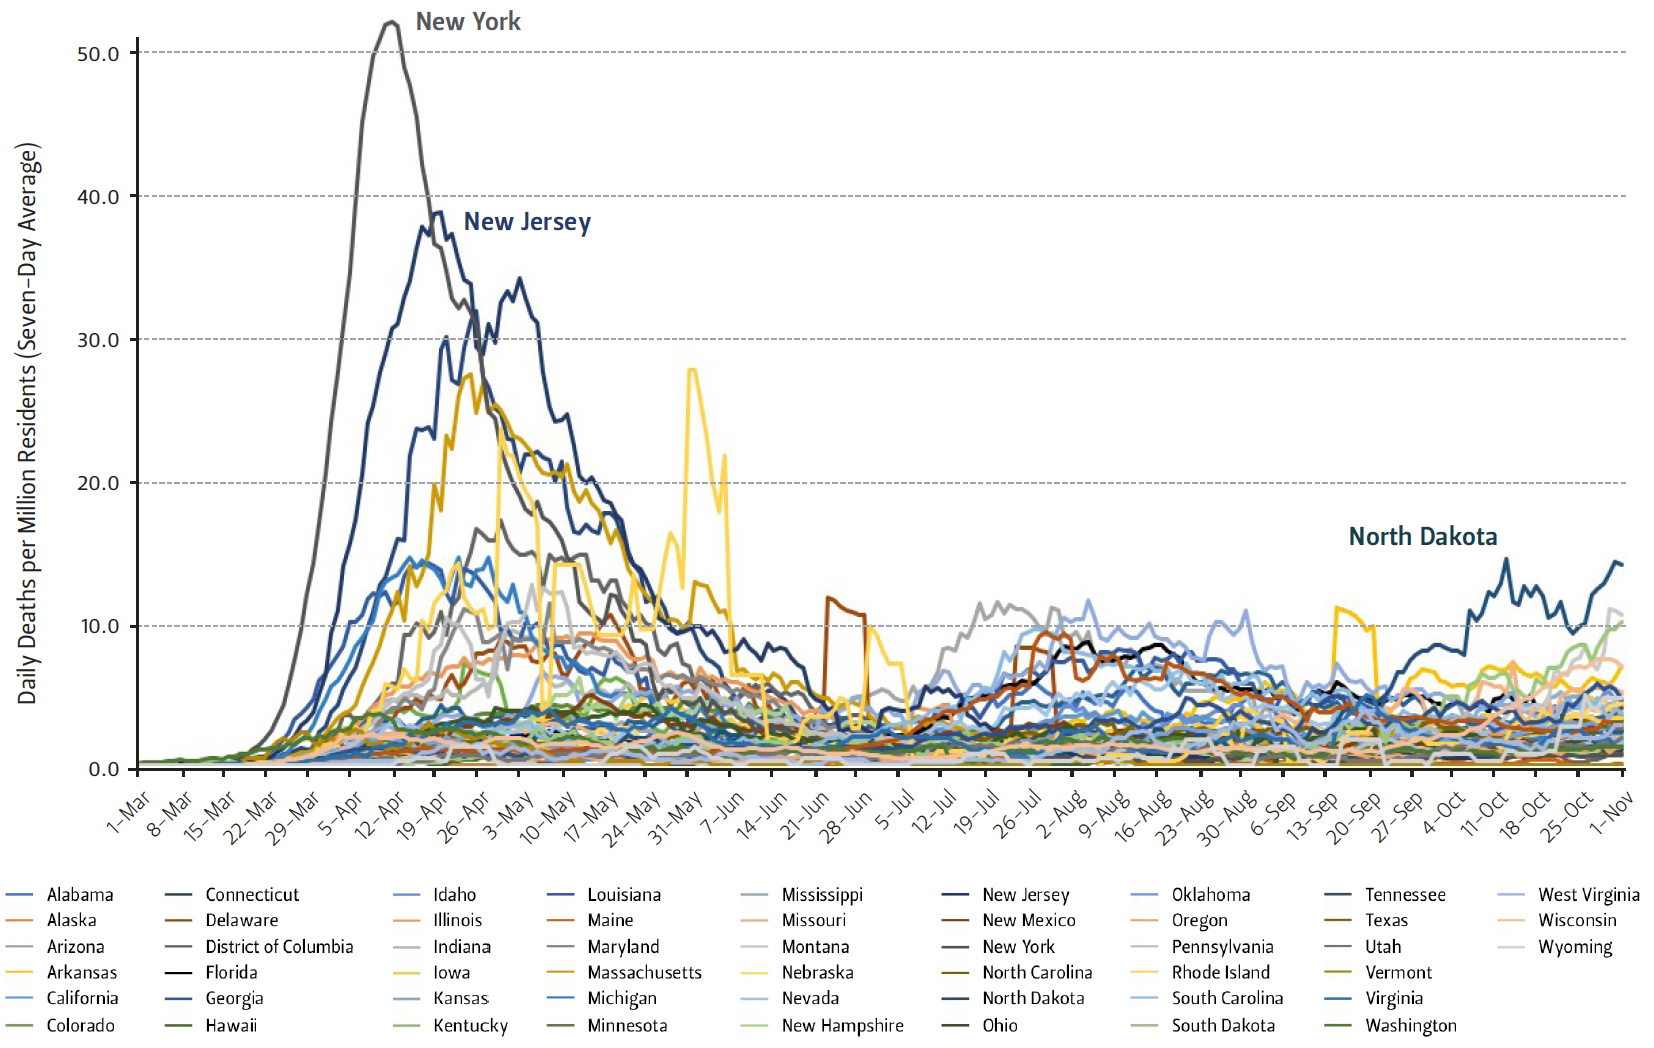
Figure 3 — Daily COVID-19 Deaths by State per Million Residents
Period 2: The Inflection Period
In the second half of May, the correlation between DDPM and OoS began to flip.
After introducing strict statewide closures, states that were heavily impacted by COVID-19, like New York and New Jersey, saw reductions in their average daily death rates. Although their death rates were still high compared to the national average, their daily death rates steadily declined.
Simultaneously, less-impacted states relaxed or sustained relatively open policies. Although their daily death rates were still low compared to the national average, these states, as a whole, began to experience increases in their DDPM.
As DDPM declined in closed states while rising in open states, the negative correlation between openness and DDPM declined in significance until it briefly equaled zero.
In early July, a positive correlation emerged, meaning low daily death rates were more likely in states with more restrictions.
Period 3: Openness Dictates DDPM
By October, we found a strong positive correlation between DDPM and openness. In fact since July, the correlation between DDPM and openness has not only remained positive but also strengthened.
Figure 3 reveals that no states have recently experienced death rates comparable to those endured by New York in early April. As of November 1, North Dakota had the highest DDPM in the country with a rate of 14.1 deaths per million residents (about one-fourth of the value of New York’s peak DDPM).
Still, the increasingly strong relationship between high levels of openness and high DDPM suggests that lockdowns have been effective in both reducing DDPM in highly infected states and in preventing new spikes in deaths. Additionally, this trend implies that states that are more open are susceptible to higher COVID-19 death rates. This will likely be the pattern until better treatments are developed or herd immunity is achieved.
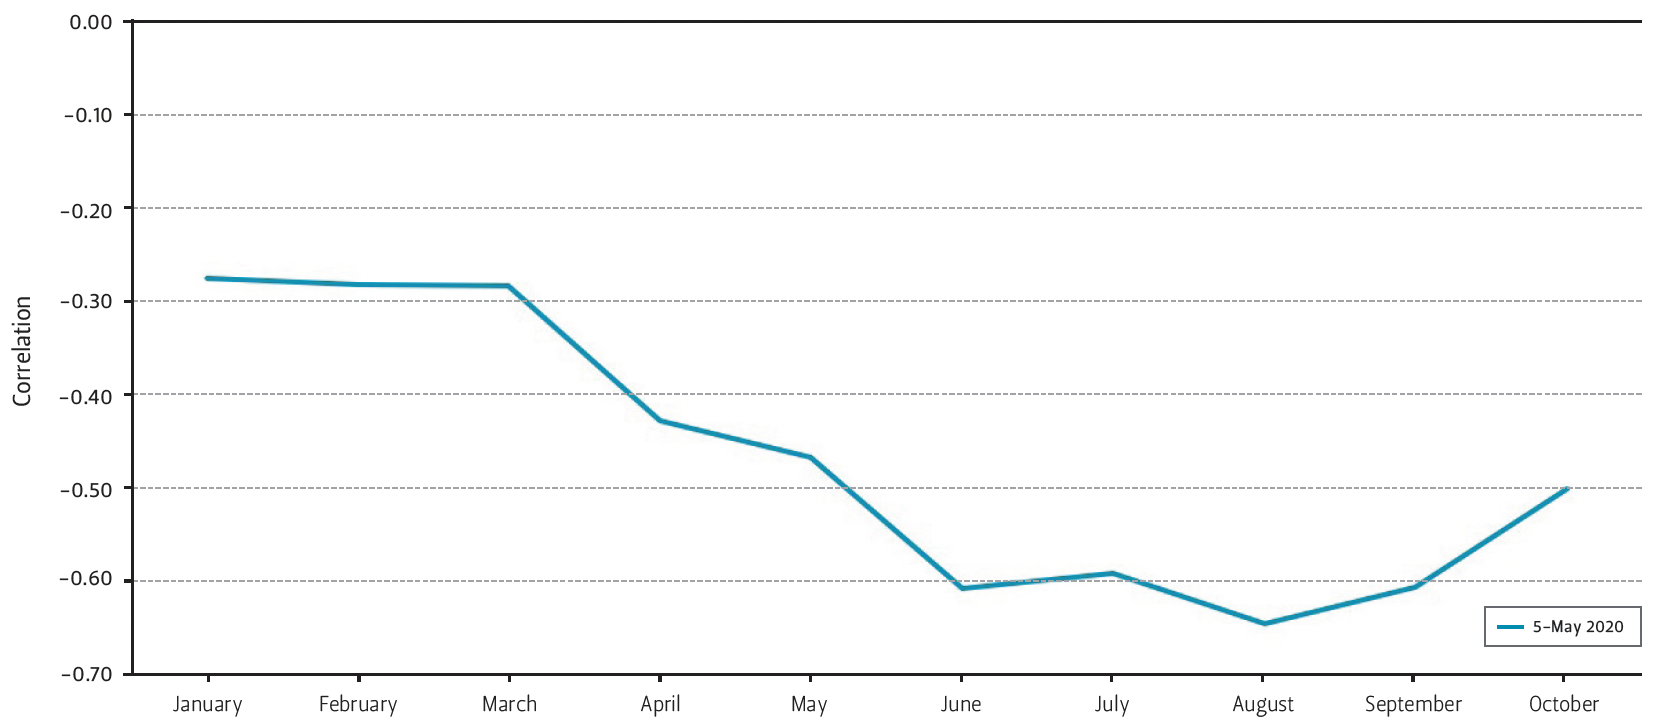
Figure 4 — The Correlation Between a State’s Openness Level on May 5, 2020 and the State’s Unemployment Rate
Lockdowns & Unintended Consequences
Lockdowns produce consequences besides lower DDPM. Decreases in openness correlate with higher levels of unemployment. Based on unemployment data collected by the U.S. Bureau of Labor Statistics, the correlation between OoSMay 5 and state unemployment rates in Figure 4 is direct, immediate, and as strong as that of DDPM.7 OoSMay 5 shows a change in correlation with state unemployment starting in April and growing in strength through August.
By shutting down large portions of the economy, lockdowns were accompanied by the failure of many businesses and a massive increase in unemployment. Research by Chetty, Friedman, Hendren, Stepner, and the Opportunity Insights Team shows increases in unemployment began in late March, as consumer spending among the affluent decreased.8
While the entire country has been affected by the pandemic, low-income and middle-income workers have been disproportionately impacted.9 As a result of furloughs, layoffs, and general economic retraction, as many as 8 million Americans have fallen into poverty since the pandemic began.10
Unemployment also has consequences beyond economics. Research conducted during the pandemic indicates unemployed Americans are at an increased risk for mental health-related illness.11 Researchers are also exploring the relationship between the pandemic and increases in substance abuse12 and domestic violence,13 though these findings are disputed and require further investigation.
Additionally, the education gap between high-income, middle-income, and low-income children has dramatically grown since the pandemic pushed schooling out of the classroom and onto the internet. Low-income and middle-income students are falling behind in school, while high-income students are moving ahead of schedule.14
Findings, Conclusions & Frontiers
States, Openness, and COVID-19
The correlation between openness in states and death rates follows the same pattern whether one is examining state restrictions in place on May 5 or on a subsequent date. However, the correlation is strongest for restrictions in place on May 5. That is, the blue line in Figure 2 is generally the lowest line through early July, then generally becomes the highest line through the end of the study period. This distinction highlights the importance of initial conditions: early lockdowns are most closely associated with reduced death rates. Perhaps the number of COVID-19 cases avoided by lockdowns at the start of a pandemic are the most important for reduction in ultimate disease spread.
It is also possible that stricter May 5 lockdowns imposed in response to higher death rates reflect greater recognition among the local population of the harmful effects of COVID-19, which have persisted through the fall. That is, we cannot rule out the possibility that the local population’s fear in the early days of COVID-19 determined both the strictness of state-imposed lockdowns and subsequent COVID-19 death rates, with no direct causal link between state actions and subsequent observed deaths. In fact, economists have found that legal restrictions explain only 7 percentage points of the 60 percentage point decline in foot traffic measured by cell phone activity through mid-May.15 The study attributes the vast majority of the decline in foot traffic to consumers choosing of their own volition to avoid commercial activity.
The same cautionary note can be applied to the data in Figure 4. The strong correlation between reduced openness and higher unemployment rates could appear because public fear gave public leaders more leeway to enforce restrictions in hard-hit states while also causing consumers to continue refraining from commercial activity.
Addressing the COVID-19 pandemic is complex. While lockdowns may have been effective at reducing DDPM, they are also associated with considerable harms. These harms do not necessarily outweigh the benefits of lockdowns, particularly in regions faced with rising daily death rates. Rather, they demand nuanced and calculated responses from policymakers who must consider the holistic impact of COVID-19 on their constituents. Consequently, we should anticipate that state governments will adopt varied responses to the pandemic based on the relative abundance of COVID-19 in their region and the risks facing their constituents.
This analysis also opens a compelling frontier for future research. While this research examines lockdown policies in totality, the association between individual lockdown elements and either DDPM or unemployment rates has yet to be studied. Further research could reveal which aspects of state-level lockdowns are most strongly associated with lower daily death rates. This research should focus on Periods 2 and 3, when OoS is more clearly associated with DDPM.
Perhaps most importantly, it is possible that the aspects of closure which are associated with decelerating COVID-19 death rates are different from the factors that determine higher unemployment rates. A state mask mandate likely has little to no impact on unemployment rates, while it is generally accepted to be impactful in lowering the death rate. Conversely, a different mandate may minimally impact death rates while having a strong negative impact on unemployment rates. Further research could inform future COVID-19 responses to help maximally reduce daily deaths while minimizing the negative socioeconomic impacts.
WalletHub’s Openness Index Factors
WalletHub employed 17 factors to compare the openness of the 50 states and the District of Columbia. Each factor had its own scoring system ranging from a score of 0 to 1. If a state was completely open, it received a score of 1 and was awarded all the points for that factor; a state with a score of 0.5 would receive half the points for that factor; and a state that was completely closed received a score of 0, with the state awarded no points for that factor. The final sum total of the scored and weighted factors ranged from 0 to 100, where 0 represented a completely closed state and 100 a completely open state. This became the state’s Openness Score.
Half Weight Factors — 1.79 Points
- Enforcement or Penalties for COVID-19 Legislation Non-Compliance
- Guidance on Elective Medical Procedures
- Guidance for Assisted Living Facilities Related to COVID-19
- Workplace Temperature Screening
Full Weight Factors — 3.57 Points
- Presence of Mandated Contact Tracing Program
- Presence of Multistate Agreements to Reopen
- State Guidance on Customer Health Checks at Restaurants
- Travel Restrictions
Double Weight Factors — 7.14 Points
- Legislation on Business Immunity from COVID-19 Claims
- Reopening of Non-Essential Businesses
- Requirement to Wear A Face Mask in Public
- State Court Closure or Suspension
- Statewide School Restart
- Working from Home Requirements/Recommendations
Triple Weight Factors — 10.71 Points
- Large Gatherings Restrictions
- Strictness of “Shelter in Place” Order
Quadruple Weight Factors — 14.29 Points
- Reopening of Restaurants and Bars
Endnotes
1. “Impact of Opening and Closing Decisions by State,” Johns Hopkins Coronavirus Resource Center, accessed November 19, 2020, https://coronavirus.jhu.edu/data/state-timeline.
2. Adam McCann, “States with the Fewest Coronavirus Restrictions,” WalletHub, October 6, 2020, https://wallethub.com/edu/states-coronavirus-restrictions/73818.
3. McCann, “States with the Fewest Coronavirus Restrictions.”
4. “Impact of Opening and Closing Decisions in Alabama,” Johns Hopkins Coronavirus Resource Center, https://coronavirus.jhu.edu/data/state-timeline.
5. “2019 National and State Population Estimates,” United States Census Bureau, updated December 30, 2019, https://www.census.gov/newsroom/press-kits/2019/national-state-estimates.html.
6. Kate Eby, “Coronavirus Timeline: Tracking Major Moments of COVID-19 Pandemic in San Francisco Bay Area,” ABC7 San Francisco, updated November 27, 2020, https://abc7news.com/6047519/.
7. U.S. Bureau of Labor Statistics, “Economic News Releases,” accessed November 19, 2020, https://www.bls.gov/bls/newsrels.htm#OEUS.
8. “The Economic Impacts of COVID-19: Evidence from a New Public Database Built Using Private Sector Data," Nber Working Paper 27431, Opportunity Insights (November 2020), https://opportunityinsights.org/paper/tracker/.
9. Kim Parker, Rachel Minkin, and Jesse Bennett, “Economic Fallout From COVID-19 Continues To Hit Lower-Income Americans the Hardest,” Pew Research Center’s Social & Demographic Trends Project, September 24, 2020, https://www.pewsocialtrends.org/2020/09/24/economic-fallout-from-covid-19-continues-to-hit-lower-income-americans-the-hardest/.
10. Stefan Sykes, “8 Million Americans Slipped into Poverty amid Coronavirus Pandemic, New Study Says,” NBC News, October 16, 2020, https://www.nbcnews.com/news/us-news/8-million-americans-slipped-poverty-amid-coronavirus-pandemic-new-study-n1243762.
11. Jenna M. Wilson et al., “Job Insecurity and Financial Concern During the COVID- 19 Pandemic Are Associated With Worse Mental Health,” Journal of Occupational & Environmental Medicine 62, no. 9 (September 2020): 686–91, https://doi.org/10.1097/JOM.0000000000001962.
12. Simona Zaami, “New Trends of Substance Abuse During COVID-19 Pandemic: An International Perspective,” Frontiers in Psychiatry 11 (2020): 4.
13. Megan L. Evans, Margo Lindauer, and Maureen E. Farrell, “A Pandemic within a Pandemic — Intimate Partner Violence during Covid-19,” New England Journal of Medicine (September 16, 2020), https://doi.org/10.1056/NEJMp2024046.
14. Laura Fay, “New Data Suggest Pandemic May Not Just Be Leaving Low- Income Students Behind; It May Be Propelling Wealthier Ones Even Further Ahead,” The 74, September 7, 2020, https://www.the74million.org/article/new-data-suggests-pandemic-may-not-just-be-leaving-low-income-students-behind-it-may-be-propelling-wealthier-ones-even-further-ahead/.
15. Austan Goolsbee and Chad Syverson, “Fear, Lockdown, and Diversion: Comparing Drivers of Pandemic Economic Decline 2020,” working paper, National Bureau of Economic Research (June 2020), https://www.nber.org/papers/w27432.
References
Chetty, Raj, John Friedman, Nathaniel Hendren, Michael Stepner, and The Opportunity Insights Team. “The Economic Impacts of COVID-19: Evidence from a New Public Database Built Using Private Sector Data." Working Paper no. 27431. Opportunity Insights (November 2020). https://opportunityinsights.org/paper/tracker/.
Eby, Kate. “Coronavirus Timeline: Tracking Major Moments of COVID-19 Pandemic in San Francisco Bay Area.” ABC7 San Francisco, last updated November 27, 2020. https://abc7news.com/6047519/.
Evans, Megan L., Margo Lindauer, and Maureen E. Farrell. “A Pandemic within a Pandemic — Intimate Partner Violence during Covid-19.” New England Journal of Medicine (September 16, 2020). https://doi.org/10.1056/NEJMp2024046.
Fay, Laura. “New Data Suggest Pandemic May Not Just Be Leaving Low-Income Students Behind; It May Be Propelling Wealthier Ones Even Further Ahead.” The 74, September 7, 2020. https://www.the74million.org/article/new-data-suggests-pandemic-may-not-just-be-leaving-low-income-students-behind-it-may-be-propelling-wealthier-ones-even-further-ahead/.
Goolsbee, Austan, and Chad Syverson. “Fear, Lockdown, and Diversion: Comparing Drivers of Pandemic Economic Decline 2020.” Working paper, National Bureau of Economic Research (June 2020). https://www.nber.org/papers/w27432.
Johns Hopkins Coronavirus Resource Center. “Impact of Opening and Closing Decisions by State,” accessed November 19, 2020. https://coronavirus.jhu.edu/data/state-timeline.
McCann, Adam. “States with the Fewest Coronavirus Restrictions.” WalletHub, October 6, 2020. https://wallethub.com/edu/states-coronavirus-restrictions/73818.
Parker, Kim, Rachel Minkin, and Jesse Bennett. “Economic Fallout From COVID- 19 Continues To Hit Lower-Income Americans the Hardest.” Pew Research Center’s Social & Demographic Trends Project, September 24, 2020. https://www.pewsocialtrends.org/2020/09/24/economic-fallout-from-covid-19- continues-to-hit-lower-income-americans-the-hardest/.
Sykes, Stefan. “8 Million Americans Slipped into Poverty amid Coronavirus Pandemic, New Study Says.” NBC News, October 16, 2020. https://www.nbcnews.com/news/us-news/8-million-americans-slipped-poverty-amid-coronavirus-pandemic-new-study-n1243762.
U.S. Bureau of Labor Statistics. “Economic News Releases." Economic Releases, accessed November 19, 2020. https://www.bls.gov/bls/newsrels.htm#OEUS.
U.S. Census Bureau. “2019 National and State Population Estimates.” Press Kits, accessed November 19, 2020. https://www.census.gov/newsroom/press-kits/2019/national-state-estimates.html.
Wilson, Jenna M., Jerin Lee, Holly N. Fitzgerald, Benjamin Oosterhoff, Bariş Sevi, and Natalie J. Shook. “Job Insecurity and Financial Concern During the COVID- 19 Pandemic Are Associated With Worse Mental Health.” Journal of Occupational & Environmental Medicine 62, no. 9 (September 2020): 686–91. https://doi.org/10.1097/JOM.0000000000001962.
Zaami, Simona. “New Trends of Substance Abuse During COVID-19 Pandemic: An International Perspective.” Frontiers in Psychiatry 11 (2020): 4.
This material may be quoted or reproduced without prior permission, provided appropriate credit is given to the author and Rice University’s Baker Institute for Public Policy. The views expressed herein are those of the individual author(s), and do not necessarily represent the views of Rice University’s Baker Institute for Public Policy.

