
By Elena Marks, Shao-Chee Sim, Vivian Ho and Philomene Balihe
In September 2015, just before the third open enrollment period of the Affordable Care Act’s (ACA) Health Insurance Marketplace was about to open, we surveyed Texans ages 18 to 64 to assess their confidence level in understanding the basic terminology about health insurance plans. Our data show that approximately one-quarter of adult Texans lacked confidence in their understanding of some of the most basic health plan terms, including premium and co-payment. Uninsured Texans were significantly more likely to report a lack of confidence in understanding health plan terminology than their insured counterparts. White Texans generally reported greater confidence than Black respondents. Hispanic respondents reported the least confidence in their understanding of health plan terminology.
About the Survey
The Health Reform Monitoring Survey (HRMS) is a quarterly survey of adults ages 18-64 that began in 2013. It is designed to provide timely information on implementation issues under the ACA and to document changes in health insurance coverage and related health outcomes. HRMS provides quarterly data on health insurance coverage, access, use of health care, health care affordability, and self-reported health status. The HRMS was developed by the Urban Institute, conducted by GfK, and jointly funded by the Robert Wood Johnson Foundation, the Ford Foundation, and the Urban Institute. Rice University’s Baker Institute and The Episcopal Health Foundation are partnering to fund and report on key factors about Texans obtained from an expanded, representative sample of Texas residents (HRMS-Texas). The analyses and conclusions based on HRMS-Texas are those of the authors and do not represent the view of the Urban Institute, the Robert Wood Johnson Foundation or the Ford Foundation. Information about the sample demographics of the cohort is available in Issue Brief #1. This Issue Brief is a summary of data extracted from the HRMS Surveys in Texas administered between September 2013 and September 2015. We will continue to report on survey data through additional Issue Briefs and future surveys.
Significant Percentages of Adult Texans Lack Confidence in Understanding Health Insurance Plan Terminology
The Affordable Care Act created new opportunities for Americans to obtain insurance through employer-sponsored plans, Medicaid, and the individual insurance market. In response to the ACA and along with market forces, each of these markets has undergone changes over the last several years. At the same time, an increasing number of Americans were entering the insurance market. For many people, especially those purchasing plans in the individual market, this was the first time they have had the opportunity to make choices about health insurance plans. Health insurance plans are complex products, with many interrelated features. Consumers needed a basic understanding of the features of the plans they were considering to make the best decisions.
The federal government along with some state and local governments and many community based organizations across the country spent millions of dollars in education and outreach efforts intended to help consumers learn about the opportunities afforded by the ACA. For consumers purchasing individual plans, insurance brokers, navigators, and application counselors provided individualized guidance during the enrollment process.
In Texas, we experienced a drop of five percentage points in the rate of uninsured adult Texans from 2013 to 2015 (23.5% uninsured to 18.5% as reported in Issue Brief #16). The majority of those who acquired insurance during that two-year period did so through the individual insurance market (as reported in Issue Brief #15), including 1.3 million who purchased through the federally facilitated Health Insurance Marketplace operating in Texas.
To determine the level of understanding about the features of health insurance plans, we asked adult Texans ages 18-64 about their confidence level in understanding seven terms that describe various features of health plans. Chart 1 below shows the percentage of respondents who replied that they were “not too confident” or “not at all confident” (versus very confident or somewhat confident) in their understanding of the terms.
Chart 1 — Lack of Confidence in Understanding Health Insurance Terms Among Texans Ages 18–64
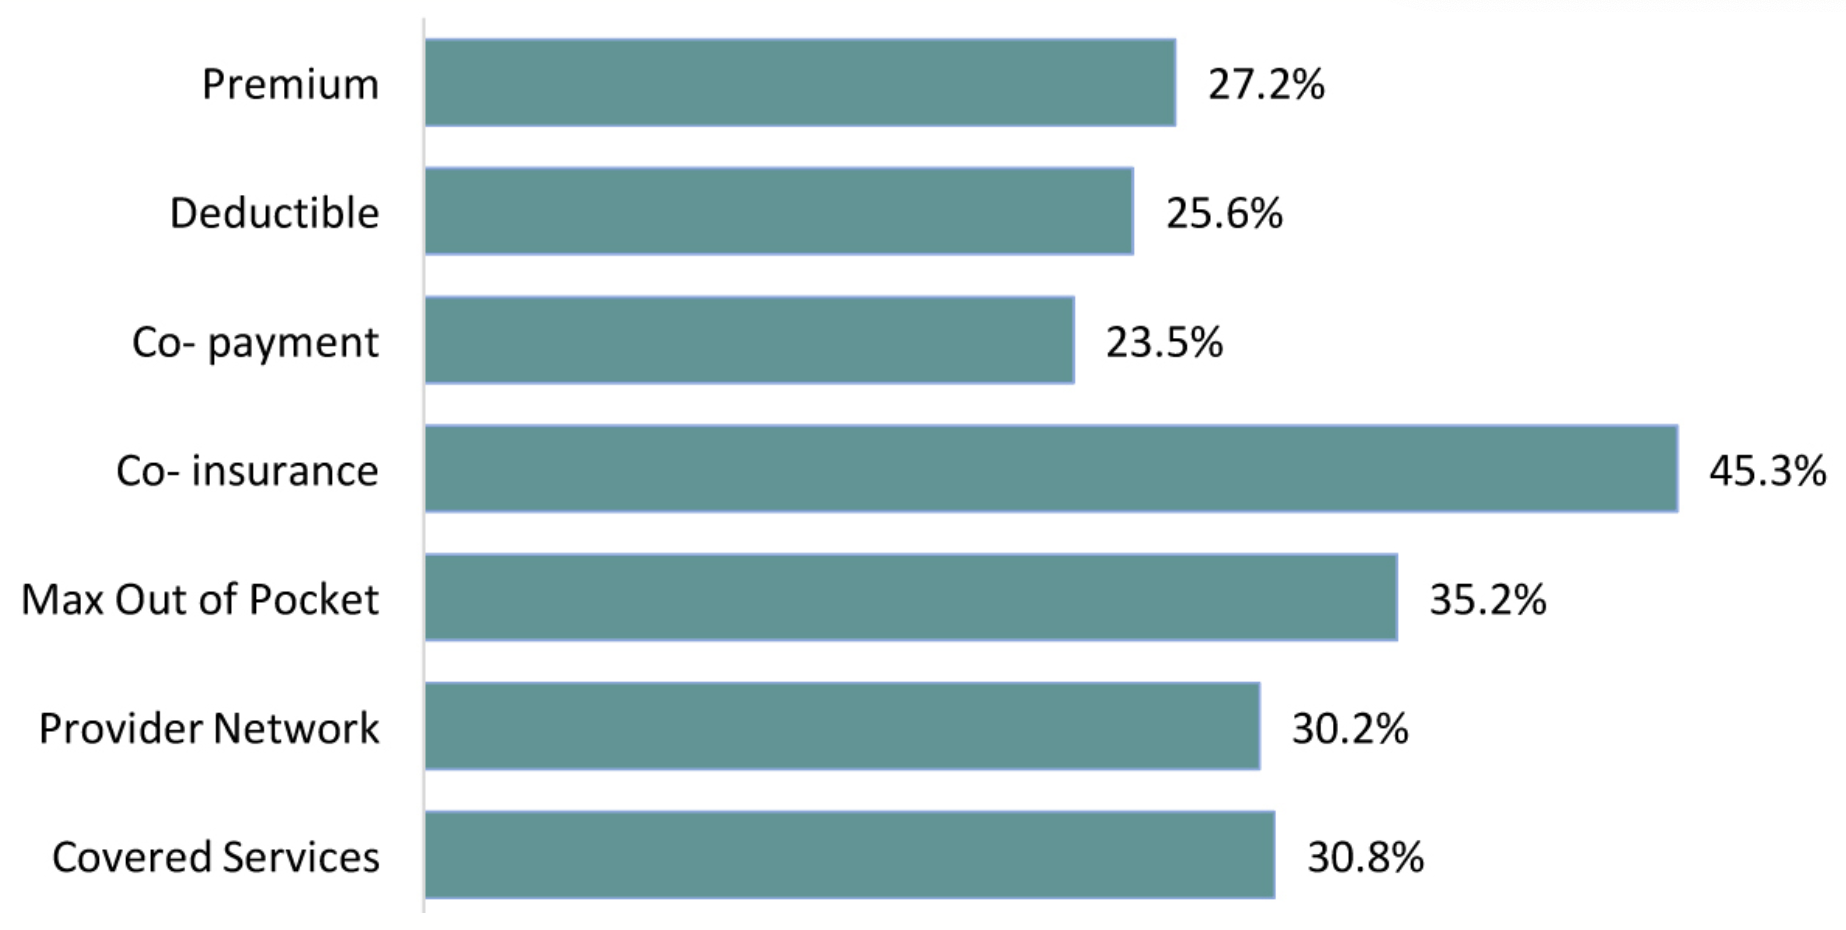
For each of the seven health plan features mentioned in the survey, a significant percentage of adults reported that they were not too confident or not at all confident in their understanding of the terms. Of the five terms relating to costs of health insurance and health care, approximately one-quarter lacked confidence in understanding the concepts of “premium,” “deductible,” and “co-payment,” which are among the most basic terms relating to the cost of insurance. The remaining two cost-related terms, “co-insurance” and “maximum out of pocket expenses,” were the least understood. Nearly one-third of respondents lacked confidence in their understanding of the two terms relating to the quality of health insurance plans, “provider network” and “covered services”.
Differences in Health Insurance Literacy Between and Among Demographic Groups
The lack of confidence in understanding health insurance terms reported by the adult population as a whole is significant. When we stratify the data by insurance status, race/ethnicity, and household income, we find striking differences between and among the groups, as shown in Chart 2, Chart 3, and Chart 4 below.
Chart 2 — Lack of Confidence in Understanding Health Insurance Terms Among Texans Ages 18-64 by Insurance Status
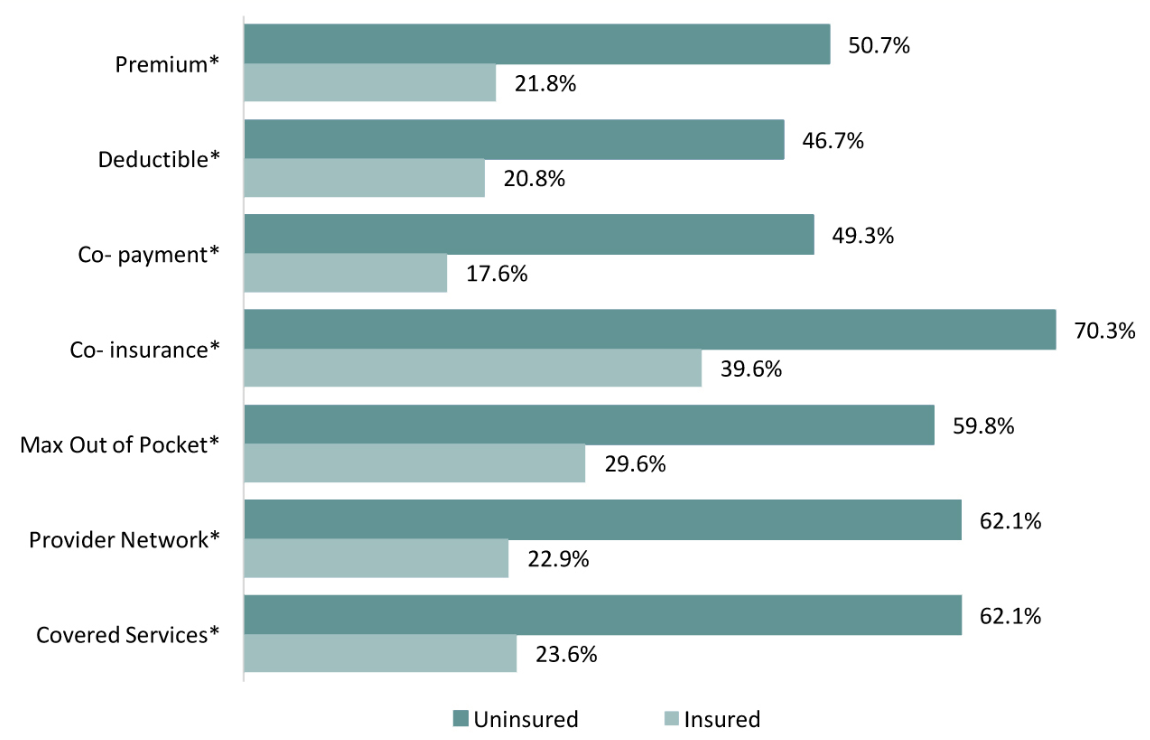
When insurance status is considered, the uninsured respondents reported significantly higher rates in expressing a lack of confidence in their understanding of all seven health insurance terms. In fact, their rates were nearly double that of their insured counterparts in most cases. It is possible that people who do not understand health insurance terminology are less likely to obtain insurance. A more likely explanation is that people who are able to obtain insurance have the opportunity and need to become familiar with the terms.
Chart 3 — Lack of Confidence in Understanding Health Insurance Terms Among Texans Ages 18–64 by Race/Ethnicity
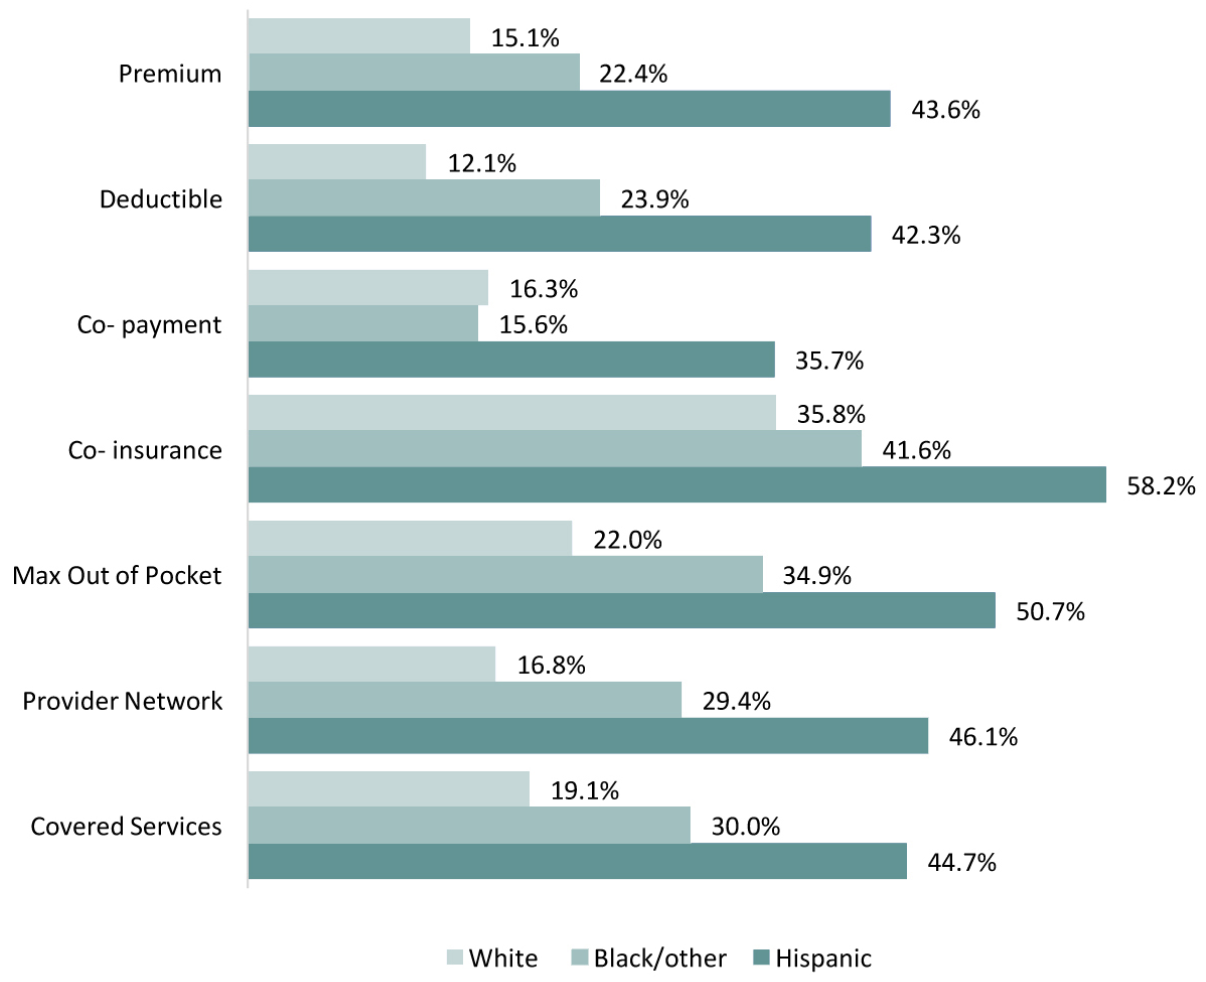
More than 40% of Hispanics expressed a lack of confidence in understanding almost all of the health insurance terms, compared to one-quarter to one-third of Blacks and only one-fifth of Whites. As Chart 2 shows, uninsured people are less confident in their understanding of health insurance terms and state and national data show that Hispanics are more likely to be uninsured than their Black or White counterparts. It is also possible that language barriers account for some of the differences between Hispanics and other groups. Outreach and education to Hispanics, in Spanish, has steadily increased as this group remains the least likely to be insured among adult Texans.
Chart 4 — Lack of Confidence in Understanding Health Insurance Terms Among Texans Ages 18-64 by Family Income
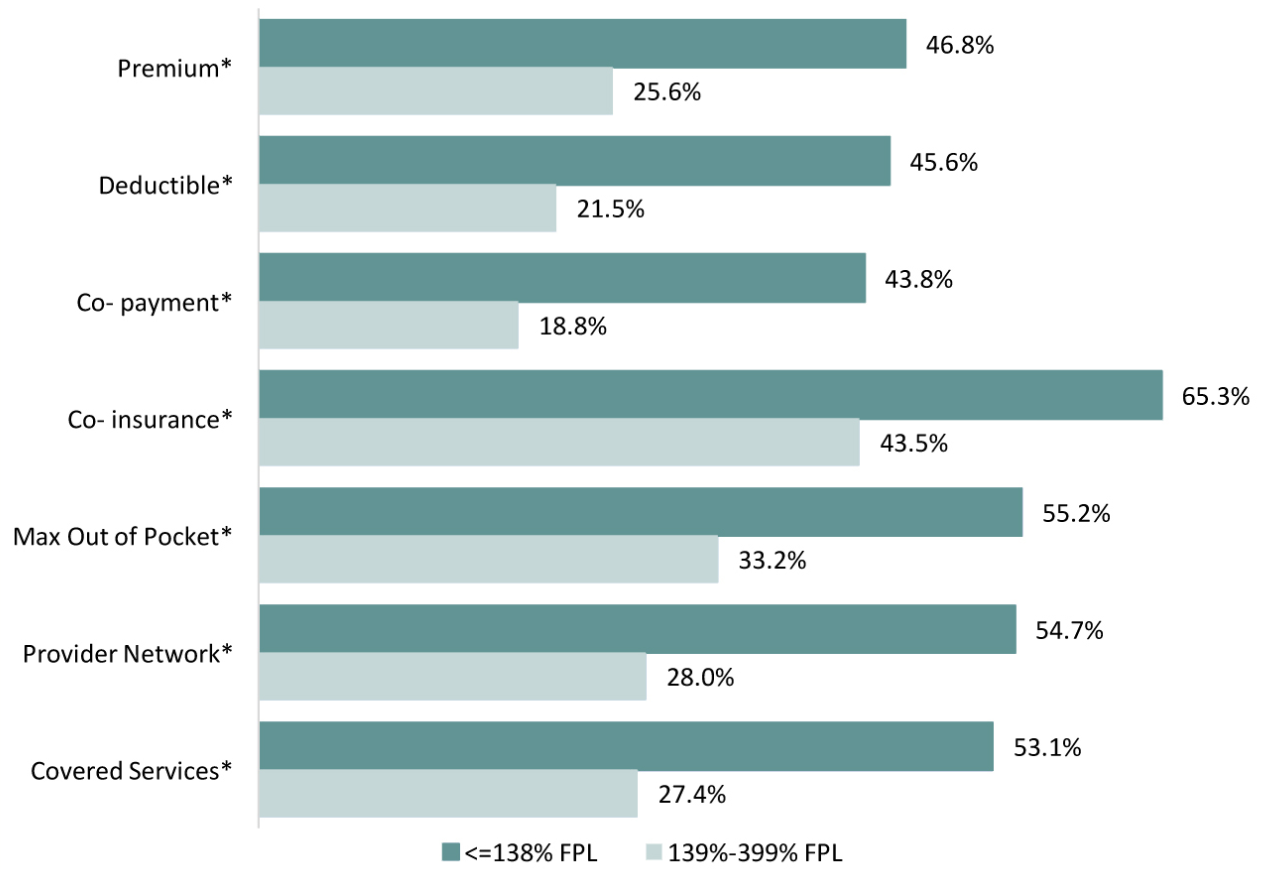
The lowest income respondents were significantly more likely to express a lack of confidence in their understanding of health insurance terminology than those with higher incomes. The lowest income adults in Texas are significantly more likely to be uninsured than those with higher incomes, and as shown in Chart 2, the uninsured are much more likely to lack confidence in understanding health plan terminology.
Conclusions
While the percentage of the overall Texas adult population who lack confidence in understanding health insurance terminology is significant, stratification of the data indicates that the problem is more significant for some groups than others. The lowest income, the uninsured, and Hispanics expressed the least confidence and we know there is a correlation among these demographic characteristics: Adult Hispanic Texans are more likely to be uninsured than their White or Black counterparts and are more likely to live in lower income families as compared to their White counterparts. As Hispanics make up an increasingly large share of the Texas population it is critical that we consider their needs when developing and implementing policies about health insurance. Understanding the key components of a health plan and choosing a health plan are complex undertakings. The data suggests the continuing need to offer education and outreach services targeting the uninsured population in order to improve their knowledge and confidence to find and evaluate information about health plans.
Even amongst those with insurance, a sizable portion of respondents lack confidence in aspects of employer-provided insurance that have changed dramatically over the past several years. In response to rising health care costs, employers have increased the portion of premiums, deductibles, and co-payments that workers must pay. Some employers have introduced insurance plans with narrow networks, and a significant number of health insurance plans offered in the Health Insurance Marketplace have narrow physician networks. Employers and policy makers should also take steps to educate those with insurance coverage about these changes, and how they can influence a consumer’s out-of-pocket spending on health care.
Looking Ahead
In our next Issue Brief, we will examine the health literacy of insured Texans. The HRMS survey will be fielded again in March 2016, and we will report on that data during the spring and summer of 2016.
Methodology
Each quarter’s HRMS sample of nonelderly adults is drawn from active KnowledgePanel® members to be representative of the US population. In the first quarter of 2013, the HRMS provided an analysis sample of about 3,000 nonelderly (age 18–64) adults. After that, the HRMS sample was expanded to provide analysis samples of roughly 7,500 nonelderly adults, with oversamples added to better track low-income adults and adults in selected state groups based on (1) the potential for gains in insurance coverage in the state under the ACA (as estimated by the Urban Institute’s microsimulation model) and (2) states of specific interest to the HRMS funders.
Although fresh samples are drawn each quarter, the same individuals may be selected for different rounds of the survey. Because each panel member has a unique identifier, it is possible to control for the overlap in samples across quarters. For surveys based on Internet panels, the overall response rate incorporates the survey completion rate as well as the rates of panel recruitment and panel participation over time. The American Association for Public Opinion Research (AAPOR) cumulative response rate for the HRMS is the product of the panel household recruitment rate, the panel household profile rate, and the HRMS completion rate—roughly 5 percent each quarter.
While low, this response rate does not necessarily imply inaccurate estimates; a survey with a low response rate can still be representative of the sample population, although the risk of nonresponse bias is, of course, higher.
All tabulations from the HRMS are based on weighted estimates. The HRMS weights reflect the probability of sample selection from the KnowledgePanel® and post-stratification to the characteristics of nonelderly adults and children in the United States based on benchmarks from the Current Population Survey and the Pew Hispanic Center Survey. Because the KnowledgePanel® collects in-depth information on panel members, the post-stratification weights can be based on a rich set of measures, including gender, age, race/ethnicity, education, household income, homeownership, Internet access, primary language (English/Spanish), residence in a metropolitan area, and region. Given the many potential sources of bias in survey data in general, and in data from Internet-based surveys in particular, the survey weights for the HRMS likely reduce, but do not eliminate, potential biases.
The design effect for the Texas data in September 2015 is 2.243 and the MOE is +/- 3.7. The survey fielded from September 1-25.

