
Author(s)

Comparing the Ford Model T and the Tesla S-X-3 suite’s respective sales growth trajectories offers unique empirical insights into (1) how electric vehicle (EV) sales are scaling up and (2) the magnitude of what remains to be done if EVs are to reshape automobile and oil markets.
The comparison between the first years of Tesla and Ford’s Model T sales is instructive due to at least two shared traits. First, each company rose to prominence on the back of a single revolutionary vehicle type. If the Model T had failed to catch on with consumers, Ford would have been out of business. Likewise, Tesla grew primarily due to Model S, X, and 3 sales, which brought high performance and a “cool” factor to the pure-battery EV market.
Second, each company was (or is) a market maker at the time it introduced the new vehicle type. The Model T dominated auto sales volumes in the 1910s and 1920s, while Tesla is the world's largest seller of battery-only, full-size EVs, accounting for nearly 80% sold in the US market during 2019.1 There is, however, an important distinction between the Ford and Tesla examples: the Model T dominated sales of all autos, while Tesla only dominates the battery EV space. In fact, Tesla accounts for less than 1% of new car sales in the US, and only about 0.48% of the sales volume in the overall global light duty vehicle (i.e., passenger cars, pickups, and SUVs) market.
Figure 1 — Sales Trajectories of the Ford Model T and the Tesla Vehicle Suite
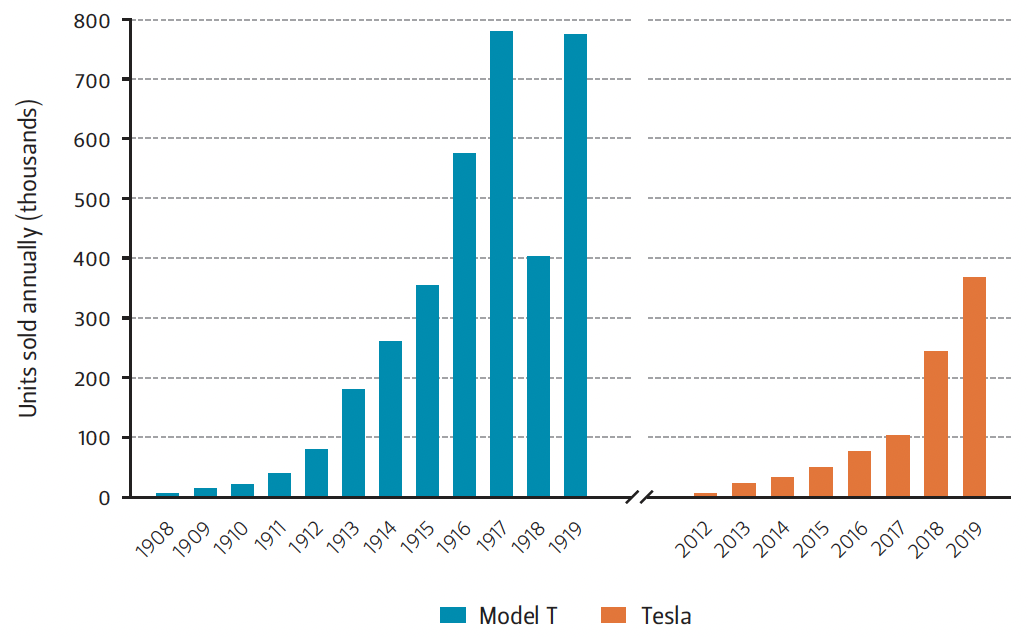
Note Model T sales declined in 1918 likely due to the redirection of US industrial resources during World War I.
The basic sales growth trajectory of the Model T and Tesla suite is broadly similar in the companies’ early years (Figure 1). After the introduction of the Model T, Ford took production to 2 million units annually by 1923 and commanded more than 50% of the American car market.2 In the coming years, Tesla will almost certainly follow a different path than Ford. For instance, Tesla has already branched into multiple vehicles types and offers option packages to accommodate evolving consumer desires, two strategic, expensive hurdles Ford had to traverse at a later point in its development.
Tesla and other EV-focused manufacturers also face a different market environment than Ford did in the early 20th century. Incumbent automakers now operate valuable franchises that took decades and billions of dollars to build, and whose economic gravitational force the parent company will likely be unable to escape.
Using trucks as an example, Ford sold more than 900,000 F-Series trucks in 2018 alone, which is more cars than Tesla has sold cumulatively to date.3 Perhaps even more salient, Ford’s F-Series business alone likely generated close to $45 billion in revenue during 2018—a figure approximating Goldman Sach’s revenue that year and one that would have placed the F-Series business 65th on that year’s Fortune 500 list.4
As a result of these market factors, diverting sufficient resources to truly lead in building market interest in electrified pickups and SUVs is a high-risk exercise for incumbent automakers. Large automakers have previously taken on risky gambles that paid off. Consider for instance Ford’s introduction of EcoBoost turbocharged engines and aluminum truck beds during the past decade. However, the level of manufacturing and marketing reinvention needed to electrify pickups and SUVs likely takes the major automakers further out on a limb than they’ve been in decades.
Accordingly, despite a rising chorus of newly announced EV programs, the major automakers’ portfolios will likely remain dominated by pure internal combustion engine (ICE) or hybrid vehicles for years to come. Indeed, in December 2019, Mercedes-Benz delayed introducing a new electric SUV to the US market by a year after watching anemic demand for rivals’ similarly situated electric SUVs.5
Lukewarm market entry by large incumbent automakers helps create market space for Tesla to sell into, but only up to a point. Serving a niche market with high-performance, expensive, and “cool” vehicles can be a profitable business model, as Ferrari and other luxury and supercar maker can attest. But filling a market niche would be woefully insufficient to justify Tesla’s market capitalization, which exceeded that of Ford and GM combined in early January 2020.6 Tesla’s rich valuation suggests that investors are betting it will become a global carmaker serving millions of customers per year, not a niche market specialist like Porsche that caters to a few hundred thousand wealthy drivers globally in a given year. Even so, to date, Tesla’s vehicle productivity is more like a specialist performance vehicle maker than an automobile mass marketer, so a long road lies ahead (Figure 2).
Figure 2 — Tesla’s Production Looks More Like Porsche Than Ford or GM
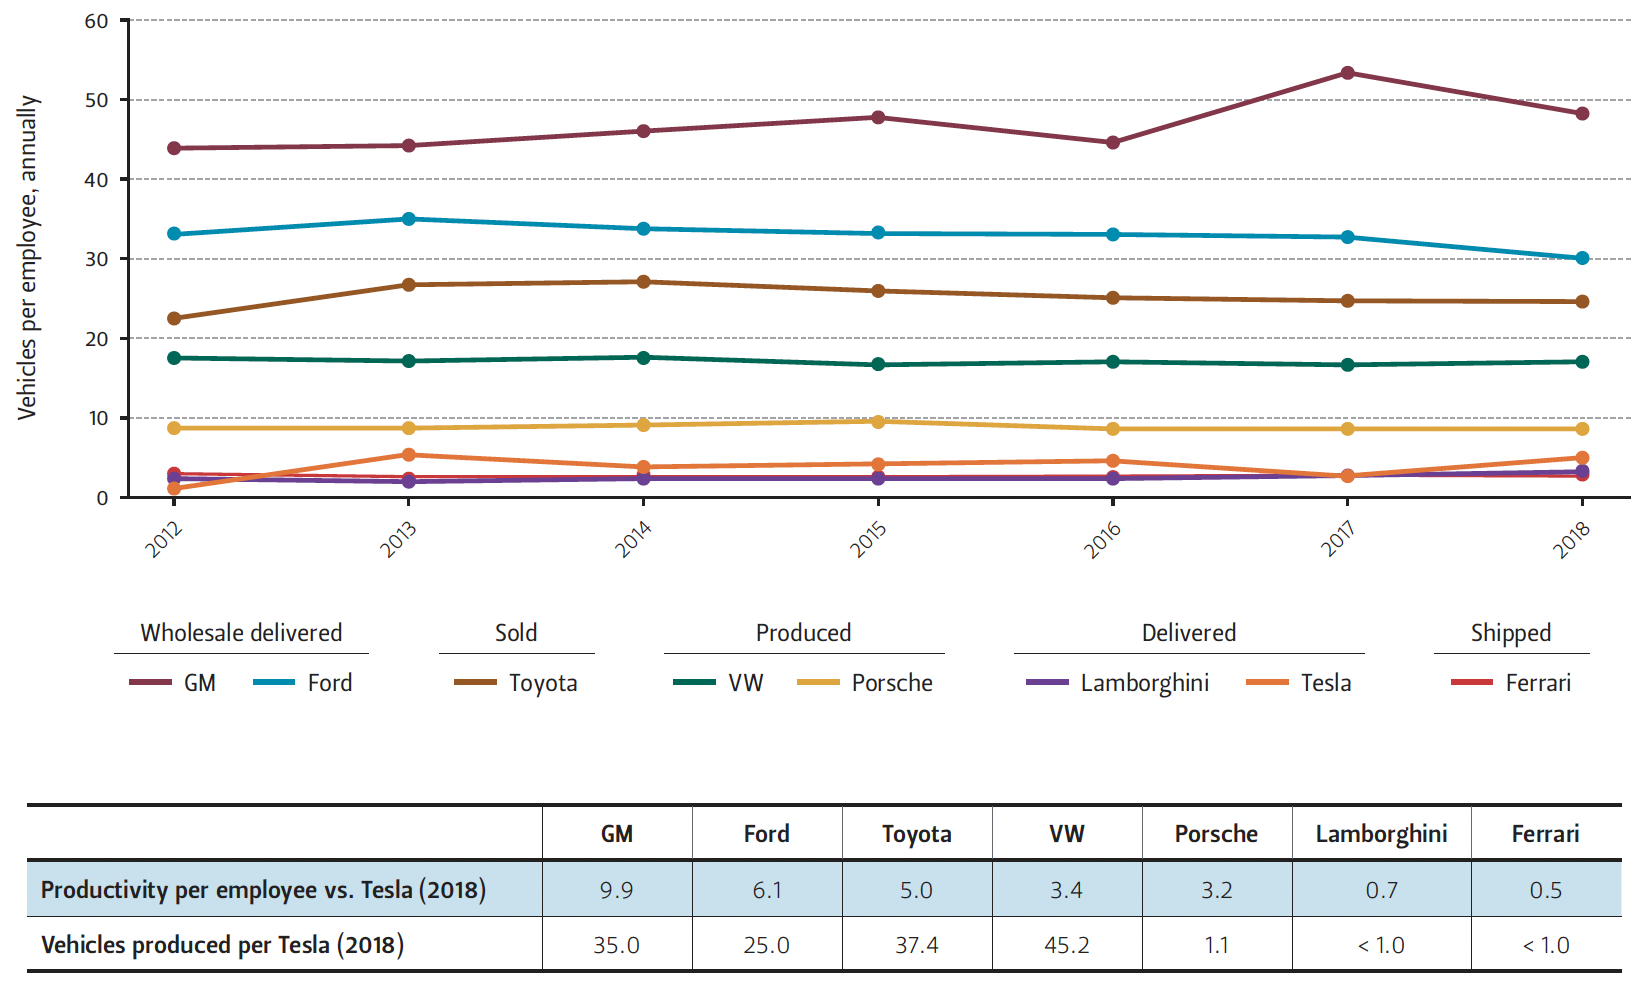
Note Sales and delivery data closely track production at the large automakers and are a reliable proxy for measuring manufacturing activity. At Toyota, for instance, the difference between the two in FY 2017 was only 1.2% (the margin by which sales exceeded production).
Scalability Matters
The gap between actual current productivity and future expectations for Tesla invokes questions about scale, not just for Tesla but for the EV sector at large. To transform global personal transportation and fuel use as Tesla advertises, scale is essential. Scalability holds the keys to lasting structural change in the energy and transportation spaces for at least three core reasons:
1. Without scale, EVs will not be able to turn over existing legacy auto fleets rapidly enough to materially influence global automobile and crude oil markets.
Innovations in how humanity sources and uses energy are generally only transformative on the global level if they are scalable. In April 2019, Tesla reported that the more than 550,000 Teslas on the road had driven more than 10 billion cumulative fleet miles and consumed 5.26 terawatt hours (TWh) of electricity.7
The numbers sound huge, but they are only the energy equivalent of approximately 15 million barrels of gasoline over the roughly seven years from the first commercial sales of the Model S sedan.8 If we assume that these are miles that would have otherwise been driven in an ICE vehicle and thus credit them as a bona fide displacement of gasoline demand, Teslas displaced a little over half a day’s average global gasoline demand (assuming average global gasoline consumption of approximately 25-26 million barrels per day based on data from British Petroleum and the Joint Organisations Data Initiative).9
Ten billion miles driven for 15 million barrels of gasoline-equivalent energy use suggests the Tesla fleet averages more than 660 miles driven for each barrel of gasoline theoretically displaced. Thus, at a current fleet driving rate that is likely now pushing 30 million miles per day, Tesla could displace about 45,000 barrels per day (bpd) of gasoline use, or approximately 0.2% of average global daily gasoline use. In comparison with the ICE vehicle world, the approximately 900,000 F-Series trucks that Ford sold in 2018 likely use around 49,000 barrels per day of fuel, approximately 35,000 bpd of which is gasoline (Table 1). Thus, all the Teslas sold since 2012 offset the gasoline use of about nine months of F-Series truck sales.
Table 1 — Estimated Daily Fuel Use of Ford F-Series Trucks Sold in 2018
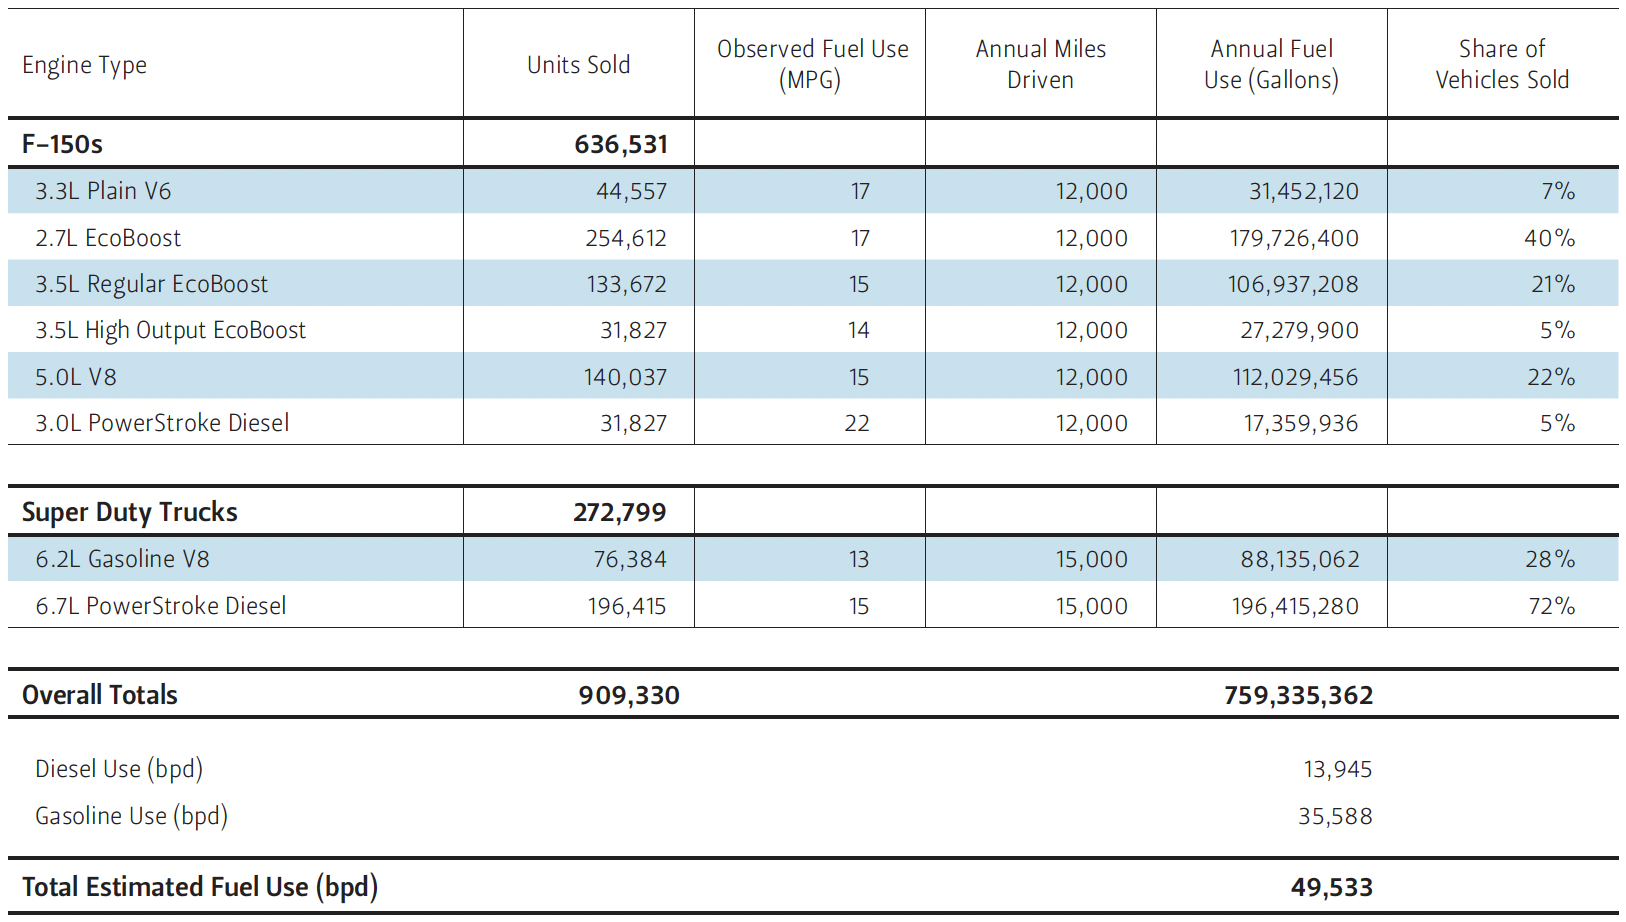
Note Ford does not publicly disclose the number of trucks sold with a given engine. Because the engine type is material to estimating fuel demand, I estimate the proportions. Ford expects 5% of F-150 buyers to opt for diesel engines (15), and 72% of Ford F-250 and F-350 Super Duty buyers opt for diesel engines (16). I adjust this number based on personal conversations with heavy duty truck users who are becoming frustrated with the cost and maintenance burdens imposed by complex emissions equipment on diesel engines and who are instead opting for lower-maintenance gasoline engines. I estimate the sales for the high-output EcoBoost 3.5L engine on the basis of a 2013 report from Edmunds saying an average of 1,000 Raptors were sold monthly at that time, with double digit annual sales growth (17). I further infer that Ford’s Raptor sales will significantly exceed the 2013 level based on the $145 million investment it made in 2016-2017 to upgrade its Cleveland Engine Plant, which makes the second generation EcoBoost engines now powering both regular F-150s and Raptors (18). The 5.0L V8 engine was the powerplant for 25% of 2018 model F-150s, an estimate I have adjusted downward by 3% to reflect penetration of the EcoBoost high-output motor and 3.0L Powerstroke diesel. In May 2019, David Filipe, Ford vice president for powertrain engineering, said that approximately 70% of new F-150s sold used one of the two EcoBoost engine variants (19).
Changes in transport patterns can appear via both the raw volume of vehicles in the fleet and the per vehicle utilization. Existing data suggest that EV usage rates (as measured in miles driven per year) approximately track the vehicle miles traveled for the gasoline and diesel-powered automobiles that consumers might otherwise drive.10 Accordingly, EVs will need to gain a much larger share of the passenger vehicle fleet for them to be truly transformative.
Thus far, Tesla’s annual sales are still less than 0.25% of the existing US light duty vehicle fleet. When considering this figure, it is important to remember that Tesla is the world’s dominant battery EV maker and that the US (particularly California) is its core marketplace.
If it can only sell a volume of vehicles each year that is less than 1% of the existing internal combustion-powered light vehicle fleet base, Tesla’s capacity to change the fleet composition at a national or global level will be limited. This will be especially important if ICE vehicles—including hybrids— become much more efficient and therefore more competitive with EVs on a holistic energy and environmental basis. Internal combustion vehicle development remains a technologically dynamic process. As these vehicles continue to improve and become more efficient, EVs will have to chase a moving set of goalposts in order to penetrate markets at a globally impactful level.
The point here is not to knock Tesla, which has developed a unique product line that has finally made electric cars “cool” and fast. Rather, it is to illustrate the importance of scale for any entity seeking to transform how energy is consumed at the global level.
2. Scale is needed to underpin the creation of a sustainable operational ecosystem and supporting infrastructure for pure-battery EVs.
Scale gives infrastructure service providers the confidence to invest in building the networks needed to support a growing EV fleet. EVs are not there yet. For example, the average annual income of a US household that owns a Tesla Model 3, the company’s lowest-priced and best-selling offering, is still more than twice the national median ($128,000 vs. $61,000).20 If the cars are restricted to wealthier zip codes and concentrated in only a few markets such as coastal California and Norway, the associated infrastructure opportunity is less interesting to investors compared to a broad, nationwide fleet footprint that spans economic classes.
Slower market penetration by EVs may also introduce a self-reinforcing cycle that inhibits infrastructure growth. Tesla may be the one exception to this dynamic given its significant investments in a proprietary charging network. Indeed, some Wall Street analysts suggest the Supercharger network (which only serves Tesla vehicles) may wind up serving as a competitive moat that helps induce prospective EV buyers to favor Teslas over other car brands that lack access to the Superchargers.21 Conversely, the proprietary network could also impede the growth of broader service and support infrastructure that could otherwise facilitate more rapid EV adoption. Imagine for instance if Chevy, Ford, GM, Toyota, and Volkswagen all required that their traditional ICE vehicles use a proprietary fueling and support structure, and that accessing any other network was either impossible or required special aftermarket adapters. Broadly accessible networks that make service and support fungible tend to accelerate the adoption of many consumer goods, from smartphones to bigger-ticket items like cars.
3. Scale can help EVs come closer to more affordable price points.
EVs are expensive in part because they are still not produced at the same scale as mass-market ICE vehicles, but those same high costs impede market penetration. The expected rollout of additional EV models by manufacturers other than Tesla over the next 2-3 years will test if model availability and a larger range of price points can unlock consumer demand.
The long-range version of the Tesla Model 3 has a base price of roughly $49,000—about 25% more expensive than the average US new car sales price in 2018.22 This price is also more than twice what the average used car cost, which is important to consider given that there were twice as many used car sales as new car sales in the US market in 2018.23
Market Implications
So can EVs achieve a market transforming scale within the next decade? Possibly. One overwhelming reality leaps forth from the past decade of data and anecdotal evidence alike: at the global level, EVs have thus far been evolutionary, not revolutionary, factors in the transportation sector. Tesla has been “evolutionary” in that the changes they have introduced to the car market to date are thus far incremental. EV entries slightly restrain fuel demand growth and tailpipe emissions growth each year relative to the baseline, whereas a “revolutionary” change, such as the introduction of the Model T, would cause palpable shifts on even a short-term basis. For many types of mechanical implements, “revolution” is the sum of many evolutions compounded in a relatively short period of time. EVs are not yet impacting the market with sufficient mass to trigger that compounding, deep, high-velocity change necessary for a revolution.
Figure 3 — Light Duty Vehicles Sales Slowing Globally
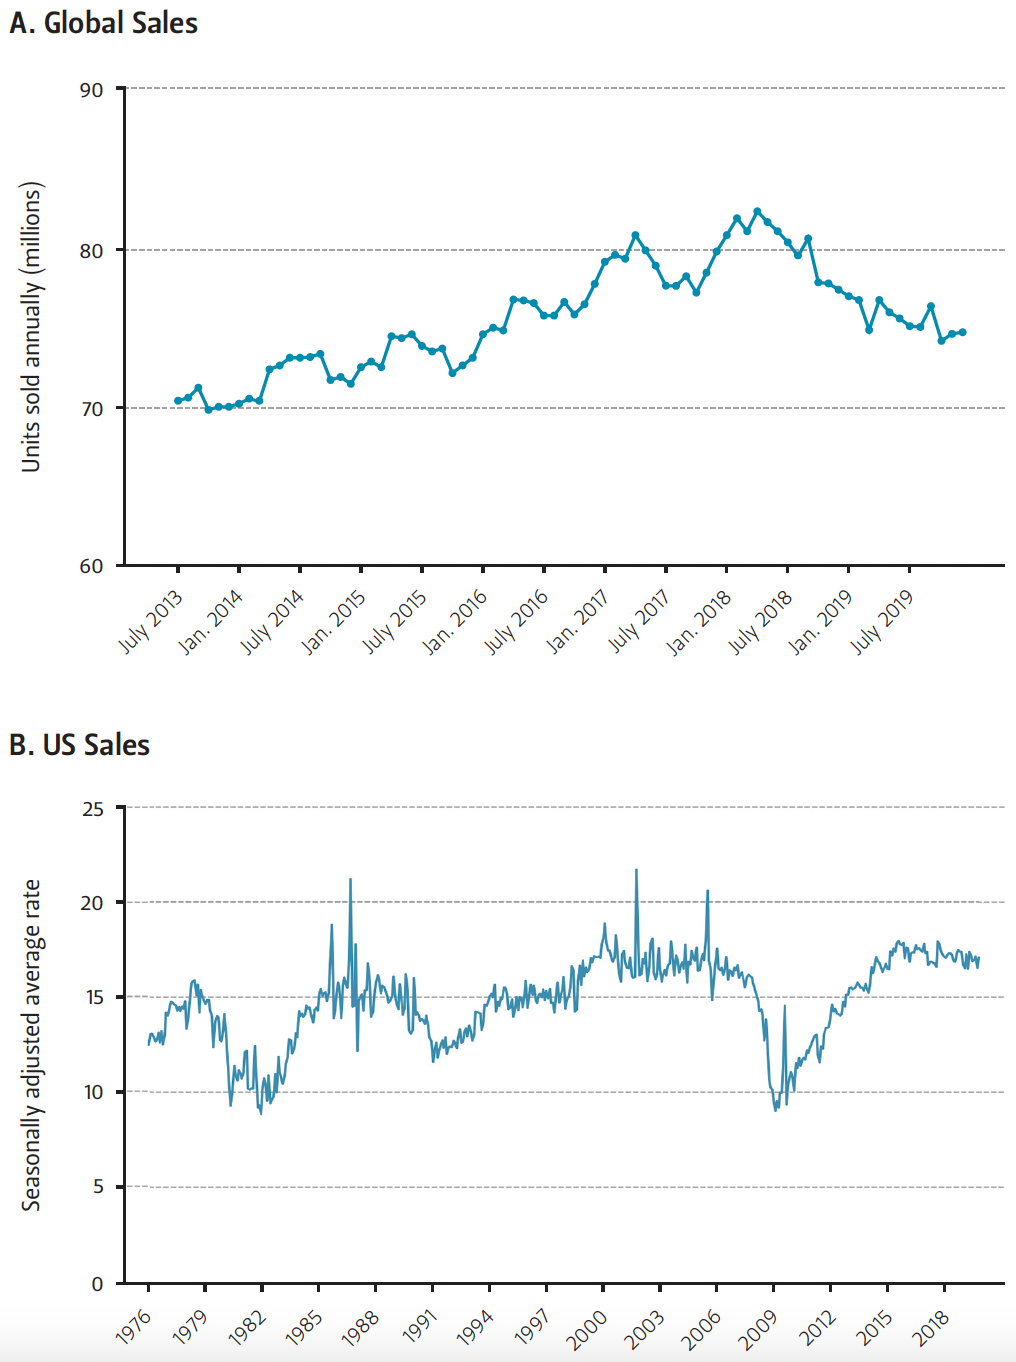
Several factors bear watching. First, what level of monthly auto sales might EVs need to achieve a self-reinforcing cycle of sales growth and expansion of the supporting infrastructure needed to sustain a growing fleet? Second, how will EVs differentiate themselves and compete for buyers in a global auto market that is slowing down and leaving less space for new vehicles to easily squeeze into? On a six-month rolling average basis, global light duty vehicle sales have been decreasing since early 2018 (Figure 3A). US sales are stagnant (Figure 3B), and car sales in China have now declined for 18 of the past 19 months.24 Global macro conditions at this point in 2020 suggest that a sudden upswing in new light duty vehicle purchases is unlikely over the next 18-24 months and that EVs will have to fight harder for new sales opportunities than they would have a decade ago.
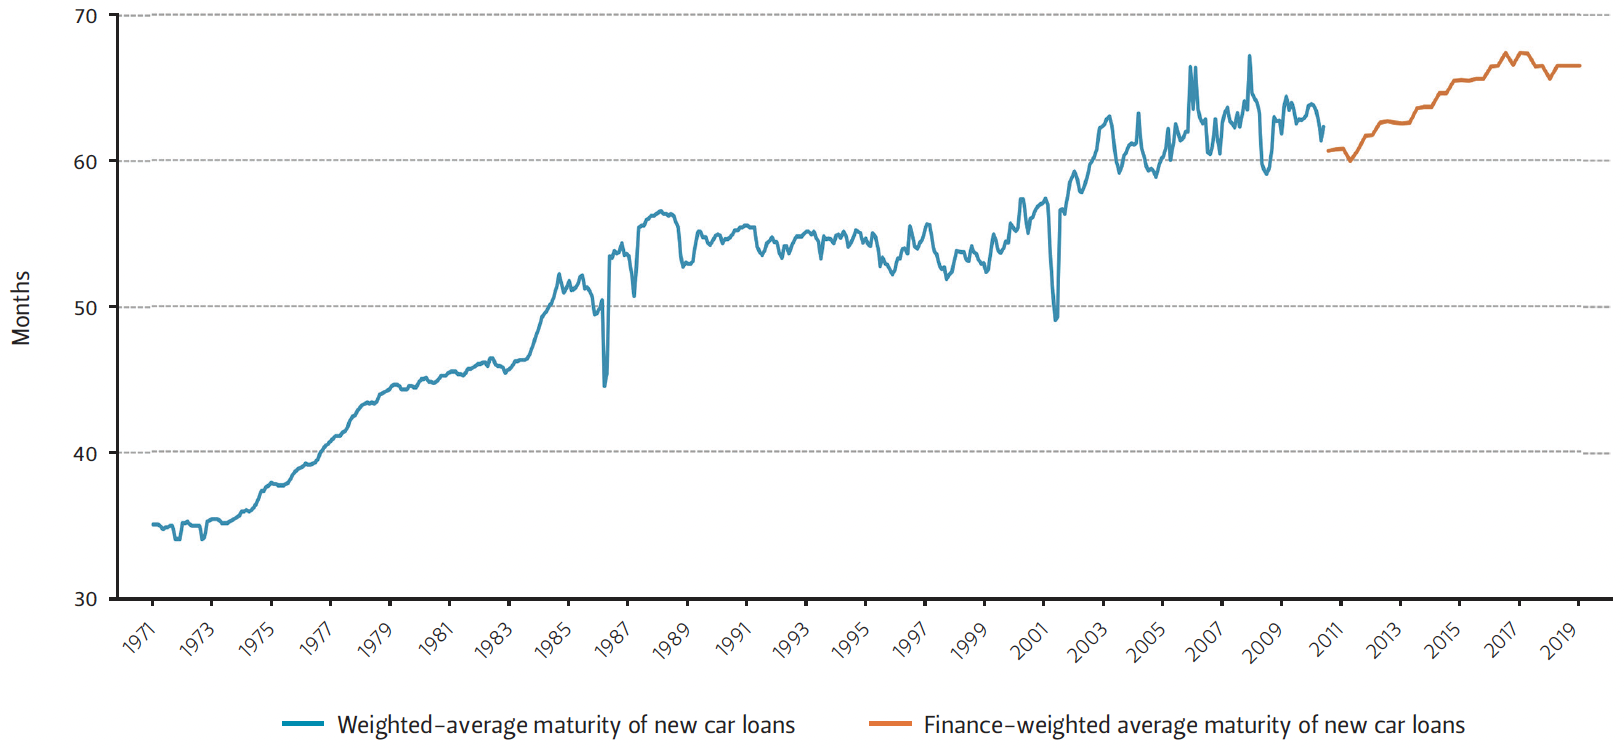
Vehicle prices and how those costs intersect with vehicle capability and consumer experiences will also powerfully influence how fast EVs can penetrate the market. EVs and ICE vehicles differ radically in many respects, but a common trait is that both are increasingly expensive relative to median consumer incomes. US car owners now labor under an estimated $1.2 trillion in auto loan debt, according to data from the Federal Reserve Bank of St. Louis.26 Furthermore, the average term length of auto loans in the US has risen steadily for the past 20 years and now sits at nearly 67 months (Figure 4). Some financing companies now offer auto loan terms as long as 96 months—longer than many Americans own their cars. The general increase in loan length suggests that consumers find themselves increasingly stretched as they seek to pay for their rides.
Figure 4 — Average Term Length of New Car Loans in the U.S.
Car price and affordability issues also pose challenges for EVs, since the most popular models tend to be offered at price points that significantly exceed the median price of new cars in the US and other markets. In many cases, EVs also exceed the average consumer’s annual average household income. That combination is not a recipe for sustained sales growth, and there is a meaningful risk that as manufacturers scale up their production capacity, the world discovers that the market for the EVs has become saturated and that accessing additional consumers will require vehicles at lower price points.
Furthermore, dramatic shifts in customer expectations as to what vehicles can deliver and how they are used do not necessarily translate into more favorable opinions of EVs. For instance, improvements like greater vehicle autonomy, advances in materials science that yield lighter and more efficient cars, or subscription auto services could end up favoring incumbent internal combustion vehicles. Bottom line: Tesla will scale differently than the Model T, and it has to achieve much deeper fleet penetration to become a world changer commensurate with the company’s ambitions.
Endnotes
1. Zachary Shahan, “Tesla Scores 77% of US Electric Auto Sales in November — CleanTechnica Report,” CleanTecnica, December 13, 2019, https://bit.ly/38cjzwY.
2. John Storey, New Wave Manufacturing Strategies: Organizational and Human Resource Management Dimensions (London: Paul Chapman Publishing, 1994), 26.
3. “Ford F-Series Sales Numbers,” Ford Authority, accessed February 6, 2020, https://bit.ly/31x2dbJ.
4. See John McCormick, “2018 Ford F-150—Can 32 Million Americans Be Wrong?” Forbes, April 4, 2018, https://bit.ly/37doCMw. My estimates were derived as follows: approximately 909,000 F-Series trucks were sold in 2018, with an average F-150 transaction price of $47,174 (Matt Degen, “Pricing Your Next Ford F-150: It Could Cost $60,000 – or More,” Kelley Blue Book, August 22, 2018, https://bit.ly/2Ozvmhd) yields $42.8 billion. Heavy-duty F-Series trucks often cost substantially more than the F-150 and depending on their average transaction price, the “real” F-Series franchise revenue number could approach $50 billion annually. F-Series sales data were obtained from “Ford F-Series Sales Numbers.” The 2018 Fortune 500 rankings were obtained from “Fortune 500 2018,” Fortune, accessed February 6, 2020, https://bit.ly/2UujTTT.
5. “Mercedes delays electric debut after rival SUVs flop,“ EnergyWire, December 19, 2019, https://bit.ly/3795a3o.
6. Stephen Gandel, “Tesla Motors is now America's most valuable car company,” CBS News, January 8, 2020, https://cbsn.ws/2vZOZIL.
7. “Tesla Impact Report,” Tesla, 2018, https://bit.ly/37cT3T3.
8. Adjusted for EVs’ roughly 4:1 efficiency advantage over internal combustion vehicles.
9. Joint Organisations Data Initiative- Secondary, “Motor and aviation gasoline,” Joint Organisations Data Initiative, accessed February 6, 2020, https://bit.ly/3bkiVQ8; “Statistical Review of World Energy—2019,” BP, accessed February 6, 2020, https://on.bp.com/31A8N0Z.
10. “California's Advanced Clean Cars Midterm Review, Appendix G: Plug-in Electric Vehicle In-Use and Charging Data Analysis,” California Environmental Protection Agency, Air Resources Board, January 18, 2017.
11. Alexander Stoklosa, “2018 Ford F-150 2.7L EcoBoost V-6 4x2 SuperCrew,” Car and Driver, March 8, 2018, https://bit.ly/372hGS8; K.C. Colwell, “2017 Ford F-150 3.5L EcoBoost 10-Speed Automatic 4x4,” Car and Driver, March 2, 2017, https://bit.ly/38bOF7O; Andrew Wendler, “2018 Ford F-150 5.0L V8 4x4 SuperCrew,” Car and Driver, February 2, 2018, https://bit.ly/388jsTb; Andrew Wendler, “2018 Ford F-150 3.0L V-6 Power Stroke Diesel Brings Refinement and Fuel Economy,” Car and Driver, January 2, 2019, https://bit.ly/2UAnEr0; Tony Markovich, “2017 Ford F-250 Super Duty Gasoline V-8 SuperCab 4x4,” Car and Driver, July 13, 2017, https://bit.ly/2H15436; David Beard, “2017 Ford F-250 Super Duty Diesel 4x4 Crew Cab,” Car and Driver, April 27, 2017, https://bit.ly/2HfYGoZ; K.C. Colwell, “2017 Ford F-450 Super Duty Diesel 4x4,” Car and Driver, https://bit.ly/3bjD7S6.
12. “Ford F-Series Sales Numbers.”
13. “December 2018 Sales,” Ford Motor Company, accessed February 6, 2020, https://ford.to/2vTI2J3.
14. Joseph White, “Ford revs up to sell hybrids with appeal of speed and power,” Reuters, May 17, 2019, https://reut.rs/373vrQF.
15. Andrew Wendler, “2018 Ford F-150 3.0L V-6 Power Stroke Diesel Brings Refinement and Fuel Economy,” Car and Driver, January 2, 2019, https://bit.ly/2H5hVBq.
16. Mark Williams, “Diesel Pickup Sales Are Revving Up: Study,” PickupTrucks.com, September 29, 2018, https://bit.ly/2H4j2kJ.
17. Anita Lienert, “Ford F-150 SVT Raptor Sales Hit Record Highs, Company Says,” Edmunds, September 13, 2013, https://edmu.in/399hOAO.
18. “Cleveland Engine Plant Gets $145 Million Upgrade, Creates 150 Jobs For New EcoBoost Engine Production,” Ford Media Center, February 26, 2016, https://ford.to/38d7Iic.
19. White, “Ford revs up.”
20. “Tesla Model 3 Demographics: Income, Age, Gender and More,” Hedges & Company, March 2019, https://bit.ly/2vcisyQ.
21. Michael Sheetz, “Tesla’s charging stations are a massive ‘competitive moat,’ Morgan Stanley says,” CNBC, February 12, 2019, https://cnb.cx/2S7yJOs.
22. “Tesla Model 3,” Tesla, accessed January 30, 2020, https://bit.ly/2H2QxUv.
23. “Used Vehicle Market Poised for Record Sales in 2019, According to New Report from Edmunds,” Edmunds, March 20, 2019, https://edmu.in/31zVwW6.
24. Raffaele Huang and Yoko Kubota, “China’s Car-Sales Slump Extends Into Another Year,” Wall Street Journal, January 9, 2020, https://on.wsj.com/38bPjlK.
25. “Light Weight Vehicle Sales,” Federal Reserve Bank of St. Louis, accessed February 6, 2020, https://bit.ly/2H09LKC.
26. “Motor Vehicle Loans Owned and Securitized, Outstanding,” Federal Reserve Bank of St. Louis, accessed January 30, 2020, https://bit.ly/2tCP8B0.
27. “Weighted-Average Maturity of New Car Loans at Auto Finance Companies (DISCONTINUED),” Federal Reserve Bank of St. Louis, accessed January 30, 2020, https://bit.ly/2usfiqC; “Average Maturity of New Car Loans at Finance Companies, Amount of Finance Weighted,” Federal Reserve Bank of St. Louis, accessed January 30, 2020, https://bit.ly/2tEu6Cb.
This material may be quoted or reproduced without prior permission, provided appropriate credit is given to the author and Rice University’s Baker Institute for Public Policy. The views expressed herein are those of the individual author(s), and do not necessarily represent the views of Rice University’s Baker Institute for Public Policy.


