
In March 2015, near the close of the Health Insurance Marketplace’s second open enrollment period, we surveyed adult Texans ages 18 to 64 to understand who remained uninsured and why, and to identify the differences, if any, in the characteristics of the uninsured population before the opening of the Marketplace in September 2013, and March 2015. Our survey indicates that the 16.9% of adult Texans who remain uninsured are more likely to be Hispanic, middle aged, low income and without a college degree. This corresponds with the pre-Marketplace data which indicated that these same groups were more likely to uninsured in 2013. The majority (57.1%) of the remaining uninsured cited costs as the biggest factor in their lack of insurance, and also reported that the prospect of a fine was not an important consideration to them.
About the Survey
The Health Reform Monitoring Survey (HRMS) is a quarterly survey of adults ages 18-64 that began in 2013. It is designed to provide timely information on implementation issues under the ACA and to document changes in health insurance coverage and related health outcomes. HRMS provides quarterly data on health insurance coverage, access, use of health care, health care affordability, and self-reported health status. The HRMS was developed by the Urban Institute, conducted by GfK, and jointly funded by the Robert Wood Johnson Foundation, the Ford Foundation, and the Urban Institute. Rice University’s Baker Institute and The Episcopal Health Foundation are partnering to fund and report on key factors about Texans obtained from an expanded, representative sample of Texas residents (HRMS-Texas). The analyses and conclusions based on HRMS-Texas are those of the authors and do not represent the view of the Urban Institute, the Robert Wood Johnson Foundation or the Ford Foundation. Information about the sample demographics of the cohort is available in Issue Brief #1. This Issue Brief is a summary of data extracted from the HRMS Survey in Texas that was administered in March 2015. We will continue to report on survey data through additional Issue Briefs and future surveys.
Characteristics and Changes in Rates of the Uninsured in Texas, September 2013 to March 2015
Table 1 — Proportions of Uninsured Adult Texans by Demographic and Socioeconomic Category, September 2013 and March 2015
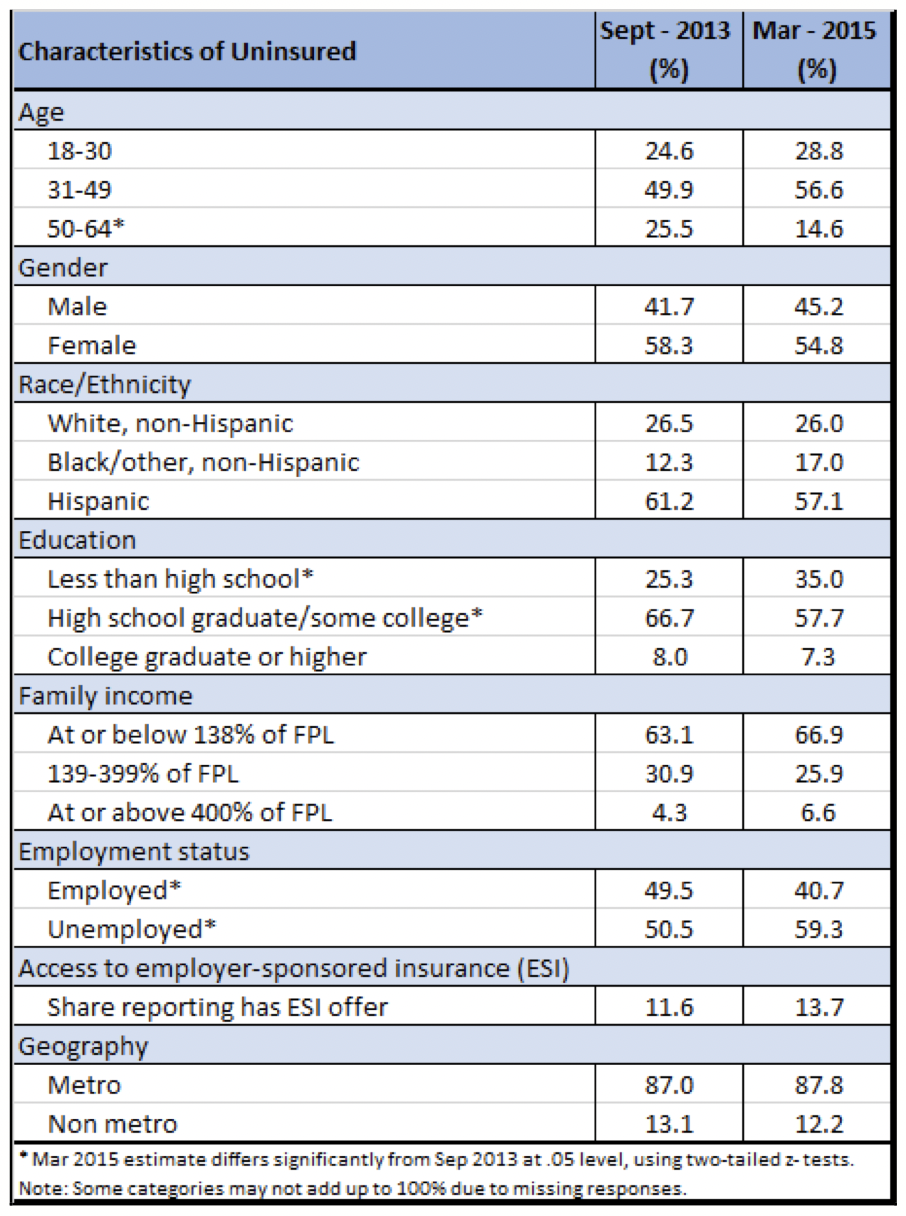
As we reported in Issue Brief #11, from September 2013 to March 2015, Texas experienced an overall reduction in the rate of uninsured residents ages 18-64 of 7.7 percentage points, from 24.6% to 16.9% (a 31% decrease). For this brief, we looked at the characteristics of the remaining 16.9% of uninsured adult Texans as of March 2015 and compared them to the 24.6% uninsured adults as of September 2013. In Table 1, we examine the proportion of the uninsured in 2013 and 2015 who are in various demographic or socioeconomic categories. At both points in time, the uninsured are primarily middle aged (31-49), Hispanic, low income (at or below 138% of the federal poverty level), and not college educated.
There are interesting changes in the make-up of the remaining uninsured within some of these groups, notwithstanding the above-noted consistencies. The percentage of uninsured who are older adults, ages 50-64, declined considerably from 2013 to 2015, while the percentage of those ages 18- 30 and 31-49 who were uninsured rose, relative to the older adults. This is because the reduction in rates of uninsured for the oldest group declined at a greater rate than the other age groups. This was an expected outcome of the pre-existing disposition of older adults toward health coverage and the favorable pricing of plans for this population because of the Affordable Care Act’s rate band rules. While the majority of the remaining uninsured adults are still Hispanic, Hispanics actually experienced the greatest percentage decrease in the rate of uninsured during this period of time, a drop of 37.8 percent. Not surprisingly, the lowest income adults comprise an increasingly large percentage of the uninsured in 2015 as compared to 2013, because most of them were ineligible for coverage opportunities in the Marketplace. The ACA offered coverage to this group through an optional Medicaid expansion, but because Texas did not expand Medicaid, the lowest income Texans were not eligible for ACA coverage.
We also compared the self-reported health status of uninsured Texans in September 2013 and March 2015 to learn whether the remaining uninsured were more or less healthy than the pre- Marketplace uninsured. Figure 1 below contains that data. The percentage of uninsured individuals reporting excellent health was relatively unchanged between 2013 and 2015. The share of uninsured in either fair or poor health also did not change significantly over time. However, the percentage uninsured in very good health declined significantly (from 29.9% to 17.2%) between 2013 and 2015, and the percentage of uninsured reporting themselves in good health rose (from 38.7% to 49.8%). These changes suggest that those who were able to gain coverage since 2013 are healthier on average than those who remain uninsured. These results are consistent with research studies showing a strong correlation between income and health status. The uninsured in families earning 100%+ of the federal poverty level were able to purchase insurance using subsidies provided by the Affordable Care Act. However, the lowest income families, who are likely to have worse health status, have no access to subsidies. The ACA intended to give the poorest individuals Medicaid coverage, but Texas has not elected the Medicaid expansion offered by the law.
Figure 1 — Self-reported Health Status of Uninsured Adult Texans, September 2013 and March 2015

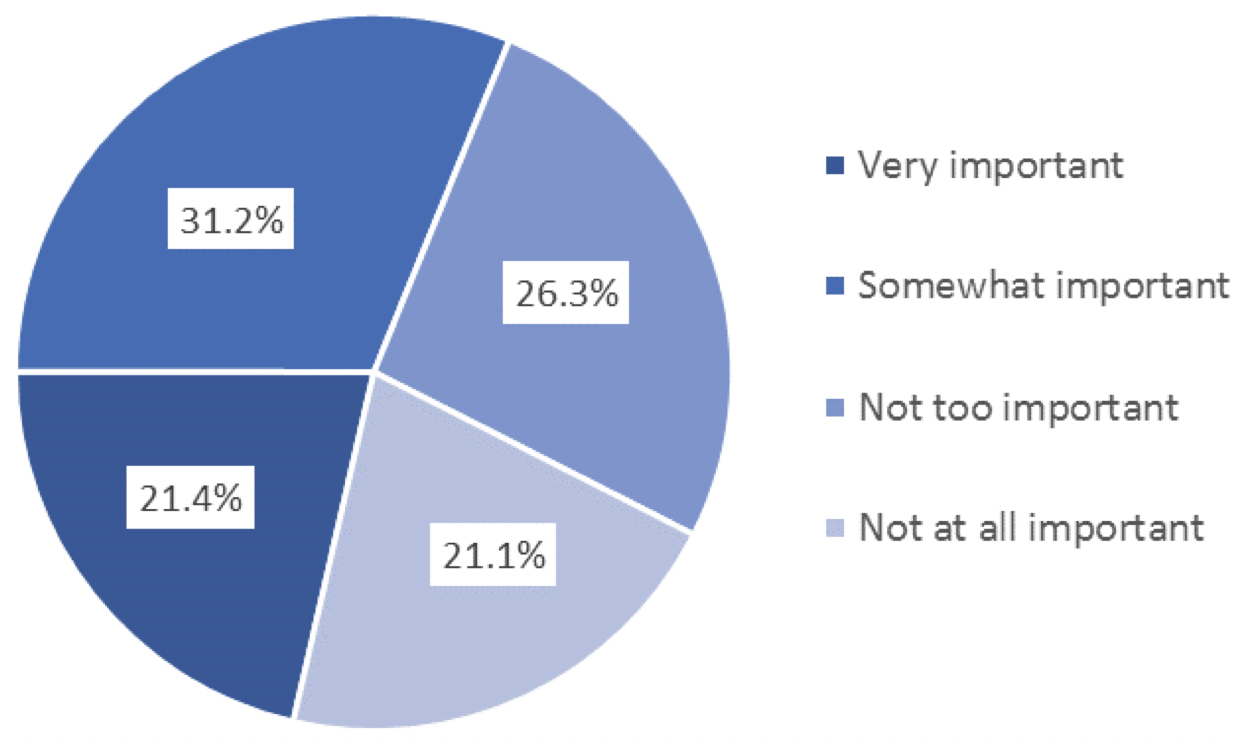
We asked those who remained uninsured in March 2015 why they did not have insurance and whether the prospect of a tax penalty impacted their coverage decisions. As shown in Figure 2 below, the majority (57.1%) cited the cost of insurance as the primary reason for not being covered. Not surprisingly, as shown in Figure 3 below, nearly half of respondents (47.4%) reported that the possibility of a fine was “not too important” or “not at all important” to them. A small but not insignificant percentage of uninsured respondents, 17.3%, reported that they did not want health insurance.
Figure 2 — Primary Reasons Adult Texans Are Uninsured, March 2015
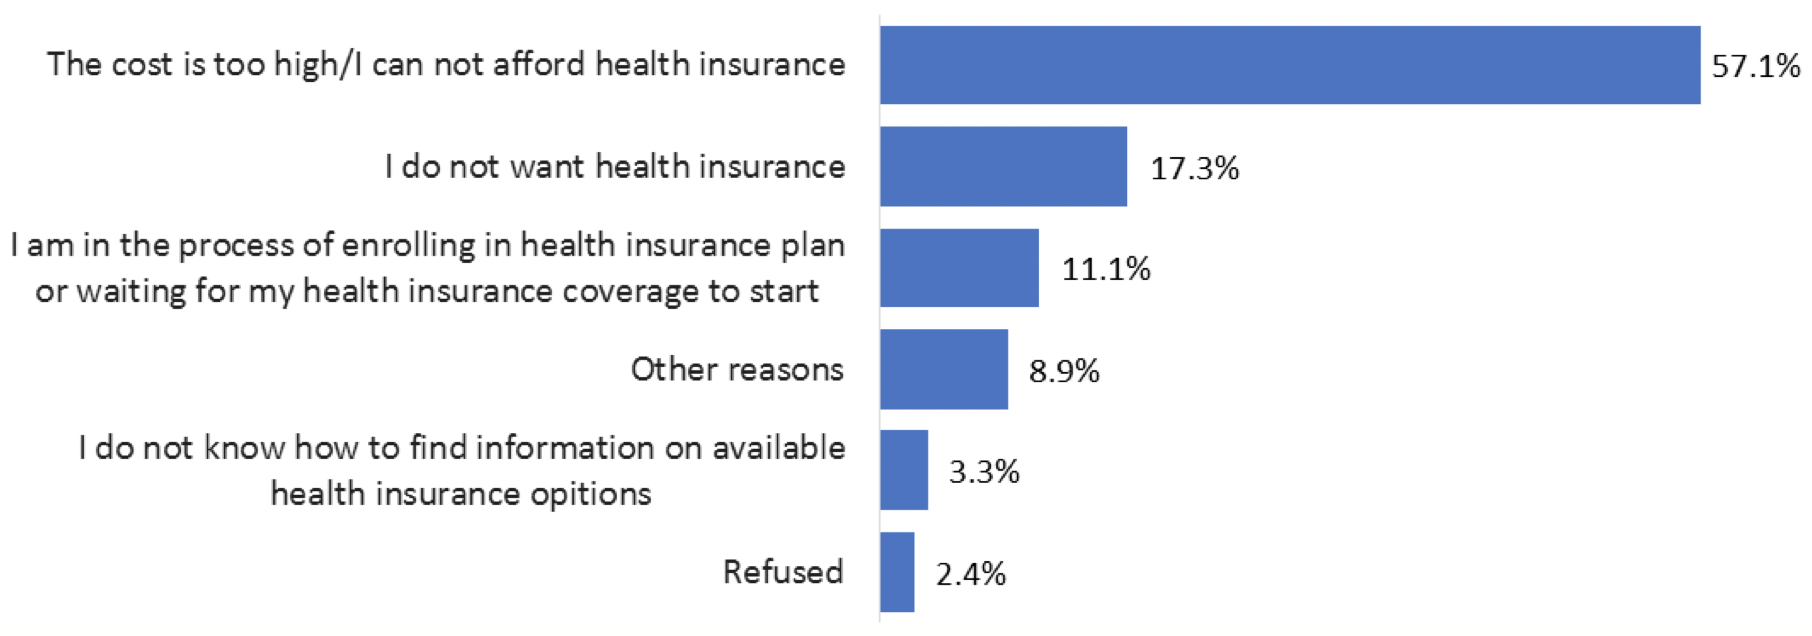
Figure 3 — Importance of the Possibility of a Fine to Uninsured Adult Texans, March 2015
Looking Ahead
In our next brief, we will explore the differences in access to care among insured and uninsured Texas adults.
Methodology
Each quarter’s HRMS sample of nonelderly adults is drawn from active KnowledgePanel® members to be representative of the US population. In the first quarter of 2013, the HRMS provided an analysis sample of about 3,000 nonelderly (age 18–64) adults. After that, the HRMS sample was expanded to provide analysis samples of roughly 7,500 nonelderly adults, with oversamples added to better track low-income adults and adults in selected state groups based on (1) the potential for gains in insurance coverage in the state under the ACA (as estimated by the Urban Institute’s microsimulation model) and (2) states of specific interest to the HRMS funders.
Although fresh samples are drawn each quarter, the same individuals may be selected for different rounds of the survey. Because each panel member has a unique identifier, it is possible to control for the overlap in samples across quarters.
For surveys based on Internet panels, the overall response rate incorporates the survey completion rate as well as the rates of panel recruitment and panel participation over time. The American Association for Public Opinion Research (AAPOR) cumulative response rate for the HRMS is the product of the panel household recruitment rate, the panel household profile rate, and the HRMS completion rate—roughly 5 percent each quarter.
While low, this response rate does not necessarily imply inaccurate estimates; a survey with a low response rate can still be representative of the sample population, although the risk of nonresponse bias is, of course, higher.
All tabulations from the HRMS are based on weighted estimates. The HRMS weights reflect the probability of sample selection from the KnowledgePanel® and post-stratification to the characteristics of nonelderly adults and children in the United States based on benchmarks from the Current Population Survey and the Pew Hispanic Center Survey. Because the KnowledgePanel® collects in-depth information on panel members, the post-stratification weights can be based on a rich set of measures, including gender, age, race/ethnicity, education, household income, homeownership, Internet access, primary language (English/Spanish), residence in a metropolitan area, and region. Given the many potential sources of bias in survey data in general, and in data from Internet-based surveys in particular, the survey weights for the HRMS likely reduce, but do not eliminate, potential biases.
The September 2013 HRMS has a design effect of 1.47 for nonelderly adults, and a sampling margin of error for a 50 percent statistic with 95 percent confidence of +/- 1.3 for the nonelderly adult sample. The design effect for the Texas data in March 2015 is 2.184 and the MOE is +/- 3.7. The survey fielded from March 5-30.


