
Introduction
In its 2022 State Business Tax Climate report, the Tax Foundation ranks Texas’ state unemployment insurance tax system as the 14th best in the nation, placing it in the top third of states’ unemployment insurance tax policies.1 The tax climate report measures the impact of state unemployment insurance tax components, including tax schedules and charging methods, on employers.2 In April 2022, the Department of Labor reported a national unemployment rate of 3.6% and high job growth across various industries nationwide.3 It also reported in March 2022 an unemployment rate of 4.4% for the state of Texas. Moreover, nationwide, March job openings were at a record high of 11.5 million for all industries.4 These data show that the labor market is thriving and firms are hiring.
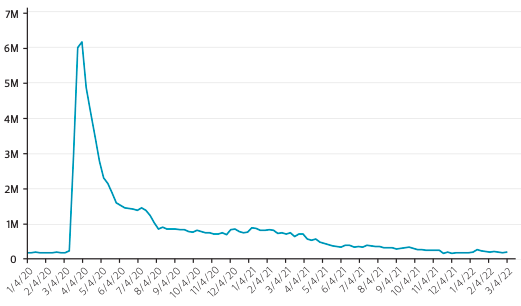
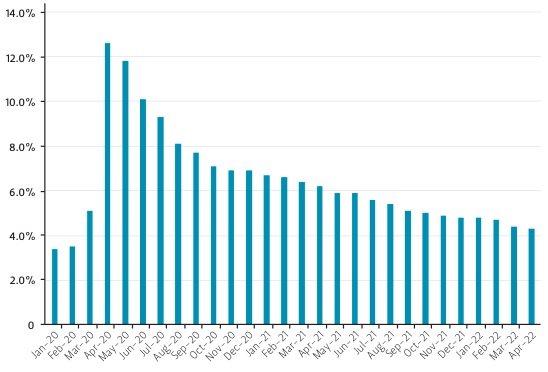
However, looking back just two years ago, the national unemployment rate hit a record 14.7% in April 2020,5 pictured in Figure 1. During the COVID-19 pandemic, state unemployment insurance programs across the country experienced a difficult period as never seen before. Prior to the economic downturn caused by the pandemic, the Great Recession of 2008 was thought to have been the most challenging time for state unemployment insurance programs over their 85-year life span.6 Yet, when analyzing the number of weekly initial unemployment insurance claims recorded for the United States since 1967, the top 20 recorded values occurred in the year 2020 alone, the highest of which was 6.2 million claims in the week ending on April 4, 2020.7 As shown in Figure 2, for Texas, the record high occurred in that same week with 315,167 claims,8 and that month the Texas unemployment rate rose to a record 12.6%.9 The record-breaking number of initial unemployment claims filed in April 2020 prompted Congress, states, and local governments to focus on providing financial support to employers and workers through emergency payroll tax relief packages.
Figure 1 — U.S. Monthly Unemployment Rate, Seasonally Adjusted (2020-2022)
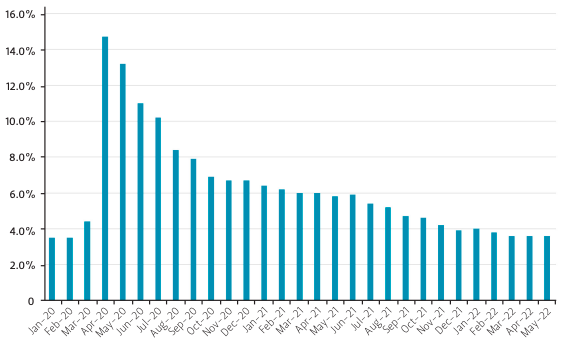
Figure 2 — U.S. Total Weekly Initial Unemployment Claims, Seasonally Adjusted (2020-2022)
This report reviews another aspect of the rise in unemployment claims— the national unemployment insurance program—and how it impacts employers. The unemployment insurance program is partly based on an employer tax called the state unemployment insurance (SUI) tax. The SUI tax is levied on businesses by states, and the experience rating is a unique component of the overall complex tax.10
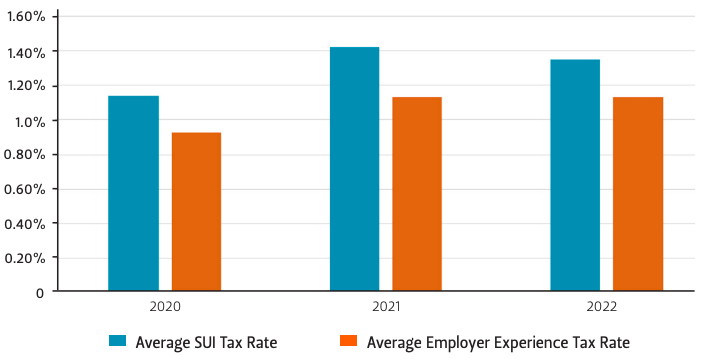
In response to the rise in unemployment and the persistence of the pandemic over the past two years, some states have taken measures to alleviate the financial strain the SUI tax can place on businesses. Since February 2021, the Texas Workforce Commission (TWC) has postponed significant increases to the previously established 2020 calendar year unemployment insurance tax rates,11 shown in Figure 5. For Texas employers, the average SUI tax paid decreased from 1.42% in 2021 to 1.35% in 2022 of taxable wages up to $9,000 per employee. The average experience rating tax was held constant at 1.13% of taxable wages in the calendar years 2021 and 2022.
Research suggests that a reduction in payroll taxes leads to more hiring.12 As such, the actions by the TWC to keep the tax rates low are assisting Texas businesses and supporting growth in the state’s labor market.
In March 2022, the Department of Labor reported that the average SUI cost for all private U.S. firms was 0.3% of total compensation in covered payroll.13 Additionally, the SUI cost for small firms with fewer than 100 employees was 0.4% of total compensation in covered payroll in the fourth quarter of 2021.14 Although a small percentage of total payroll, this tax can be largely out of the employer’s control due to internal layoffs, market demands, or unexpected shocks such as a pandemic. Experiencing a significant level of layoffs can increase a business’s SUI payroll tax rate; this is noteworthy for small businesses, which often face greater employment volatility. Economic fluctuations that cause layoffs have a direct impact on the experience rating component of the tax. In fact, researchers have found that while the SUI tax is a small cost for the majority of employers, in some post-recession years, more than 25% of employers paid annual SUI taxes greater than 1% of their total payroll.15 Researchers also suggest that the methodology for distributing these costs is of significant consequence and that the possibility of states improving their current experience rating systems is worth reviewing.16
History
The SUI tax, also known as the SUTA (State Unemployment Tax Act) tax, is an employer tax that requires businesses to contribute a percentage of their payroll to a state-run insurance program. In coordination with the Federal Unemployment Tax Act (FUTA) payroll tax, the SUI program is the pool of money from which laid off workers receive unemployment payments after submitting a claim. The system was established after another massive economic decline, the Great Depression, which lasted from 1929 to 1941. The Social Security Act of 1935 implemented this social insurance program across the nation.17 The design of the SUI program is unique, as the United States is the only nation in the world with an unemployment insurance program that bases an employer’s tax rate on its experience of laying off workers.18 The primary goal of the SUI system was to promote employment stability after the economic slump of the Great Depression. The country’s motion to establish such a system after the Great Depression is an example of how severe economic downturns can lead to the enactment of wide-reaching public policies to address a variety of fiscal issues. Although changes in public policy are often slow, this is an example of how significant changes can happen relatively quickly in times of great economic turmoil.
Researchers have suggested alternative methods19 to provide a baseline for states and their policymakers to rethink their current rating systems and consider new methodologies for financing in order to become more business-friendly. However, these suggestions have yet to be implemented. In fact, since the SUI system was established in 1935 by the U.S. Social Security Act, there has been very little change in the program and its design at individual state levels.20
SUI Rating Methodology
The SUI tax is a multifaceted system with individual components varying by state. Most states, however, have an experience rating component. Each year an employer is assigned an individual tax rate which is based on its unemployment risk, also known as the experience rating.21 Currently, 29 states and 2 territories use an experience rating system called the “reserve ratio” calculation to determine SUI tax rates, and 19 states, including Texas, use a “benefit ratio” calculation.22 These are the two experience rating systems most commonly used, either singularly or in combination with another of the four systems used across the nation. The other two are the “benefit wage ratio” and “payroll decline” methods.23 This report highlights the reserve ratio and benefit ratio experience rating systems.
Figure 3 — Texas' Total Weekly Initial Unemployment Claims, Not Seasonally Adjusted (2020-2022)
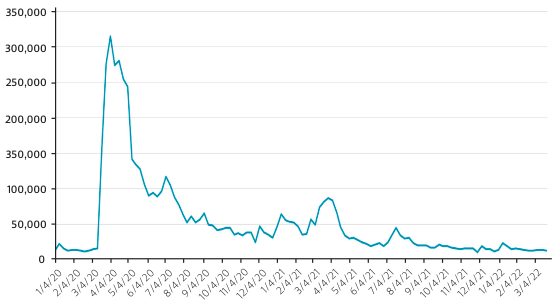
Figure 4 — Texas Monthly Unemployment Rate, Seasonally Adjusted (2020-2022)
Reserve Ratio
The reserve ratio system was the first experience rating method instituted by states in the 1930s. It is founded on the idea that individual employers are responsible for unemployment benefit charges, and that SUI costs should therefore not be pooled across all employers in a state. The reserve ratio for any given year for an individual employer is expressed as a percentage and is calculated as follows:
Reserve Ratio = 100% × [Employer reserve / Average taxable payroll] 24
Determining an employer’s reserve requires a record of all prior years’ SUI tax contributions, Ct, and SUI benefit charges, Bt. Benefit charges, or “chargebacks,” are the unemployment benefits paid to former employees that are charged to the employer’s tax account to calculate its SUI tax.25 The reserve is calculated as the cumulated difference between the two. An employer’s average taxable payroll is typically a simple average of the past three to five preceding fiscal years.
Employer reserve (Rt)= Σ(Ct-Bt),t=1…T
Average taxable payroll (APt) = [P(t – 3) + P(t – 2) + P(t – 1)] / 326
The reserve ratio for any given year T is then mapped into the state’s operative tax schedule to determine an employer’s tax rate for year T.27 There is an inverse relationship between an employer’s reserve ratio and their SUI tax rate; that is, a decrease in the reserve ratio (achieved by either a sizable decrease in the employer’s reserve or a sizable increase in the average taxable payroll) will typically raise the SUI tax rate and vice versa. This inverse relationship reveals a potentially problematic consequence of the reserve ratio method: an increase in employment will naturally lead to an increase in an employer’s average taxable payroll, which subsequently decreases the reserve ratio and increases the SUI tax rate, thus suggesting that the reserve ratio method could discourage employment growth.28 This is the exact opposite of the intended incentive of the SUI program. Another notable consequence of the reserve ratio method is in its determination of current employment risk. As businesses often experience employment growth or declines, because of the method’s reliance on historical data, some believe that the reserve ratio is not an effective way to measure current unemployment risk for employers.29 The suddenness and the severity of the pandemic demonstrates this shortcoming. For example, the years 2017– 2019 did not provide an accurate estimate of the risk employers faced in the fiscal year 2020.
Figure 5 — Texas Average Employer SUI Tax and Experience Tax Rates (2020-2022)
Benefit Ratio
In response to some of the aforementioned issues with the reserve ratio system, some states adopted the benefit ratio method. This method is also based on the idea that employers are individually responsible for unemployment benefit charges.30 Whereas the reserve ratio takes into account the cumulative difference between tax contributions and benefit charges over all past years, the benefit ratio method only considers the benefits charged over a shorter term (typically three to five years). Because of this, the benefit ratio is regarded as a more accurate reflection of recent labor market conditions.31
The benefit ratio calculation is as follows:
Benefit ratio = 100% x [sum of benefit charges, B, over i years] / [Sum of taxable wages, P, over i years] = 100% x 1T = iB(T – i) / [1T = iP(T – i – 1)],32
where, T represents the current year and i designates the time frame (three to five years). Note that the denominator in this ratio is not a simple average of taxable wages over three to five years, but a summation of taxable wages over three to five years. In contrast to the reserve ratio, there is a direct relationship between the benefit ratio of an individual employer and their tax rate; that is, as the benefit ratio decreases (either due to a sizable decrease in benefit charges or a sizable increase in the taxable wages over three to five years), the corresponding tax rate for employers increases.
In 1969, the state of Texas altered its system of determining an employer’s experience rating from the benefit wage ratio method to the benefit ratio method, and it remains the same to this day.33 The Texas SUI tax rate, also referred to as the effective tax rate, and its components are shown in Figure 6.
Figure 6 — Texas Workforce Commission Effective Tax Rate
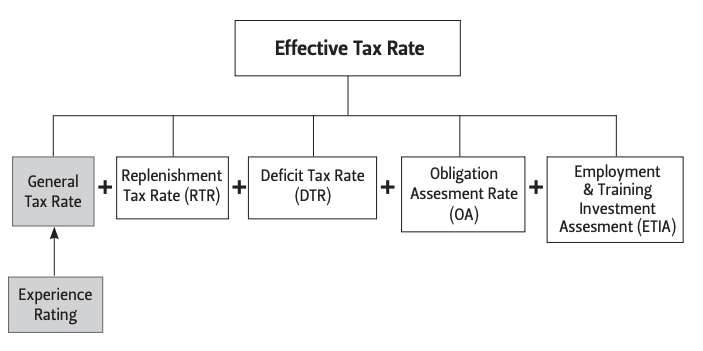
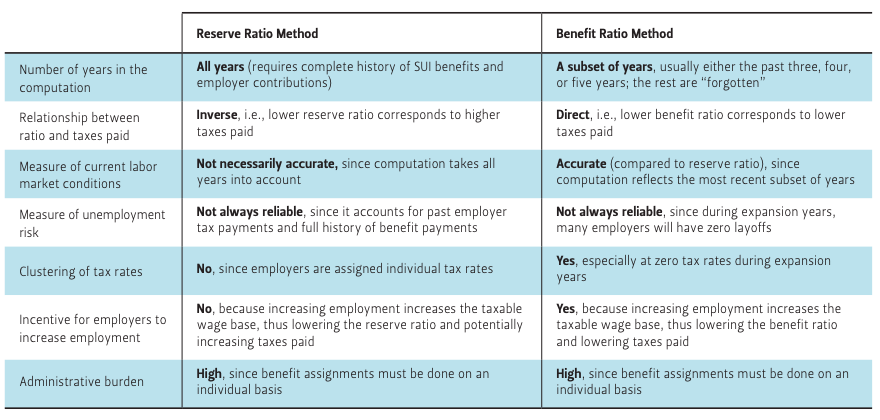
Table 1 — A Comparison of the Reserve Ratio and Benefit Ratio Methods
Suggested Alternative Methods
A 2019 study by Michael Miller and Robert Pavosevich offers two theoretical methods as alternatives to the current experience rating system40, and both share the goal of employment stability. One method is Employment Variation (EV), which would incentivize employment growth rather than penalize an employer with a higher tax. The researchers propose that once the employment variation index is computed, states calculate an annual premium to assess specific tax rates for each individual employer, which would be similar to the modern-day insurance companies' process of assessing rates. They note that this would help to transition the aged SUI system into current times. The Employment Variation calculation is as follows:41
Employment change percentage (t) = 100%× [Employment (t) - Total employment ( t- 1)]/(Average employment)
where, average employment = the average quarterly employment taken over three years (or 12 quarters), t signifies the current quarter, and t – 1 the prior quarter.
Employment variation index = [(Sum of positive change percentages) + (W × Sum of negative change percentages)]/12
where, W is the weighting factor applied to negative employment changes.
The researchers note two potential issues that could occur with this method. One is the issue of zero employment for an employer during a particular quarter, due to a seasonal shutdown, for example, or another business operations closure. In this scenario, employment variation cannot be calculated, since in a zero-employment quarter there would be a zero divisor. In order to accommodate such a period, the zero employment quarters would be dropped from the average and the total average employment over the remaining quarters would be used as the denominator.
Another issue the study cites is the possibility of a business experiencing a zero-average employment change due to an increase in employment countered by an exact same decrease in employment. In other words, in this scenario, there is a net change of zero in employment over a given time period, even though the employer experienced a variation. However, this net of zero would give a “false” calculation, not taking into account the actual shift in employment for the employer. This would allow for an employer to have the same average employment change as other employers who were able to keep a constant employment. A “net zero” employer’s contribution to the increase in costs to the SUI system would not result in the correct allocation of the appropriate rating to that employer. As such, the researchers note, to remedy this situation, that the EV method places more weight on reductions in employment. The weighting therefore rewards businesses with employment increases; this is referenced as the employment variation index. Establishments with higher hiring rates would receive lower tax rates.
The researchers also note that a drawback of the EV method is that employers could use the net-zero effect to lay off higher-wage earners and replace them with lower-wage earners. With a method using a chargeback, an employer would be penalized for such an action. But, as the researchers note, there remains a tax incentive for the employer to hire qualified workers without laying off any employees.
Additionally, the EV system does not provide immunity for industries experiencing high unemployment or businesses suffering from continual layoffs. These types of employers will still experience higher tax rates, but the researchers note that this holds true for experience rating systems such as the reserve ratio and benefit ratio structures as well.
The second method that Miller and Pavosevich propose is Payroll Variation (PV). This option is similar to EV, except that it is based on changes in an employer’s overall payroll due to staffing levels or due to changes in wages offered to its workers. The PV method would allow for employers to receive lower SUI tax rates relative to other employers in the state with larger increases in gross payroll. Businesses with larger relative decreases in their payrolls would be assigned the higher tax rates. Similar to the EV method, the PV method would stabilize state employment and reward businesses that hire more workers. The researchers note that another advantage is that PV would incentivize employers to increase employee wages. Thus, in this case, businesses would be encouraged to fill higher-wage jobs instead of lower-wage jobs, as well as to seek to fill full-time rather than part-time positions. They also note that the administration of a PV system could be less difficult to establish than that of EV, since most states already collect wages through SUI programs. The researchers indicate that employer wages would need to be clearly defined in order to prevent businesses from overstating payrolls caused by wage increases due to discretionary payouts, such as yearend bonuses. They also suggest that the decision to increase wages would need to be monitored by each business based on its individual circumstances as it recovers from downturns, but this method over the long term still furthers the goal of employment stability. The Payroll Variation calculation is as follows:42
Payroll change percentage (t) = 100% × [Total wages / (t) - Total wages (t - 1)] / (Average total wages)
where, average total wages = the average quarterly employment taken over three years (or 12 quarters), t signifies the current quarter, and t – 1 the prior quarter.
Payroll variation index = [(Sum of positive change percentages) + (W × Sum of negative change percentages)]/12
where, W is the weighting factor applied to negative payroll changes.
Miller and Pavosevich suggest that these alternatives would only affect the distribution of the tax rates and not the overall tax rate, which would allow for employers with the most growth in their employment rates to be assigned the lowest SUI rates.
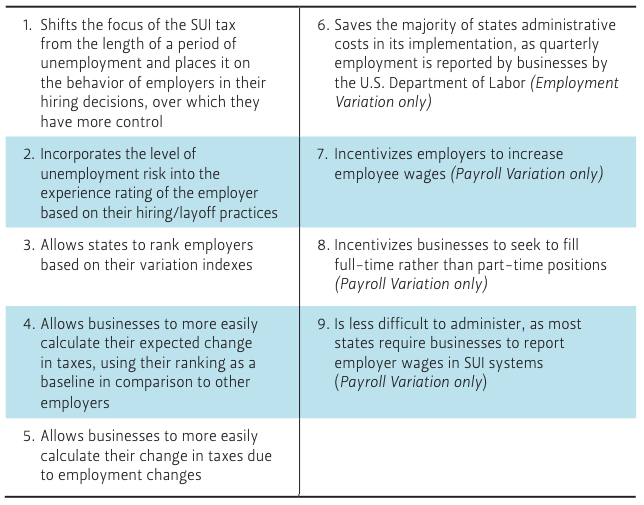
Table 2 — A Summary of Benefits of Both Employment and Payroll Variation Methods (Unless Otherwise Noted)
Conclusion
Because of the economic impact of COVID19, SUI programs were widely used to pay out benefits. State programs were heavily tested as were business owners, due to no fault of their own. The decision by some states, such as Texas, to hold experience rating levels steady has halted increases in employers’ tax rates; however, based on the structure of the experience rating,43 it is inevitable that the rates will rise in the future to accommodate future funding of the SUI program. The TWC’s short-term interventions have provided stability to businesses that are the financial backbone of the SUI tax system. Employment stability can only occur if businesses are stable and if a state has a supportive business environment. Since the start of the pandemic, the TWC’s initiatives demonstrate state policymakers’ continued efforts to positively impact Texas’ labor economy and promote its economic growth.
Although there have been no major changes to the SUI system over its life span, alternative experience rating methods that would offer lower taxes for businesses that are proactive in maintaining or increasing staffing levels have been suggested. Such tax structures would be ideal in a “we’re hiring” market like the one currently occurring. It is to a business’s advantage to reduce labor turnover or large shifts in employment; this lowers the administrative costs of hiring or laying off workers, in addition to helping the employer to maintain qualified workers. Even if the alternative methods offered by Miller and Pavosevich are not chosen, a post-pandemic evaluation of the current SUI system and ways to improve it should be considered. Policymakers can use the pandemic as a springboard to consider structural improvements to a system that is sponsored by and provides long-term support to businesses.
Endnotes
1. Jannelle Cammenga and Jared Walczak, 2022 State Business Tax Climate Index, Tax Foundation, (2021), 50, https://files. taxfoundation.org/20220104110127/2022- State-Business-Tax-Climate-Index3.pdf
2. “Unemp. Insur. Taxes,” Tax Foundation, accessed April 4, 2022, https:// statetaxindex.org/tax/unemployment/.
3. U.S. Department of Labor, Bureau of Labor Statistics, “The Employment Situation — April 2022.”
4. U.S. Department of Labor, Bureau of Labor Statistics, "Job Openings and Labor Turnover – March 2022," https://www.bls. gov/news.release/archives/jolts_05032022. pdf; U.S. Department of Labor, Bureau of Labor Statistics, “State Employment and Unemployment — March 2022.”
5. U.S. Department of Labor, “The Employment Situation — May 2022.”
6. Wayne Vroman, Unemployment Insurance and the Great Recession, The Urban Institute (December 2011), 1.
7. “Unemployment Insurance Weekly Claims Data," U.S. Department of Labor, Employment & Training Administration, accessed April 4, 2022, https://oui.doleta. gov/unemploy/claims.asp.
8. “Unemployment Insurance Weekly Claims Data," U.S. Department of Labor.
9. “Local Area Unemployment Statistics” U.S. Bureau of Labor Statistics, accessed April 4, 2022, https://www.bls.gov/lau/data.htm.
10. Daniel N. Price, “Unemployment Insurance, Then and Now, 1935–85,” Social Security Bulletin, no.10 (October 1985), 30, https://www.ssa.gov/policy/docs/ssb/ v48n10/v48n10p22.pdf.
11. “TWC Postpones Setting 2021 Employer Tax Rates,” Texas Workforce Commission, accessed April 4, 2022, https://www.twc.texas.gov/news/ covid-19-resources-employers.TWC Sets Stable Employer Tax Rate to Promote Continued Business Recovery," Texas Workforce Commission,” accessed April 4, 2022, https://www.twc.texas.gov/news/ twc-sets-stable-employer-tax-ratepromote-continued-business-recovery; “Texas Workforce Commission Adopts No New Increases to Employer Tax Rates for 2022,” Texas Workforce Commission, accessed April 4, 2022, https://www.twc. texas.gov/texas-workforce-commissionadopts-no-new-increases-employertax-rates-2022#:~:text=AUSTIN%20 %E2%80%93%20On%20November%20 23%2C%202021,closures%20outside%20 of%20their%20control.
12. U.S. Congressional Budget Office, Policies for Increasing Economic Growth and Unemployment in 2010 and 2011 (January 2010): 19.
13. U.S. Department of Labor, Employer Costs for Employee Compensation — December 2021 (news release), Table 1, accessed April 8, 2022, https://www.bls. gov/news.release/pdf/ecec.pdf.
14. U.S. Department of Labor, Employer Costs for Employee Compensation — December 2021.
15. Michael Miller and Robert Pavosevich, “Alternative Methods of Experience Rating Unemployment Insurance Employer Taxes,” Public Budgeting & Finance 39, no. 4 (November 2019): 4.
16. Miller and Pavosevich, “Alternative Methods of Experience Rating Unemployment Insurance Employer Taxes.”
17. Price, “Unemployment Insurance, Then and Now, 1935–85.”
18. Miller and Pavosevich, “Alternative Methods of Experience Rating Unemployment Insurance Employer Taxes,”28.
19. Miller and Pavosevich, “Alternative Methods of Experience Rating Unemployment Insurance Employer Taxes,” 28–47.
20. Price, “Unemployment Insurance, Then and Now, 1935–85.”
21. Miller and Pavosevich, “Alternative Methods of Experience Rating Unemployment Insurance Employer Taxes,” 28.
22. Wayne Vroman et al., A Comparative Analysis of Unemployment Insurance Financing Methods, The Urban Institute, December 2017, 48; U.S. Department of Labor, “Financing: The Federal Tax and the Federal Unemployment Trust Fund (UTF),” https://oui.doleta.gov/unemploy/pdf/ uilawcompar/2019/financing.pdf.
23. Vroman et al., A Comparative Analysis of Unemployment Insurance Financing Methods., 48.
24. Miller and Pavosevich, “Alternative Methods of Experience Rating Unemployment Insurance Employer Taxes,” 32.
25. Texas Workforce Commission Effective Tax Rate, “Your 2022 Tax Rates,” accessed April 4, 2022, https:// www.twc.texas.gov/businesses/ your-tax-rates#:~:text=Effective%20 Tax%20Rate,-Your%20Effective%20 Tax&text=Minimum%20Tax%20Rate%20 for%202020,%249%2C000%20per%20 employee%20per%20year.
26. Vroman et al., A Comparative Analysis of Unemployment Insurance Financing Methods, 30.
27. Ibid.
28. Ibid., 38.
29. Ibid.
30. Miller and Pavosevich, “Alternative Methods of Experience Rating Unemployment Insurance Employer Taxes,” 34.
31. Vroman et al., A Comparative Analysis of Unemployment Insurance Financing Methods, 39. https://www.dol. gov/sites/dolgov/files/OASP/legacy/files/AComparative-Analysis-of-UnemploymentInsurance-Financing-Methods-FinalReport.pdf.
32. Ibid., 33.
33. Ibid., 47.
34. Texas Workforce Commission Effective Tax Rate, “Your 2022 Tax Rates.”
35. Miller and Pavosevich, “Alternative Methods of Experience Rating Unemployment Insurance Employer Taxes,” 35.
36. Vroman et al., A Comparative Analysis of Unemployment Insurance Financing Methods, 39. 37. Miller and Pavosevich, “Alternative Methods of Experience Rating Unemployment Insurance Employer Taxes,” 35.
38. Ibid.
39. Ibid.
40. Miller and Pavosevich, “Alternative Methods of Experience Rating Unemployment Insurance Employer Taxes,” 36–41.
41. Ibid., 36-37.
42. Ibid., 40-41.
43. Vroman et al., A Comparative Analysis of Unemployment Insurance Financing Methods, 24.
This material may be quoted or reproduced without prior permission, provided appropriate credit is given to the author and Rice University’s Baker Institute for Public Policy. The views expressed herein are those of the individual author(s), and do not necessarily represent the views of Rice University’s Baker Institute for Public Policy.


