
Executive Summary
Trade and financial shocks have worsened Latin America’s economic prospects over the past year. World trade is experiencing stagnation and commodity prices have collapsed. The latter phenomenon and the turmoil in emerging capital markets have led to increased costs and reduced availability of external financing. However, while the commodity shock is likely to last, the financial shock will probably be weaker than during past crises. In any case, Latin America—and South America in particular—will perform poorly both in 2015 and 2016.
In an issue brief published by the Baker Institute a year ago (Ocampo 2014), I referred to Latin America’s excellent record during the 2003-2013 decade, particularly in social terms, but also to the mounting economic challenges the region was starting to face. The year since then has been one of weakening performance, reflecting in particular the collapse of Venezuela’s economy, the deepening crisis in Brazil, and the economic slowdown of most South American countries. Overall, South America will experience a recession in 2015 and Latin America as a whole will hardly grow.
At the international level, the spread of the slowdown in emerging economies is now associated with a contraction of international trade, particularly in value terms, and with the turmoil in emerging countries’ capital markets that was particularly strong in August and September 2015. The latter included China’s stock market collapse, its global repercussions, its effects on commodity prices, the August 11 devaluation of the renminbi, the downgrade of Brazilian debt to junk status by Standard & Poor’s on September 9, and the major uncertainties surrounding the possible increase of the U.S. Federal Reserve funds rate. The last has been deferred for the time being thanks to the Fed’s decision on September 17 to keep rates unchanged as a response to global uncertainties (though with the implicit assumption that rates would nonetheless be increased in the near future).
The Exceptional Conditions Surrounding the 2003–2013 Decade
As argued in my previous brief, in economic terms the first part of the 2003-2013 decade was truly exceptional. GDP growth reached a rate of 5.4% a year between 2003-2007, the best experienced by the region since the period from 1967 to 1974. A notable achievement during this period was the improvement in Latin America’s external balance sheet, as reflected in a sharp reduction of the external debt net of foreign exchange reserves, which fell from an average of 28.6% of GDP between 1998-2002 to 5.7% in 2008. Although the 2008-2009 North Atlantic financial crisis1 hit hard, particularly in Mexico, recovery was fast. This was facilitated by a rapid renewal of access to financial markets and by the counter-cyclical policies that countries adopted. However, the exceptional year 2010 aside, which largely reflected a recovery from the 2009 recession, growth did not return to the exceptional record earlier in the decade, but rather to the mediocre average performance experienced over the past quarter century: 3.1% between 2007-2013, quite similar to the average 3.2% rate between 1990-2014.
An interpretation of the exceptional performance between 2003-2007 is that, beyond the clear advances in macroeconomic policies, there was an extraordinary coincidence of four positive external factors: (i) rapid growth of international trade; (ii) booming commodity prices; (iii) good access to external financing at the best terms since the second half of the 1970s; and (iv) migration opportunities (regular and irregular) to the United States and Spain. Only one negative factor affected the region: Mexico’s loss of market share in the U.S. market due to competition from China. Of the positive conditions, the first and last disappeared with the North Atlantic financial crisis. As for the second item on the list, non- oil commodity prices started to weaken in 2012 and oil prices collapsed in the second half of 2014. Thus, only one positive element was left—good access to external financing—and this now seems at risk.
Worsening Trade Conditions
Many of the added uncertainties facing Latin America are associated with China’s economy. This reflects the strong slowdown of the Chinese export and industrial engines, which is not totally reflected in its GDP figures,2 and also of the stock market collapse during the past summer and high corporate debt ratios. There is also a sense of reduced freedom and of hesitation by Chinese authorities, in sharp contrast with the major decisions and certainty that they conveyed in the face of the adverse 2008-2009 shock. The Chinese connection is, of course, critical for Latin America, due to the fact that it has been the most dynamic trading partner for the region over the past decade (ECLAC 2015, Ch. III). Also crucial is the centrality of Chinese demand in global commodity markets and the significant degree of contagion that characterizes international financial markets, which was revealed in the global repercussions of China’s August 2015 stock market crash.
Figure 1 — World Exports (January–June 2008 = 100)
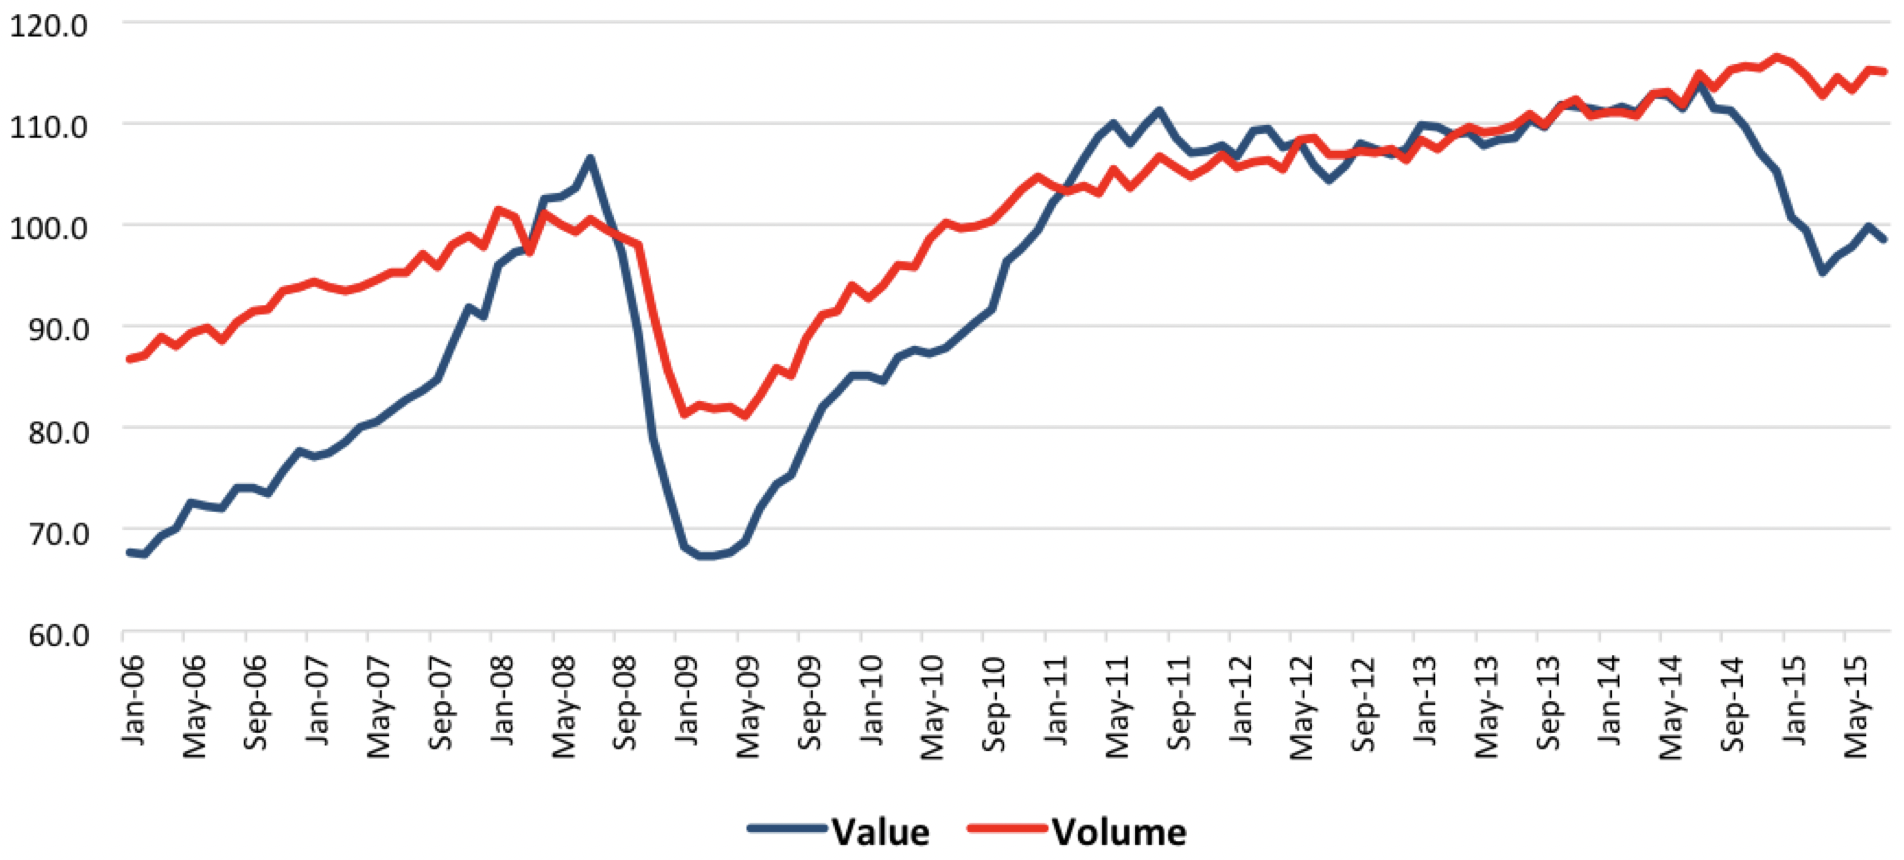
The two elements of the recent trade turmoil are shown in Figures 1 and 2. The first shows the evolution of international trade, as reflected in both the volume and value of global exports. As Figure 1 indicates, the dramatic contraction that took place after the Lehman Brothers collapse was followed by a rapid recovery, but also by very slow growth since 2011. The net effect is that world trade in recent years has experienced the slowest growth since World War II. This is due not only to the slower expansion of the world economy but also to the lowest income elasticity of world trade to GDP (the ratio of the growth rate of trade to that of GDP) of the post-war period. As major global institutions have recently recognized, this reflects not only cyclical but structural factors associated with the dynamics of world trade.3
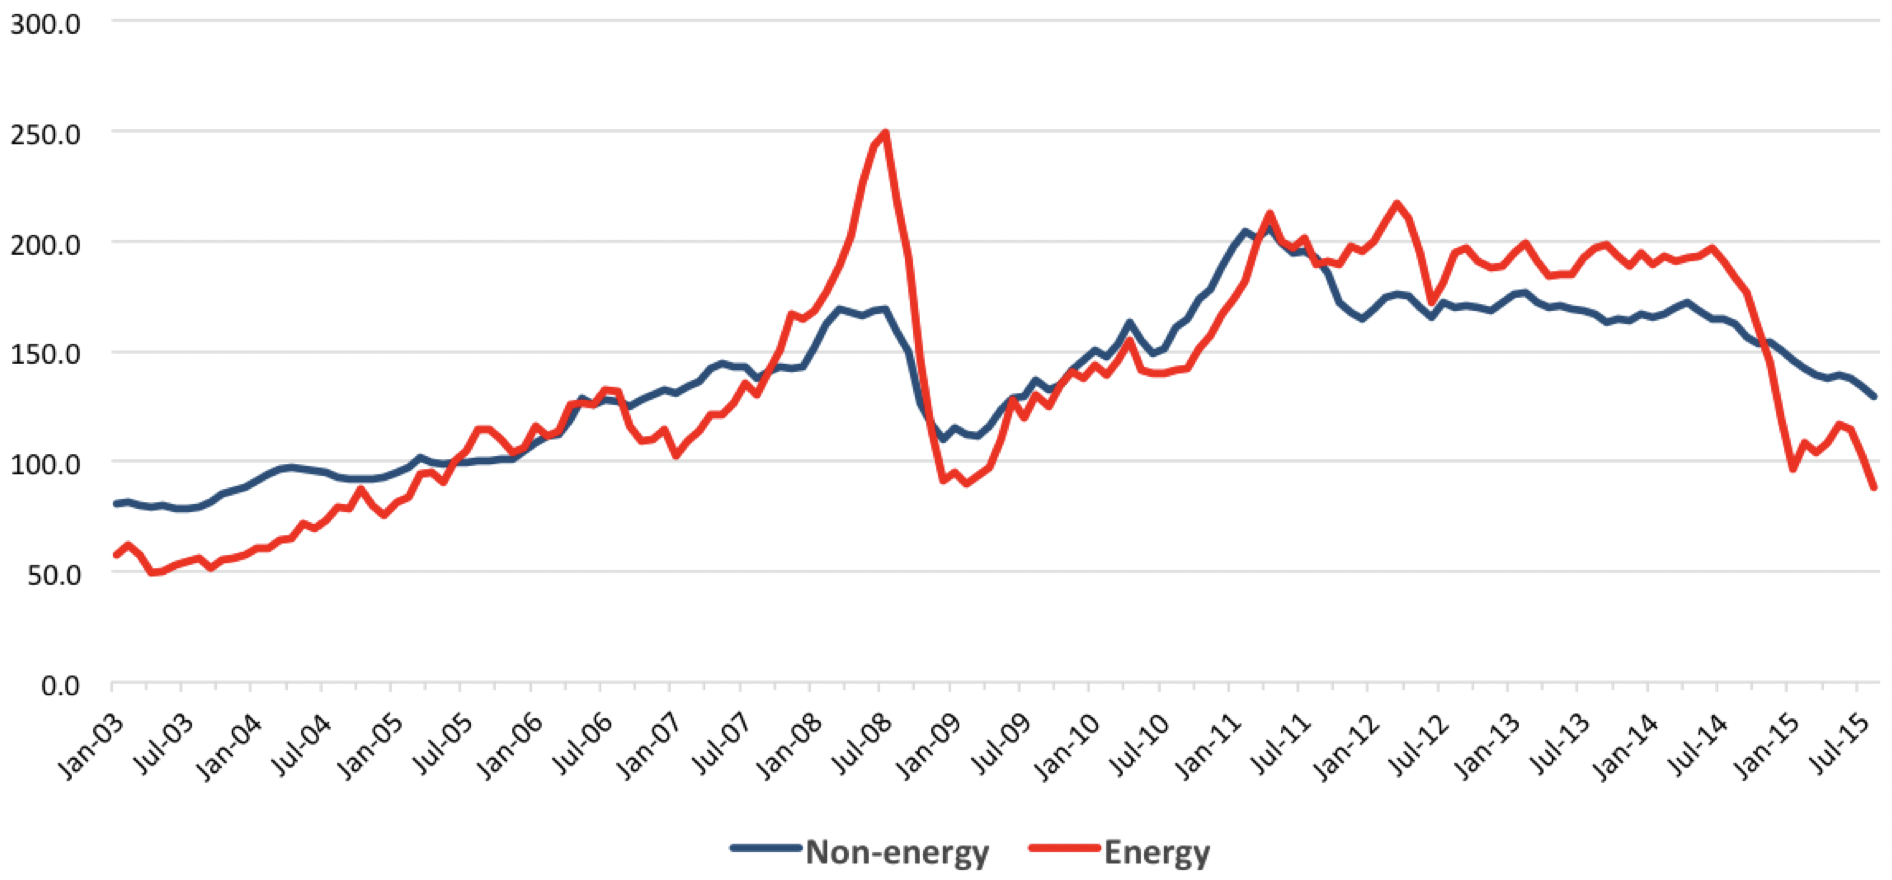
Figure 2 — Commodity Prices, IMF (2005 = 100)
Recent events include the stagnation or even small contraction in the volume of world exports since late 2014 and the strong reduction of the value of world exports since mid-2014. As the background information4 for Figure 1 indicates, the first of these processes has been essentially associated with emerging Asia, which had been the most dynamic component of world trade after the Lehman collapse; the volume of exports of emerging Asia between January-July 2015 indeed shows a mild contraction (-0.1%) relative to a year before. This is what China’s export data also indicates. Interestingly, the same data shows that Latin America has made a great effort to counteract the fall in commodity prices with an increase in export volumes.
In turn, the reduction in world export values is associated with the collapse of commodity prices, as shown in Figure 2.5 Non-oil commodity prices have fallen by about one-third with respect to their 2011 peak, and energy prices have fallen by one- half. In late August and September, both experienced further downward trends not shown in the IMF data reproduced in the figure, as alternative estimates indicate.6
If real commodity prices follow the long-term cycles of around 30 years that they have experienced since the late 19th century (Erten and Ocampo, 2013), we may be seeing the first phase of a prolonged period of falling and low real commodity prices. In other words, this may not be just a cyclical phenomenon generated by the slowdown in Chinese demand.
Financial Turmoil
Figure 3 — Latin America: Yields and Spreads on Sovereign Bonds, 2003–September 2015
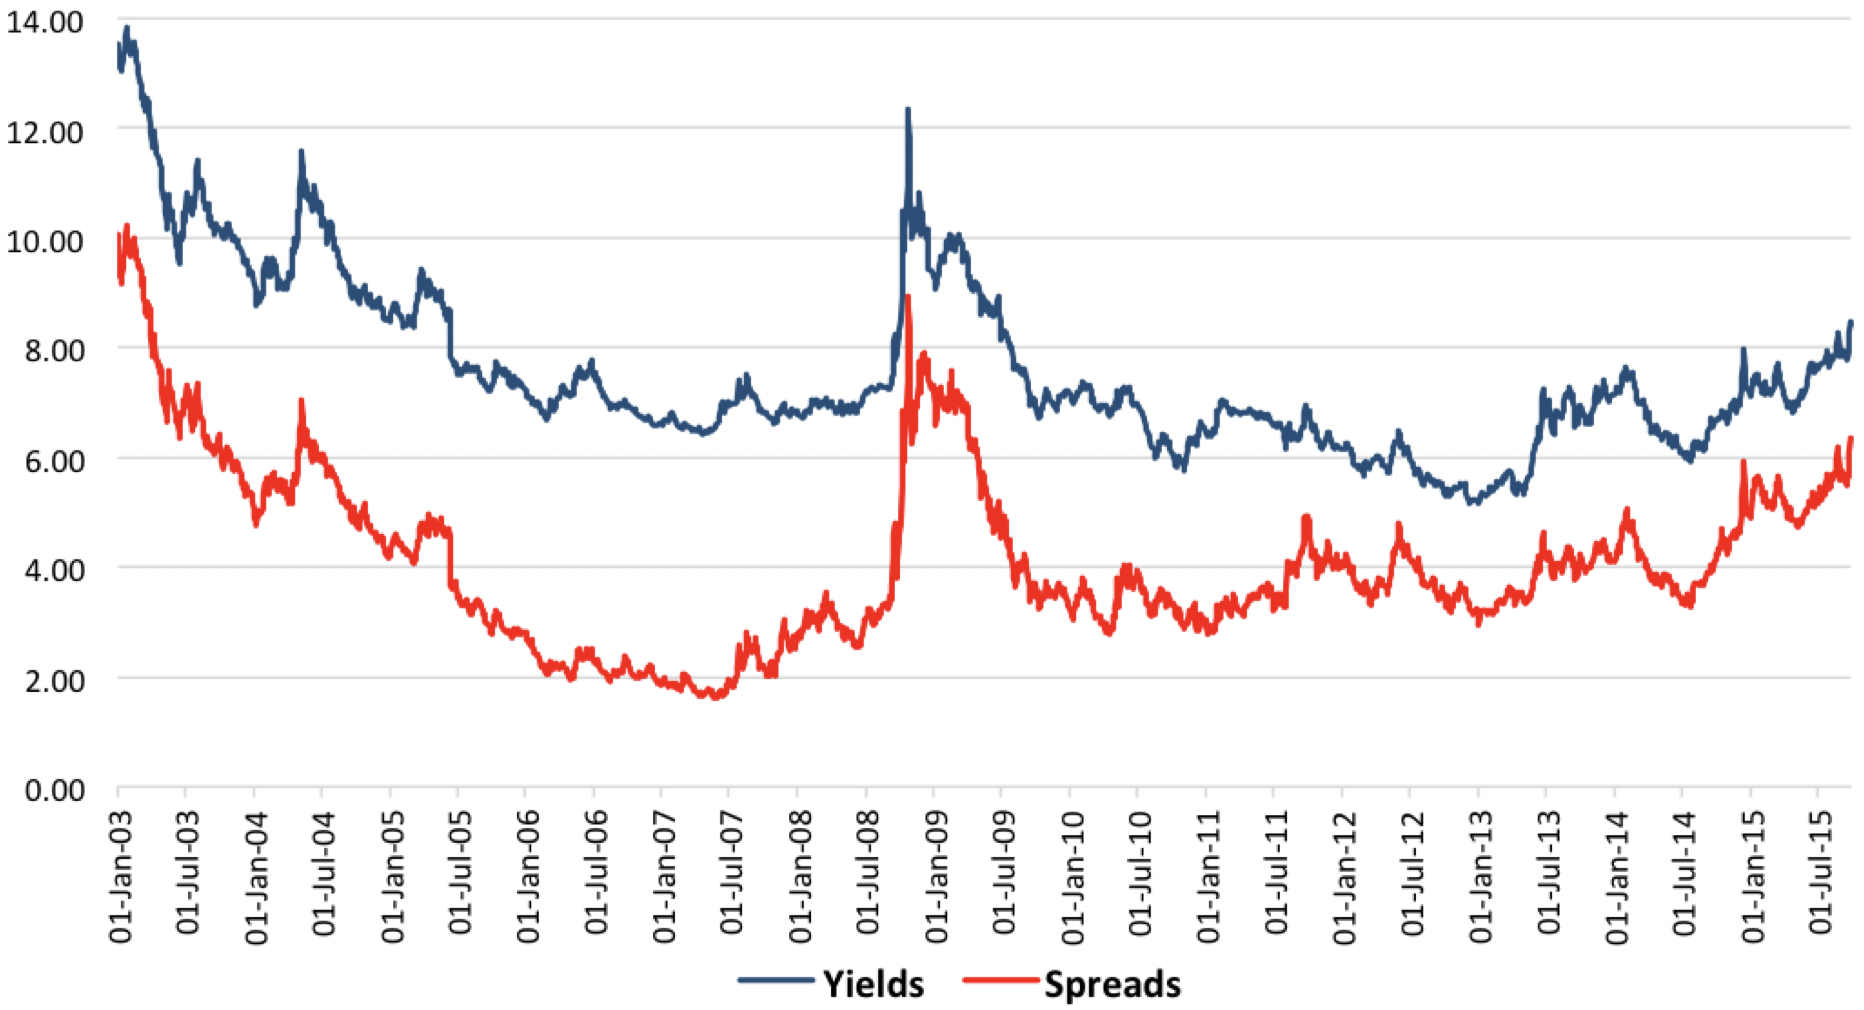
What can we say about access to international finance, the last element of the 2003-2007 boom that remained in place? It is unquestionable that external financing to emerging economies continues to be strongly pro-cyclical. However, the associated cycles have moderated substantially in the case of Latin America. As Figure 3 shows, the Lehman shock generated a reversal of the very favorable risk spreads and yields (financing costs) that prevailed prior to the North Atlantic financial crisis. But the shock was very moderate by historical standards: it lasted for about a year, versus six years in the late 1990s/early 2000s and eight years during the Latin American debt crisis of the 1980s.7 Furthermore, later shocks had only minor effects on Latin American risk spreads and yields, particularly the turmoil in the Eurozone between 2011-2012, and the announcements of the Fed’s tapering of bond purchases in May 2013, the initial adverse effect of which was actually reversed during the first half of 2014. No less importantly, Latin America has been benefitting from a new source of financing, China, which has helped in particular those countries without access to international private capital markets.8
Figure 4 — Sovereign Debt Spreads, July–September 2015 (Basis Points)
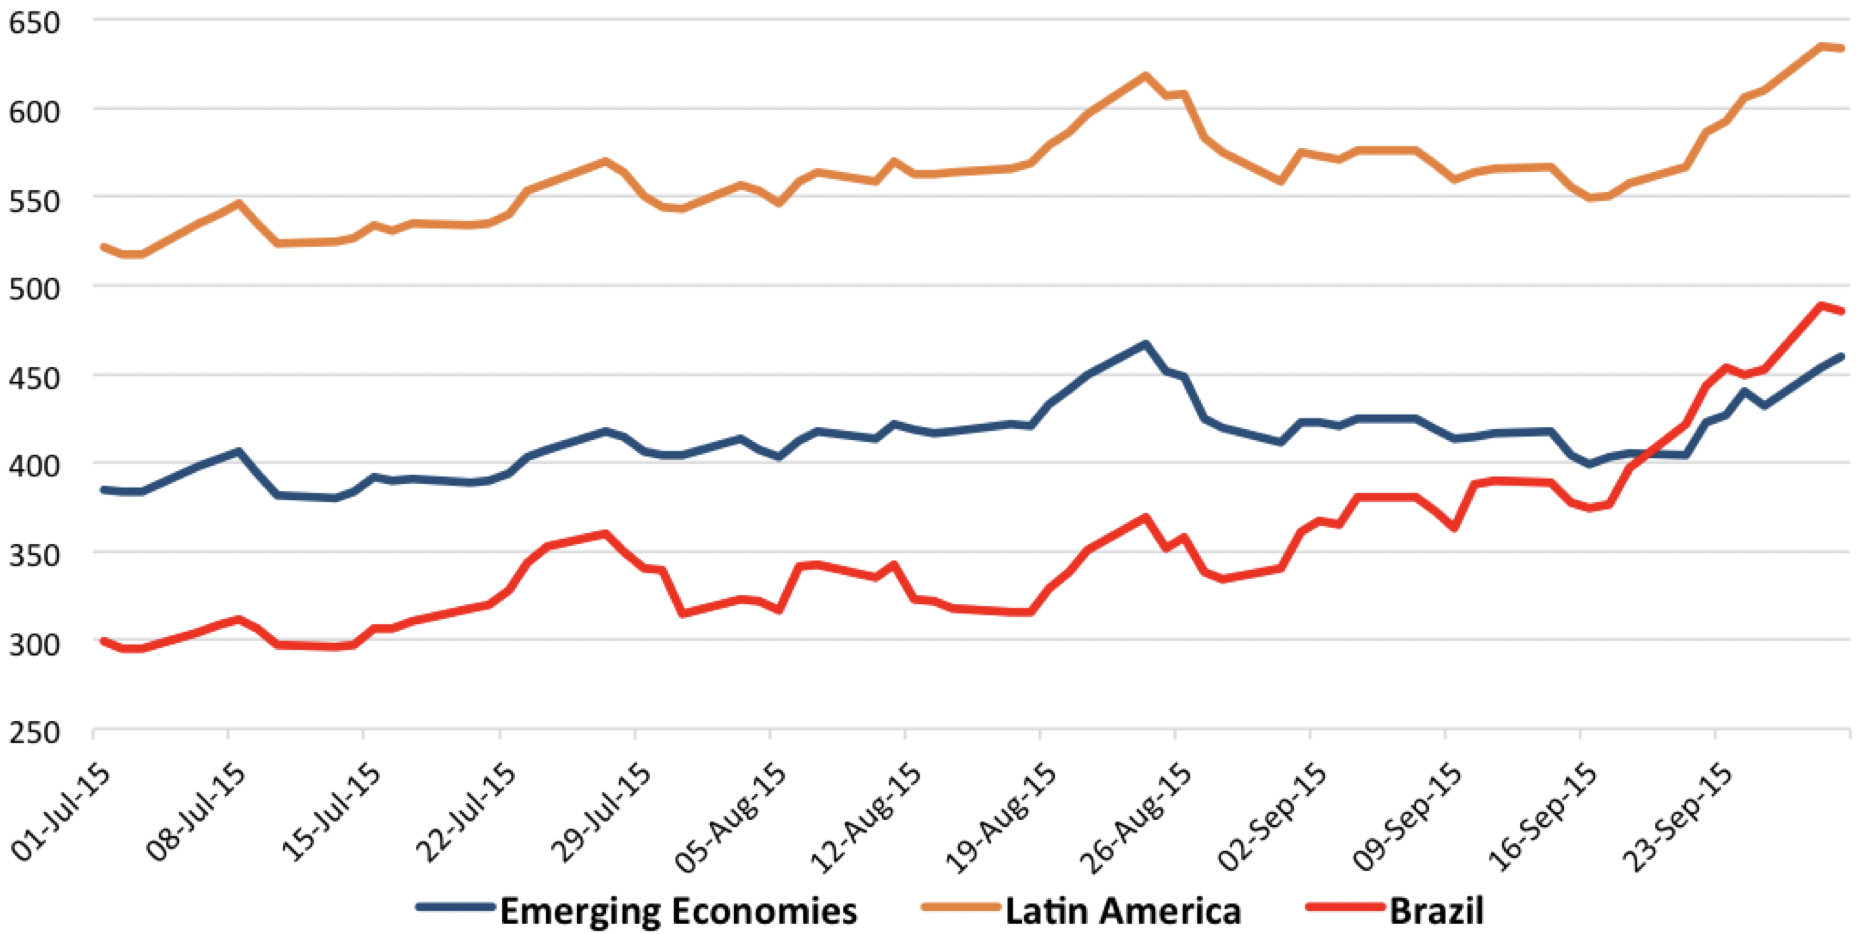
In terms of access to external finance, conditions may be changing, however. This is reflected in the net capital outflows from emerging economies that has taken place for several quarters now. In turn, in terms of risk spreads, the accumulation of the negative shocks associated with the collapse of commodity prices during the second half of 2014 and the turmoil in global markets between July-September 2015 has led to an increase of risk spreads of around two percentage points (200 basis points). This has also had major effects on exchange rates in several countries, particularly in Brazil and Colombia. Brazil’s downgrade by Standard & Poor’s, as well as the economic and political uncertainties that surround the conjuncture of the largest Latin American economy, are reflected in the sharp increase in Brazil’s risk spreads, particularly since mid-September, which is the major explanation for the widening of Latin America’s spreads vis-à-vis the average for emerging countries (Figure 4). In any case, as Figure 3 indicates, the accumulated increase in the costs of financing is still smaller than those experienced after the Lehman shock or in the late 20th century (not shown in the graph).
Figure 5 — Issuance of Latin American Bonds, 2003–Sept 2015 (Billion Dollars, Monthly Figures and Average)
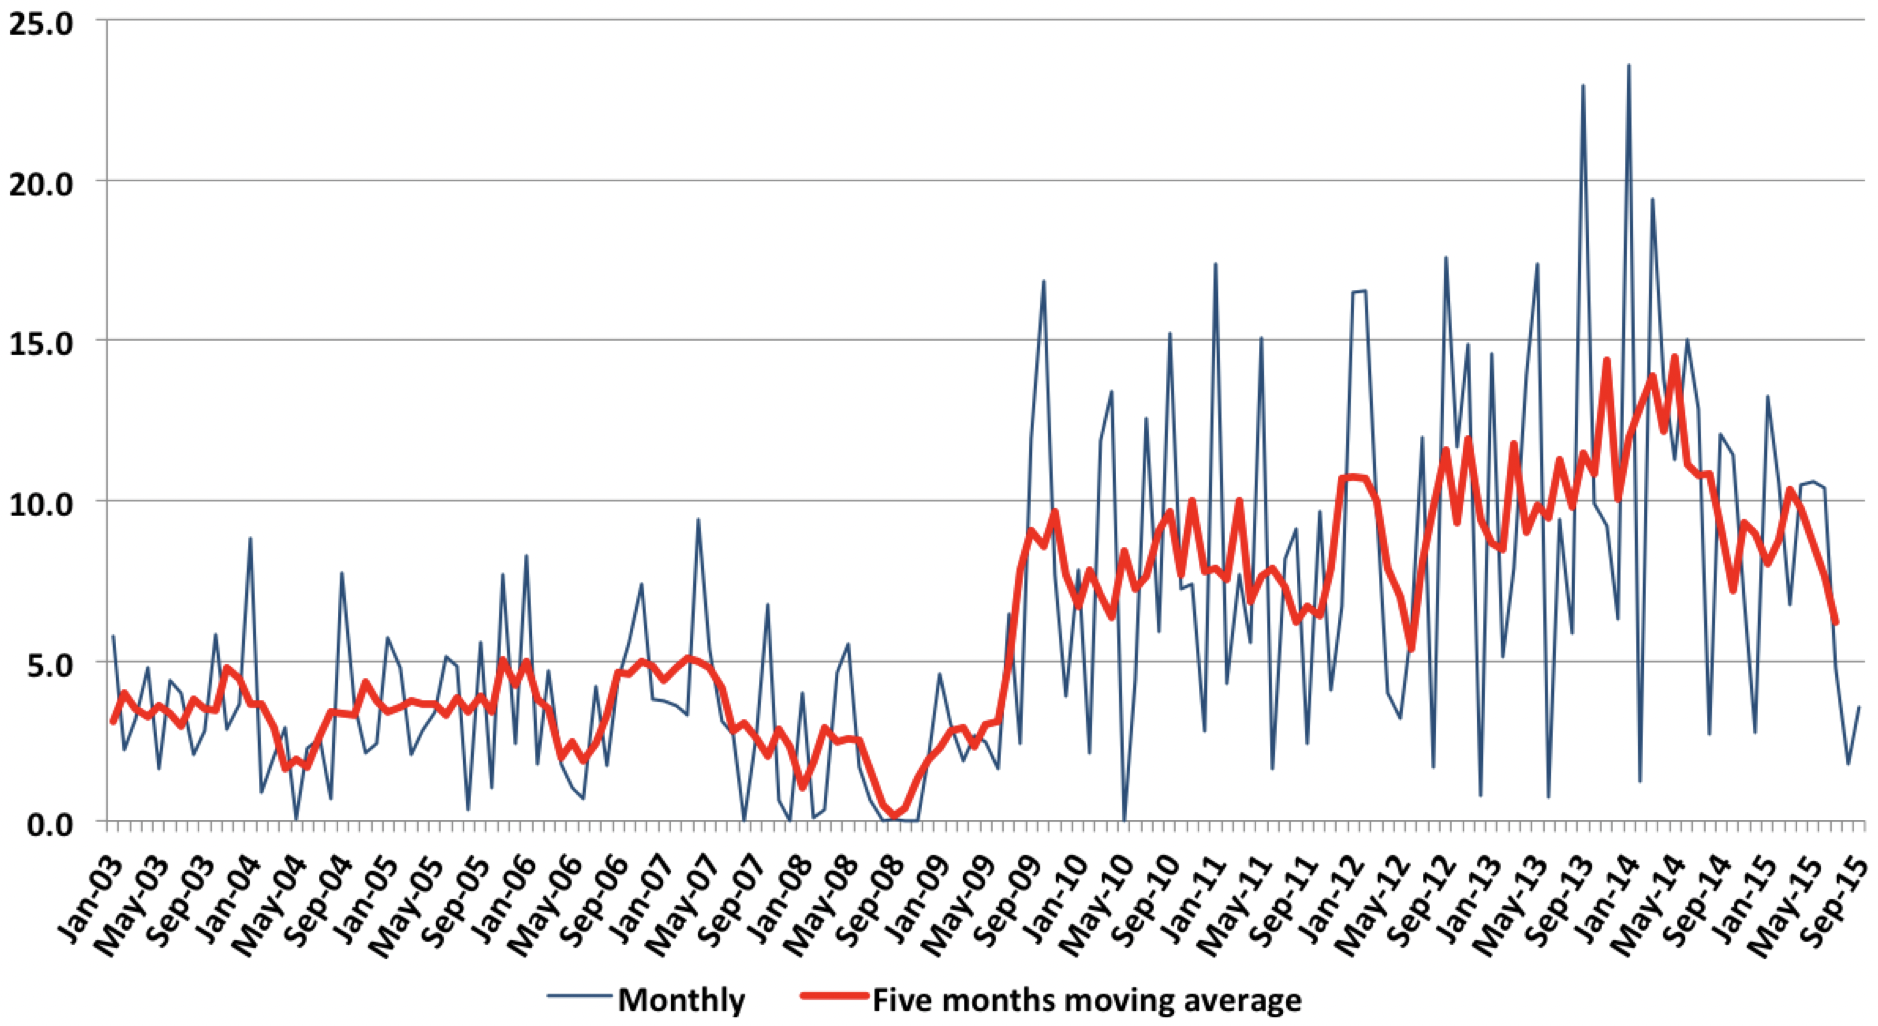
The weakening in access to external financing is, in fact, what the data on bond issues also shows. Recent months have been weak in this regard. However, the tendency of bond markets to temporarily dry up is not an uncommon phenomenon, as Figure 5 shows, and is still much weaker than the turmoil that followed the Lehman collapse. In any case, the recent contraction is broader in scope than the lack of issuance by Brazilian public or private sector agents; Brazil represented only 12.1% of bond issuance in the first half of the year, which were concentrated in the second quarter. So the reduction in the issuance, from a monthly average of $10,335 million in the first six months of the year to $3,375 million in the third quarter, cannot be explained by the contraction of financing to Brazil alone.
As argued in my previous brief, the strong resilience of Latin America’s external financing conditions has two explanations: (i) the significant improvement in the region’s external balance sheet during the 2003-2007 boom (i.e., low external indebtedness mixed with high foreign exchange reserves), which has been followed by only a very moderate deterioration since 2008, and (ii) the high liquidity that characterizes global financial markets, which is likely to continue in the next few years, with only a moderate reversal in the case of the United States. In contrast, the major negative factor is the “potential” current account deficit of the balance of payments that the region accumulated during its post-North Atlantic crisis recovery, which implies that the region not only spent but actually overspent the commodity boom.9 This has been reflected now in high effective current account deficits. Together with a similar phenomenon in the fiscal area—the much weaker fiscal balances vs. those that prevailed prior to the North Atlantic crisis—this explains why Latin America lacks the degrees of freedom to adopt counter-cyclical policies that it enjoyed after the Lehman Brothers shock.
Overall, therefore, both trade and financial shocks have worsened over the past year, though the latter will likely be much milder than during the major crises of the late 20th century. This is on top of the improvement in other dimensions of macroeconomic policy not analyzed here. In any case, because of the growing intensity of the shocks and the reduced degrees of freedom for expansionary macroeconomic policies, Latin America—and South America in particular—will experience very weak performance both in 2015 and in 2016.
Endnotes
1. I prefer this term to “global financial crisis” since, although the crisis had global effects, the financial meltdown was concentrated in the United States and Western Europe.
2. This has raised significant questions about the quality of official GDP statistics, which may underestimate the magnitude of the growth slowdown.
3. See WTO (2015), World Bank (2015, pp. 169-173), and the work of IMF researchers Constatinescu et al. (2015).
4. See the CPB World Trade Monitor, July 2015, at http://www.cpb.nl/en/number/cpb-world-trade-monitor-july-2015.
5. They have also been associated with the appreciation of the U.S. dollar, as the index is estimated in that currency.
6. The weekly index published by The Economist shows a deepening of the fall in commodity prices in late August and early September, reaching 129.5 on September 8 (with a 2005 base similar to that of the IMF). They recovered slightly in mid-September but fell again in the last weeks of the month, reaching 127.0 on September 29.
7. A few countries have been partially or totally shut out from global private capital markets, particularly Argentina, Venezuela, and, to a lesser extent, Ecuador.
8. See in this regard the regular reports and database available at the Inter-American Dialogue, based on the work by Kevin Gallagher at Boston University’s Pardee Center Global Economic Governance Initiative. See http://www.thedialogue.org/map_list/ and http://www.bu.edu/pardeeschool/research/gegi/program-area/chinas-global-reach/china-latin-america-database/.
9. This was already true at the end of the 2003-2007 boom and worsened in later years (Ocampo 2012). For a detailed analysis, see IMF (2013).
References
Constatinescu, Cristina, Aadita Matoo, and Michel Ruta. January 2015. “The Global Trade Slowdown: Cyclical or Structural?” IMF Working Paper 15/6. See also by the same authors “Slow Trade.” December 2014. Finance & Development.
Economic Commission for Latin America and the Caribbean (ECLAC). May 2015. Latin America and the Caribbean and China: Towards a New Era in Economic Cooperation. Santiago: ECLAC.
Erten, Bilge, and José Antonio Ocampo. 2013. “Super-cycles of commodity prices since the mid-nineteenth century.” World Development 44: 14-30.
International Monetary Fund (IMF). May 2013. World Economic and Financial Surveys, Regional Economic Outlook, Western Hemisphere: Time to Rebuild Policy Space. Washington, D.C.: IMF.
Ocampo, José Antonio. 2012. “How Well Has Latin America Fared During the Global Financial Crisis?” In The Global Economic Crisis in Latin America: Impacts and Prospects, edited by Michael Cohen, Chapter 2. Milton Park: Routledge.
Ocampo, José Antonio. 2014. Latin America’s Mounting Economic Challenges. Issue Brief 10.17.14. Rice University’s Baker Institute for Public Policy, Houston, Texas. Available at http://bakerinstitute.org/research/latin-americas-mounting-economic-challenges/.
World Bank. January 2015. Global Economic Prospects. Washington, D.C.: World Bank.
World Trade Organization. April 2015. “Trade Statistics and Outlook: Modest Recovery to Continue in 2015 and 2016 Following Three Years of Weak Expansion.” Press release. Available at https://www.wto.org/english/news_e/pres15_e/pr739_e.htm.
This material may be quoted or reproduced without prior permission, provided appropriate credit is given to the author and Rice University’s Baker Institute for Public Policy. The views expressed herein are those of the individual author(s), and do not necessarily represent the views of Rice University’s Baker Institute for Public Policy.